Recycling and Reprocessing of Polymers: Degradation Mechanisms and Implications for Biomedical Applications
This article provides a comprehensive analysis of polymer degradation during recycling and reprocessing, with a specific focus on implications for biomedical and pharmaceutical development.
Recycling and Reprocessing of Polymers: Degradation Mechanisms and Implications for Biomedical Applications
Abstract
This article provides a comprehensive analysis of polymer degradation during recycling and reprocessing, with a specific focus on implications for biomedical and pharmaceutical development. It explores the fundamental chemical pathways of degradation, including thermal, thermo-mechanical, and enzymatic mechanisms. The content details advanced methodological approaches for characterizing and mitigating degradation, covering both conventional processing and additive manufacturing. It further addresses critical troubleshooting strategies for optimizing polymer stability and performance, and presents validation frameworks for comparing material properties across recycling cycles. Designed for researchers, scientists, and drug development professionals, this review synthesizes current research to support the development of sustainable, high-performance polymeric materials for clinical applications.
The Science of Polymer Degradation: Mechanisms and Molecular Consequences
Frequently Asked Questions (FAQs)
Q1: What are the most common signs that polymer degradation has occurred during processing?
A: Common signs include color changes, such as yellowing or browning, which can range to black with severe degradation [1] [2]. You may also observe a loss of mechanical properties (e.g., tensile strength), the generation of bubbles in the melt (from moisture-induced hydrolysis), and the presence of black specks or carbonized material, which can lead to nozzle or barrel clogging [1] [2].
Q2: How does thermo-oxidative degradation differ from pure thermal degradation?
A: Thermal degradation is initiated solely by heat, which causes random chain scission or end-chain scission, leading to a reduction in molecular weight [3]. Thermo-oxidative degradation involves the presence of oxygen, which reacts with polymer radicals generated by heat to form peroxy radicals and hydroperoxides [3]. This propagation cycle accelerates the degradation process, leading to more severe chain scission, cross-linking, and the formation of carbonyl groups at a faster rate than thermal degradation alone [3].
Q3: Why are some polymers, like PET or PLA, particularly susceptible to hydrolytic degradation?
A: Polymers such as Polyethylene Terephthalate (PET) and Polylactic Acid (PLA) are prone to hydrolytic degradation because their backbones contain functional groups known as ester bonds [4] [3]. These bonds are highly susceptible to cleavage through a reaction with water, especially at elevated temperatures common during processing like extrusion or injection molding [3]. This hydrolysis reaction severs the polymer chains, reducing their molecular weight and compromising material properties.
Q4: What is the impact of multiple processing cycles (e.g., during mechanical recycling) on polymer properties?
A: Each processing cycle subjects the polymer to renewed thermal and shear stresses, which can lead to cumulative degradation [3]. With multiple cycles (as in mechanical recycling), this typically results in a progressive reduction in average molecular weight due to chain scission, a loss of key mechanical properties like impact strength, and a potential change in melt viscosity, making the material increasingly difficult to process and often limiting it to downcycled applications [5] [6] [3].
Q5: What are the key strategies for stabilizing polymers against degradation during processing?
A: Key stabilization strategies include:
- Proper Drying: Removing moisture by drying hygroscopic polymers (e.g., PET, PA, PLA) according to the manufacturer's specifications to prevent hydrolysis [1] [2].
- Optimizing Processing Parameters: Using the lowest feasible melt temperature and minimizing residence time in the barrel to reduce thermal exposure [1] [2].
- Using Stabilizers: Incorporating chemical additives like antioxidants to interrupt the radical propagation cycles of thermo-oxidative degradation [3].
- Preventing Contamination: Ensuring regrind is of high quality and the machine barrel is thoroughly purged to avoid contamination from previously degraded material [1] [2].
Troubleshooting Common Experimental Issues
Problem: Discoloration (Yellowing/Browning) of Polymer During Extrusion
- Possible Cause 1: Excessive barrel temperatures leading to thermal or thermo-oxidative degradation.
- Possible Cause 2: Contamination from previously degraded polymer residue in the barrel or die.
- Solution: Perform a thorough purge of the extruder with a purging compound or a high-flow-rate virgin polymer. Ensure the machine is cleaned properly between experimental runs [1].
- Possible Cause 3: Oxygen presence in the processing environment.
- Solution: If feasible, purge the extruder hopper and feed throat with an inert gas such as nitrogen to create an oxygen-free atmosphere [3].
Problem: Bubble Formation in Extrudate or Printed Part (FFF Additive Manufacturing)
- Possible Cause: Inadequate drying of the polymer, leading to hydrolytic degradation.
- Solution: Dry the polymer feedstock in a suitable oven or hopper dryer according to the material's specific drying guidelines (typically for several hours at a specified temperature). Ensure the dried material is stored in a dry environment or used immediately [1].
Problem: Drastic Drop in Melt Viscosity or Mechanical Strength
- Possible Cause 1: Severe chain scission due to excessive thermo-mechanical degradation from high shear rates.
- Solution: Lower the screw rotation speed. Check screw and barrel for wear that might cause excessive shear. Use a polymer with a higher molecular weight if the application allows [3].
- Possible Cause 2: Overheating or excessive residence time.
- Solution: Review the shot-to-barrel capacity ratio; the shot weight should not be less than 25% of the machine's capacity. Transfer to a machine with a smaller barrel if needed. Optimize the cycle time to reduce residence time [2].
Quantitative Data on Polymer Degradation
Table 1: Bond Dissociation Energies (BDE) for Common Polymer Bonds [3]
| Bond | Aromatic or Heterocyclic BDE (kJ/mol) | Aliphatic BDE (kJ/mol) |
|---|---|---|
| C-C | 410 | 284–368 |
| C=C | - | 615 |
| C-H | 427–435 | 381–410 |
| C-O | 448 | 350–389 |
| C-N | 460 | 293–343 |
Table 2: Characteristic Degradation Pathways and Products of Common Polymers [4] [3]
| Polymer | Primary Degradation Pathway | Key Degradation Products |
|---|---|---|
| Polyethylene (PE) | Thermal-Oxidative | Alkanes, Alkenes, Ketones, Carboxylic Acids |
| Polypropylene (PP) | Thermal-Oxidative | Hydrocarbons, Ketones, Aldehydes |
| Polyvinyl Chloride (PVC) | Thermal / Thermal-Oxidative | Hydrogen Chloride (HCl), Chlorinated Hydrocarbons |
| Polystyrene (PS) | Thermal / Thermal-Oxidative | Styrene Monomer, Oligomers, Aromatic Hydrocarbons |
| Polyethylene Terephthalate (PET) | Hydrolytic | Terephthalic Acid, Ethylene Glycol |
| Polyurethane (PU) | Hydrolytic / Thermal-Oxidative | Polyols, Amines, Carbon Dioxide |
Experimental Protocols for Degradation Analysis
Protocol 1: Assessing Thermo-Oxidative Stability via TGA
Principle: Thermogravimetric Analysis (TGA) measures the mass change of a sample as a function of temperature under a controlled atmosphere. Using an oxidative atmosphere (e.g., air) allows for the study of thermo-oxidative stability.
Methodology:
- Sample Preparation: Prepare 5-20 mg of polymer sample in powder or small film form.
- Instrument Setup: Load the sample into a platinum or alumina TGA crucible. Set the gas flow to synthetic air (80% N₂, 20% O₂) at a standard flow rate (e.g., 50 mL/min).
- Temperature Program: Run a dynamic heating program from room temperature to 800°C at a constant heating rate (e.g., 10°C/min).
- Data Analysis: Determine the onset degradation temperature (Tₒₙₛₑₜ), which is the temperature at which the sample begins to lose mass, and the temperature at maximum degradation rate (Tₘₐₓ) from the derivative of the TGA curve (DTG). The residue at a high temperature (e.g., 600°C) indicates the inorganic or carbonized content.
Protocol 2: Monitoring Molecular Weight Changes via GPC
Principle: Gel Permeation Chromatography (GPC), also known as Size Exclusion Chromatography (SEC), separates polymer molecules by their hydrodynamic volume, allowing for the determination of average molecular weight (Mₙ, M𝄆) and dispersity (Đ) before and after processing.
Methodology:
- Sample Preparation: Dissolve processed and unprocessed (control) polymer samples in an appropriate solvent (e.g., THF for many polymers) at a low concentration (~1-2 mg/mL). Filter the solutions through a 0.45 μm filter to remove any particulates.
- Instrument Calibration: Calibrate the GPC system with narrow dispersity polymer standards of known molecular weight that match the polymer under investigation.
- Analysis: Inject the filtered polymer solution into the GPC system. Use a refractive index (RI) detector or another suitable detector.
- Data Analysis: Compare the molecular weight averages and dispersity of the processed sample to the control. A decrease in Mₙ and M𝄆 and a potential change in Đ are clear indicators of chain scission (or, in some cases, cross-linking) due to degradation [3].
Protocol 3: Investigating Hydrolytic Degradation
Principle: This experiment accelerates hydrolytic degradation by exposing the polymer to elevated temperatures in an aqueous environment, simulating long-term effects or processing with residual moisture.
Methodology:
- Sample Preparation: Prepare compression-molded or injection-molded specimens of standardized dimensions (e.g., dumbbells for tensile testing).
- Ageing Process: Place specimens in sealed containers with deionized water or a buffer solution at a controlled pH. Age the samples in an oven at a temperature below the polymer's glass transition temperature (Tg) but sufficiently high to accelerate the reaction (e.g., 60°C or 70°C).
- Periodic Analysis: Remove samples at predetermined time intervals. Dry them to a constant weight in a vacuum oven.
- Characterization:
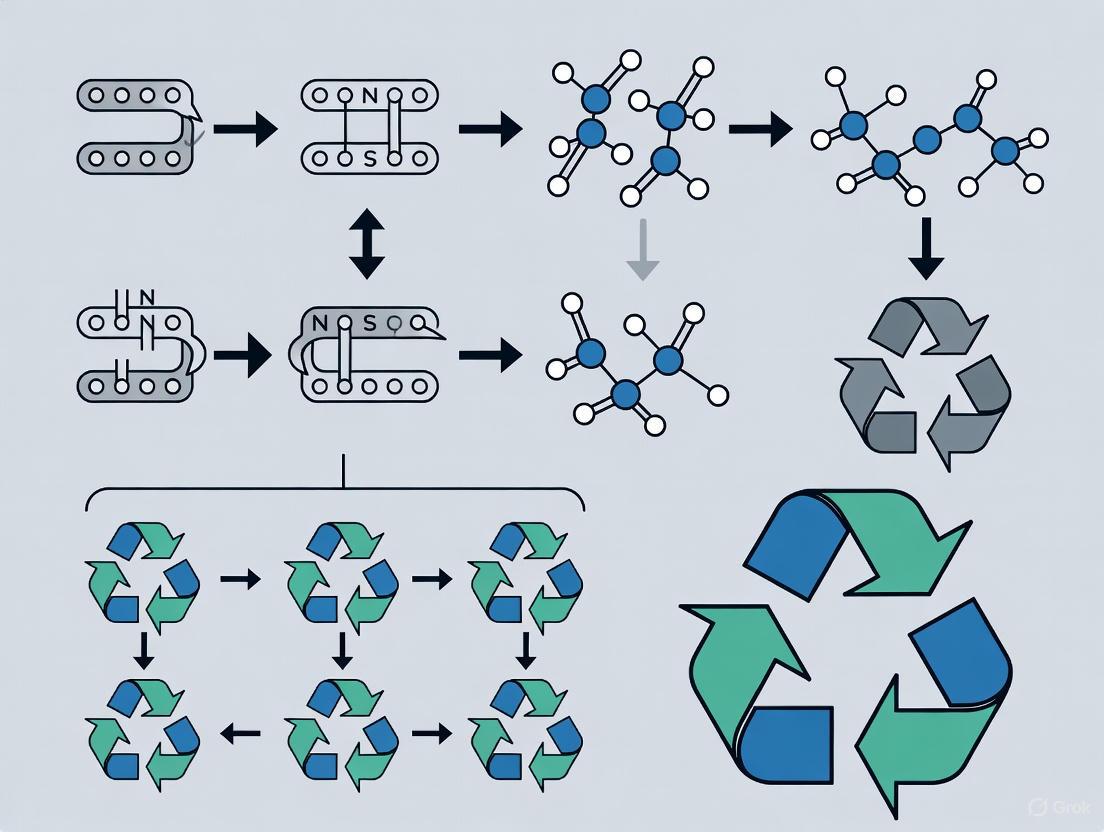
Diagram: Polymer Degradation Pathways
The Scientist's Toolkit: Essential Research Reagents & Materials
Table 3: Key Reagents and Materials for Polymer Degradation and Recycling Research
| Item | Function/Application |
|---|---|
| Inert Gas (N₂ or Argon) | Creates an oxygen-free atmosphere during processing or in a reactor to suppress thermo-oxidative degradation [3]. |
| Stabilizers (Antioxidants) | Chemical additives that scavenge free radicals or decompose hydroperoxides, inhibiting the propagation of degradation reactions during processing [3]. |
| Purging Compounds | Specialized formulations used to clean extruder and injection molding barrels between material changes or experiments, removing residual and potentially degraded polymer [2]. |
| Selective Solvents | Used in solvent-based recycling (e.g., STRAP, CreaSolv) to selectively dissolve and separate specific polymers from mixed waste, recovering near-virgin quality resins [7]. |
| Compatibilizers | Chemicals used in mechanical recycling of polymer blends to improve interfacial adhesion between immiscible polymers, enhancing the properties of the recycled blend [6]. |
Frequently Asked Questions (FAQs)
FAQ 1: What are the primary molecular-level changes that occur during polymer recycling? During mechanical recycling, polymers are subjected to heat and shear forces, which induce two primary, competing molecular-level changes: chain scission and cross-linking [8] [9]. Chain scission is the breaking of the polymer backbone, leading to a reduction in molecular weight and a decrease in melt viscosity [10] [11]. Cross-linking is the formation of new bonds between polymer chains, which increases molecular weight and can lead to gel formation and increased melt viscosity [8] [11]. The dominant mechanism depends on the polymer type and the processing environment [11].
FAQ 2: How does the presence of oxygen influence degradation pathways? The presence of oxygen significantly shifts the dominant degradation mechanism from chain scission to long-chain branching (LCB) and cross-linking [11]. In an inert atmosphere (e.g., N₂), chain scission tends to dominate [11]. However, in an oxygen-rich environment (air), macroradicals react with O₂ to form stable carbonyl and hydroxyl end groups [11]. These groups can act as radical acceptors, promoting reactions between chains and leading to the formation of long-chain branches [11].
FAQ 3: Why do recycled polymers often exhibit reduced mechanical performance? The reduction in mechanical properties, such as tensile strength and impact resistance, is a direct consequence of molecular-level degradation [10] [9]. Chain scission shortens polymer chains, inherently reducing their strength and ability to bear load [10]. While cross-linking can initially increase stiffness, it often leads to embrittlement, as it reduces the material's ability to plastically deform, resulting in a lower failure strain [8]. Furthermore, the formation of oxidation products (e.g., carbonyls) can also compromise material integrity [11].
FAQ 4: How can I quantitatively track degradation during reprocessing? Rheology is a powerful tool for quantifying degradation without the need for extensive extrusion experiments [11]. Key rheological metrics include:
- Complex Viscosity (η*): A decrease suggests chain scission dominates, while an increase points to cross-linking or long-chain branching [11].
- Van Gurp-Palmen (vGP) Plot: The shape of the curve (phase angle δ vs. complex modulus |G*|) is a qualitative indicator of branching. Increasing curvature and a lower phase angle indicate the formation of long-chain branches [11].
- Modulus Crossover (G' = G"): Changes in the crossover point can be used to estimate changes in molecular weight and polydispersity [11].
Advanced chromatographic techniques like Gel Permeation Chromatography (GPC) are used to directly measure the reduction in molar mass (Mₙ, M𝄬) and the broadening of dispersity (Ð), providing direct evidence of chain scission [10].
Troubleshooting Guides
Problem: Severe Loss of Viscosity and Mechanical Strength in Recycled PLA
- Observed Issue: The recycled polymer flows too easily, and the final product is weak and brittle [10].
- Molecular Cause: Dominant chain scission during reprocessing. Hydrolysis at the ester linkage and shear-induced thermal degradation are the primary culprits, leading to a significant reduction in molecular weight [10] [9].
- Solutions:
- Ensure thorough drying of the material before processing to minimize hydrolytic degradation [10] [9].
- Optimize processing parameters: Reduce melt temperature and shear rates (e.g., lower screw speed) to minimize thermal and thermo-mechanical degradation [10] [9].
- Consider using a chain extender," a reactive additive that can reconnect cleaved chains and partially restore molecular weight [12].
Problem: Increased Viscosity, Gel Formation, and Discoloration in Recycled Polyolefins
- Observed Issue: The material is difficult to process, shows signs of cross-linked gels, and has turned yellow or brown [13] [11].
- Molecular Cause: Dominant cross-linking and long-chain branching driven by thermo-oxidative degradation [11]. The presence of oxygen at high processing temperatures leads to the formation of radicals that recombine into branched structures [8] [11].
- Solutions:
- Process under an inert atmosphere (e.g., nitrogen purging) if possible, to limit oxygen exposure [11].
- Incorporate antioxidants into the recyclate. These additives scavenge free radicals, inhibiting the oxidation pathway that leads to cross-linking [14] [12].
- Optimize residence time in the processing equipment to avoid excessive heat history [2] [13].
Problem: Inconsistent Batch-to-Batch Quality of Post-Conser Recyclate (PCR)
- Observed Issue: The properties of the recycled feedstock are highly variable, making it difficult to guarantee product performance [11].
- Molecular Cause: Uncontrolled and variable degradation pathways due to unknown history, contamination, and mixed polymer grades [11]. Different contaminants and initial molecular structures degrade at different rates and via different mechanisms [11].
- Solutions:
- Implement a rapid quality control method using rheology to "fingerprint" the recyclate's degradation propensity before large-scale processing [11].
- Improve feedstock sorting and washing to reduce contamination from other polymers, labels, and organic residues [12].
- Use stabilizer packages designed for recycled materials to create a more consistent and robust processing window [14] [12].
Quantitative Data on Polymer Degradation
Table 1: Quantifiable Molecular Changes in PLA During Multiple Extrusion Cycles [10]
| Reprocessing Cycle | Number Average Molar Mass (Mₙ) Reduction | Crystallinity (%) | Melt Flow Index (MFI) Change |
|---|---|---|---|
| Virgin (PLA0) | Baseline | 6.9% | Baseline |
| 1st Cycle (rPLA1) | ~10% reduction | ~15% (est.) | Increased |
| 3rd Cycle (rPLA3) | ~25% reduction | ~25% (est.) | Significantly Increased |
| 6th Cycle (rPLA6) | ~40% reduction | 39.5% | Greatly Increased |
Table 2: Rheological Indicators of Polyethylene Degradation Under Different Environments [11]
| Processing Environment | Dominant Mechanism | Change in Complex Viscosity (η*) | Change in vGP Plot | Molecular Consequence |
|---|---|---|---|---|
| Nitrogen (N₂) | Chain Scission | Increase of ~14% (at 10 rad/s) | Flattened curve | Slight branching possible |
| Air (Oxygen Present) | Long-Chain Branching | Increase 5x greater than in N₂ (at 0.1 rad/s) | Increased curvature, lower phase angle | Significant branching and cross-linking |
Detailed Experimental Protocols
Protocol: Simulating Mechanical Recycling via Rheology
This protocol uses a rheometer to simulate the shear and thermal history of multiple extrusion cycles, providing a rapid assessment of a polymer's degradation propensity [11].
- Sample Preparation: Cut or compression-mold the polymer (virgin or recyclate) into disks that fit the rheometer plate geometry.
- Instrument Setup: Equip the rheometer with parallel plates and an environmental test chamber capable of gas purging.
- Loading and Melting: Load the sample onto the pre-heated plate (set to the typical processing temperature, e.g., 180°C for PLA, 190°C for HDPE). Trim excess material and close the gap.
- Environment Control: Purge the measurement chamber with the desired gas (Nitrogen for inert conditions, Air for oxidative conditions) for at least 5 minutes before and during the test.
- Oscillatory Time-Treatment: Apply a constant oscillatory shear stress or strain at a fixed frequency (e.g., 1-10 rad/s) for a prolonged period (e.g., 1-3 hours) to simulate mechanical recycling.
- Intermittent Frequency Sweeps: At regular intervals (e.g., every 20 minutes), run a full frequency sweep (e.g., 0.1 to 100 rad/s) to monitor the evolution of the viscoelastic properties (G', G", η*).
- Data Analysis: Plot the complex viscosity and Van Gurp-Palmen plots (Phase Angle δ vs. |G|) for each interval. A decreasing η and flattened vGP plot indicate chain scission. An increasing η* and more curved vGP plot indicate long-chain branching [11].
Protocol: Quantifying Chain Scission via Gel Permeation Chromatography (GPC)
This protocol measures the direct reduction in molecular weight, the hallmark of chain scission [10].
- Solution Preparation: Dissolve the polymer samples (virgin and recycled) in an appropriate solvent (e.g., THF for many polymers) at a low concentration (~1-2 mg/mL). Filter the solutions through a 0.45 μm filter to remove any gel particles or impurities.
- GPC System Calibration: Calibrate the GPC system using narrow dispersity polymer standards of known molecular weight that match the polymer being analyzed.
- Sample Injection: Inject a precise volume of the filtered polymer solution into the GPC system.
- Chromatogram Acquisition: The system separates polymer chains by their hydrodynamic volume as they pass through the columns. A detector (e.g., refractive index) records the elution time and concentration.
- Data Analysis: Software converts the elution time data into molecular weight distributions. Compare the number-average molar mass (Mₙ), weight-average molar mass (M𝄬), and dispersity (Ð) of the recycled samples to the virgin material. A consistent decrease in Mₙ and M𝄬 is quantitative evidence of chain scission [10].
Degradation Pathways and Experimental Workflows
The Scientist's Toolkit: Research Reagent Solutions
Table 3: Essential Materials and Reagents for Polymer Degradation Research
| Reagent / Material | Function in Research | Example Application |
|---|---|---|
| Antioxidants (e.g., Hindered Phenols, Phosphites) | Scavenge free radicals to inhibit thermo-oxidative degradation during processing [14] [12]. | Added to recyclate to stabilize it and prevent cross-linking and discoloration during multiple extrusion cycles [14]. |
| Chain Extenders (e.g., Epoxy-functionalized, Carbodiimides) | Reconnect cleaved polymer chains through reactive group coupling, counteracting chain scission [12]. | Used to restore the molecular weight and melt viscosity of recycled condensation polymers like PLA or PET [12]. |
| Stabilizer Packages (e.g., UV absorbers, Hindered Amine Light Stabilizers) | Protect the polymer from various environmental degradation factors beyond processing [14]. | Incorporated into recycled products intended for outdoor use to enhance their long-term durability [14]. |
| Purge Compounds | Specialized formulations to clean processing equipment (extruders, injection molders) of degraded polymer residues [13]. | Used during material changeover or machine shutdown/startup to prevent contamination of new batches with black specks from carbonized degraded polymer [13]. |
| Inert Gas (e.g., Nitrogen N₂) | Creates an oxygen-free processing environment to minimize thermo-oxidative degradation [11]. | Used to purge the barrel of an extruder or the chamber of a rheometer during reprocessing experiments to study/control degradation mechanisms [11]. |
Frequently Asked Questions (FAQs)
FAQ 1: What are the primary degradation mechanisms that occur during the mechanical recycling of polymers?
During mechanical recycling, polymers are predominantly subjected to thermal, thermo-mechanical, and thermal-oxidative degradation due to the high temperatures and shear forces experienced during processes like extrusion and injection molding [9]. These processes can cause chain scission (breaking of the polymer backbone), cross-linking, or the formation of new functional groups, all of which alter the polymer's fundamental structure [9]. For polyesters, hydrolytic degradation is also a significant concern if moisture is present during processing [9].
FAQ 2: How does a change in Molecular Weight (Mw) and Polydispersity Index (PDI) affect the performance of a recycled polymer product?
A decrease in Mw, typically resulting from chain scission, directly leads to a reduction in key mechanical properties such as tensile strength, toughness, and impact resistance [15] [16]. An increase in PDI indicates a broader molecular weight distribution, often signifying inconsistent degradation and potentially leading to unpredictable processing behavior and final product performance, such as variations in melt viscosity and brittleness [15]. In applications like amorphous solid dispersions for pharmaceuticals, minute changes in Mw and PDI can significantly impact the dissolution performance of a drug [15].
FAQ 3: Why do some polymers become brittle after repeated recycling cycles?
Brittleness is primarily a consequence of chain scission reducing the average molecular weight, which shortens the polymer chains and limits their ability to entangle and absorb energy [16] [14]. Additionally, certain degradation mechanisms, like photo-oxidation, can lead to embrittlement, surface cracking, and discoloration [14] [17]. For some polymers, cross-linking during degradation can also increase brittleness by reducing the chain mobility between cross-links [17].
FAQ 4: What analytical techniques are essential for characterizing polymer degradation in a research setting?
Key techniques include:
- Gel Permeation Chromatography (GPC): Essential for tracking changes in Molecular Weight and PDI [15].
- Fourier Transform Infrared (FTIR) Spectroscopy: Identifies the formation of new functional groups (e.g., carbonyl groups from oxidation) [16].
- Thermal Analysis (DSC/TGA): Monitors changes in thermal properties like glass transition temperature (Tg) and thermal stability [15].
- Mechanical Testing: Measures the loss of properties like tensile strength and elongation at break [16].
- Rheological Evaluations: Assesses changes in melt viscosity, which is directly influenced by Mw [15].
Troubleshooting Common Experimental Issues
Issue: Inconsistent Mechanical Properties in Reprocessed Polymer Samples
| Observation | Potential Cause | Solution |
|---|---|---|
| High variability in tensile strength and elongation at break between batches. | Inconsistent degradation due to fluctuating processing parameters (temperature, shear rate) or moisture content. | Standardize and tightly control processing conditions (temperature, screw speed). Ensure polymers are thoroughly dried before processing according to manufacturer guidelines [1]. |
| A significant drop in impact resistance after recycling. | Severe chain scission leading to a critical reduction in molecular weight. | Optimize processing temperature to the minimum required to reduce thermal degradation. Consider incorporating stabilizers or blending with virgin material to restore properties [9]. |
| Polymer melt becomes too fluid and difficult to control during extrusion. | Advanced chain scission has significantly lowered the average molecular weight. | Gradually decrease processing temperatures in small increments (e.g., 5°C) and minimize residence time in the extruder [1]. |
Issue: Unwanted Color Formation (Yellowing/Browning) During Processing
| Observation | Potential Cause | Solution |
|---|---|---|
| Polymer exhibits yellow or brown discoloration after extrusion. | Thermal-oxidative degradation leading to the formation of chromophores [9]. | Ensure the processing temperature is below the polymer's degradation onset temperature. Use an inert atmosphere (e.g., nitrogen purging) during processing to minimize oxidative degradation [9]. |
| Burnt particles are present in the extrudate, contaminating the product. | Localized overheating or contamination from previously degraded polymer residue in the equipment. | Immediately purge the extruder. Perform a thorough cleaning of the barrel and screw before starting new experiments [1]. |
Experimental Protocols for Degradation Research
Protocol 1: Investigating Thermo-Oxidative Degradation during Simulated Recycling
Objective: To quantify the impact of multiple extrusion cycles on the molecular weight, dispersity, and mechanical integrity of a target polymer.
Materials:
- Polymer pellets (e.g., PLA, PP)
- Twin-screw extruder
- Granulator
- Gel Permeation Chromatography (GPC) system
- Tensile testing machine
- Differential Scanning Calorimeter (DSC)
Methodology:
- Preparation: Dry the polymer pellets thoroughly to eliminate hydrolytic degradation as a variable.
- Initial Characterization: Analyze the virgin material using GPC (for Mw and PDI), DSC (for Tg and Tm), and tensile testing (for baseline mechanical properties).
- Processing Cycle: a. Process the polymer through the extruder at a predetermined temperature profile and screw speed. b. Quench the extrudate in a water bath and pelletize it using a granulator.
- Repeated Processing: Subject the pelleted material to repeated cycles of extrusion and granulation (e.g., up to 5 cycles).
- Post-Processing Analysis: After each processing cycle, collect a sample and perform the same characterization as in Step 2.
Expected Outcomes: With an increasing number of processing cycles, you will typically observe a progressive decrease in molecular weight, an increase in PDI, a reduction in tensile strength and elongation at break, and potential changes in thermal transition temperatures.
Protocol 2: Accelerated Aging to Study UV Degradation
Objective: To evaluate the surface and bulk property changes of polymers upon exposure to UV radiation.
Materials:
- Polymer films or injection-molded plaques
- UV aging chamber (e.g., with a Xenon arc lamp per ISO 4892-2)
- FTIR Spectrometer
- Impact tester
- Scanning Electron Microscope (SEM)
Methodology:
- Baseline Testing: Characterize the initial surface chemistry (FTIR), mechanical properties (impact strength), and surface morphology (SEM).
- UV Exposure: Place samples in the UV aging chamber. Exposure conditions should be set according to relevant standards (e.g., specific wavelength, irradiance, chamber temperature, and relative humidity) to simulate real-world conditions [17].
- Periodic Sampling: Remove samples at regular intervals (e.g., 250, 500, 1000 hours).
- Post-Exposure Analysis: Repeat the baseline tests on the exposed samples. FTIR is particularly useful for detecting the formation of carbonyl groups from photo-oxidation.
Expected Outcomes: UV exposure typically leads to surface cracking, chalking, and embrittlement. FTIR will show an increase in carbonyl index, impact strength will drop significantly, and SEM images will reveal micro-cracks and surface pitting [17].
The Scientist's Toolkit: Research Reagent Solutions
| Reagent / Material | Function in Degradation Research |
|---|---|
| Antioxidants | Inhibit oxidative degradation by scavenging free radicals that are generated during thermal processing, thereby helping to maintain molecular weight and mechanical properties [9]. |
| UV Stabilizers | Absorb or screen out harmful UV radiation to protect polymers from photo-oxidative degradation, delaying surface embrittlement and color changes [14]. |
| HALS (Hindered Amine Light Stabilizers) | A highly effective class of UV stabilizers that inhibit the degradation cycle by neutralizing free radicals formed during photo-oxidation [18]. |
| Chain Extenders | Used in recycling to repair polymer chains that have undergone scission. They can increase the molecular weight and improve melt viscosity, thus restoring some mechanical performance [9]. |
The following table summarizes quantitative data on how degradation impacts key polymer properties, as reported in research.
Table 1: Quantitative Impact of Degradation on Polymer Properties
| Polymer Type | Degradation Condition | Change in Mw | Change in PDI | Impact on Mechanical Properties | Source |
|---|---|---|---|---|---|
| PVP-VA64 (Pharmaceutical Polymer) | Hot-Melt Extrusion (HME) | Decrease | Increase (broader mass distribution) | Impacts dissolution performance & API supersaturation | [15] |
| Fibre/Epoxy Composite | UV Ageing (80 days) | Not Specified | Not Specified | Longitudinal Compressive Strength: Reduced to 51% of original. Flexural Strength: Reduced to 77% of original. | [17] |
| General Polymers | Thermal & Thermo-mechanical Processing | Decrease (via chain scission) | Increase | Reduction in tensile strength, toughness, and elongation at break. | [16] [9] |
Visualization of Degradation Pathways and Workflows
Degradation Pathways in Polymer Recycling
Experimental Workflow for Recycling Study
Frequently Asked Questions (FAQs) and Troubleshooting Guide
FAQ 1: Why is the degradation rate of my polyester-based medical device (e.g., PLA screw) not matching literature values in my in vitro tests?
- Answer: The degradation rate of biodegradable polyesters is highly sensitive to experimental conditions. A common discrepancy arises from differences in the hydrolytic degradation environment.
- Check Your Buffering Solution: Polyesters like PLA and PLGA degrade primarily through hydrolysis of ester bonds, releasing acidic byproducts (e.g., lactic acid). If the buffer capacity of your in vitro medium is insufficient, the local pH will drop, autocatalyzing the degradation process and leading to faster-than-expected rates [19]. Ensure you use a well-buffered solution (e.g., PBS) with a capacity that mimics the buffering action of physiological fluids.
- Monitor Molecular Weight and Mass Loss: Degradation is a multi-stage process. The onset of significant mass loss often occurs only after the polymer's molecular weight has decreased substantially [19]. Simultaneously track both molecular weight (via GPC) and mass loss to get a complete picture of the degradation profile.
- Consider Device Morphology and Crystallinity: The initial molecular weight, crystallinity, and physical form of the polymer significantly impact water diffusion and degradation. Enzymatic degradation also targets amorphous regions more readily than crystalline ones. Characterize these initial material properties to make a valid comparison with literature data [20] [21].
FAQ 2: We are researching the biodegradation of polyolefins (e.g., PE, PP) for sustainable applications. Why do we observe minimal degradation even with microbial consortia in our bioreactors?
- Answer: Polyolefins are inherently recalcitrant to biodegradation due to their hydrophobic nature, high molecular weight, and stable C-C and C-H bonds, which are inaccessible to microbial enzymes without pre-treatment [22] [23].
- Implement a Pre-oxidation Step: The biodegradation of polyolefins typically requires an initial abiotic oxidation step (oxo-biodegradation). Consider pre-treating your polymer samples with UV light or heat to introduce carbonyl groups (ketones, carboxylic acids) into the polymer backbone. This breaks the chains and creates sites for microbial enzyme attachment [22] [23]. You can monitor the success of pre-treatment by measuring the Carbonyl Index using FTIR spectroscopy.
- Verify Biofilm Formation: Microbial degradation often begins with the formation of a biofilm on the polymer surface. Use techniques like scanning electron microscopy (SEM) to confirm that your microbial consortia are successfully adhering to and colonizing the polymer surface, a stage known as biodeterioration [22].
- Characterize the Final Products: To confirm biodegradation is occurring, analyze the output for products of bioassimilation and mineralization, such as carbon dioxide (under aerobic conditions) or methane (under anaerobic conditions), in addition to monitoring physical changes in the polymer [21].
FAQ 3: How can we accurately control and predict the service life of a biodegradable polyester scaffold for tissue engineering?
- Answer: Controlling the service life involves tailoring the polymer's properties and understanding the degradation kinetics.
- Leverage Copolymer Ratios: The degradation rate of copolymers like PLGA can be finely tuned by adjusting the ratio of its monomers. For example, increasing the proportion of glycolide (GA) relative to lactide (LA) in PLGA accelerates degradation. A PLGA 50:50 degrades significantly faster than a PLGA 75:25 [19].
- Control Crystallinity: Processing conditions (e.g., annealing, cooling rate) can be adjusted to modify the polymer's crystallinity. Since amorphous regions degrade faster, a more crystalline polymer will generally have a longer service life [19] [21].
- Use Accelerated Ageing Tests Judiciously: Standardized accelerated ageing tests (e.g., under elevated temperature or UV light) can provide comparative data. However, when predicting absolute service life, ensure the accelerated conditions do not alter the fundamental degradation mechanism. Always validate these predictions with real-time studies under relevant conditions [23].
FAQ 4: Our experiments on styrene-based materials (e.g., PS) show conflicting biodegradation results. What are the key factors to consider in experimental design?
- Answer: The biodegradation of polystyrene (PS) is challenging and highly dependent on specific microbial strains and environmental conditions.
- Source Specialized Microorganisms: Only certain microorganisms possess the enzymatic machinery to initiate PS breakdown. Consider sourcing strains reported in the literature, such as Rhodococcus ruber or organisms isolated from the gut of plastic-eating waxworms [22]. The presence of a benzene ring in PS makes it particularly recalcitrant [22].
- Employ Appropriate Analytical Techniques: Weight loss alone is an insufficient metric for slow-degrading polymers like PS. Combine it with more sensitive techniques to detect early-stage degradation:
- Gel Permeation Chromatography (GPC): To detect reductions in molecular weight.
- Fourier-Transform Infrared (FTIR) Spectroscopy: To identify the formation of new oxidative functional groups (e.g., carbonyl groups) on the polymer surface [23].
- Scanning Electron Microscopy (SEM): To visualize surface erosion and cracking.
- Acknowledge the Role of Pre-treatment: Like polyolefins, PS degradation is often enhanced by UV or thermal pre-treatment, which breaks the polymer chains and facilitates microbial attack [22]. Clearly document any pre-treatment steps in your methodology.
Experimental Protocols
Protocol 1: Assessing Hydrolytic Degradation of PolyestersIn Vitro
This protocol outlines a standard method for evaluating the degradation profile of biodegradable polyesters like PLA, PCL, and PLGA under simulated physiological conditions [19].
1. Materials and Reagents
- Polymer Samples: Compression-molded or solution-cast films of the polyester.
- Buffer Solution: Phosphate Buffered Saline (PBS), pH 7.4, with sodium azide (0.02% w/v) to prevent microbial growth.
- Equipment: Incubator or water bath maintained at 37°C, sterile containers (e.g., centrifuge tubes), analytical balance, freeze dryer.
2. Procedure
- Sample Preparation: Cut polymer films into precise dimensions (e.g., 10 mm x 10 mm). Weigh each sample accurately (initial dry weight, W₀) and record initial thickness.
- Immersion: Place each sample in a separate container with a sufficient volume of PBS (e.g., 20 mL per 100 mg of polymer) to ensure sink conditions.
- Incubation: Place the containers in an incubator at 37°C.
- Sampling and Analysis: At predetermined time intervals (e.g., 1, 4, 12, 24 weeks), remove samples in triplicate for analysis.
- Mass Loss: Rinse retrieved samples with deionized water, lyophilize to constant weight, and weigh (final dry weight, *Wᵢ)). Calculate percentage mass loss:
(W₀ - Wᵢ) / W₀ × 100%. - Molecular Weight Change: Analyze the dried samples using Gel Permeation Chromatography (GPC) to track the reduction in molecular weight over time.
- pH Monitoring: Measure the pH of the buffer solution at each time point to track acidification.
- Morphology: Examine the surface and cross-section of degraded samples using Scanning Electron Microscopy (SEM).
- Mass Loss: Rinse retrieved samples with deionized water, lyophilize to constant weight, and weigh (final dry weight, *Wᵢ)). Calculate percentage mass loss:
Key Research Reagent Solutions
| Reagent / Material | Function in the Experiment |
|---|---|
| Phosphate Buffered Saline (PBS) | Simulates the ionic strength and pH of physiological fluids for hydrolytic degradation. |
| Sodium Azide | Prevents microbial growth in the buffer, ensuring degradation is due to hydrolysis and not biodegradation. |
| Gel Permeation Chromatography (GPC) | Analyzes changes in the polymer's molecular weight and distribution, an early indicator of degradation. |
Protocol 2: Evaluating Microbial Degradation of Polyolefins
This protocol describes a method to screen and assess the ability of microorganisms to degrade pre-treated polyolefin films [22].
1. Materials and Reagents
- Polymer Samples: Low-density polyethylene (LDPE) or Polypropylene (PP) films.
- Microbial Inoculum: A pure strain (e.g., Rhodococcus ruber) or a microbial consortium from activated sludge or soil.
- Mineral Salt Medium (MSM): A carbon-free medium containing essential salts to force microbes to utilize the polymer as the sole carbon source.
- Equipment: UV cross-linker or oven for thermal pre-treatment, shaker incubator, sterile glassware, FTIR spectrometer.
2. Procedure
- Polymer Pre-treatment: Expose polymer films to UV radiation (e.g., 254 nm) for a set duration (e.g., 100 hours) or heat to introduce carbonyl groups. Characterize the pre-treated films using FTIR to calculate the initial Carbonyl Index.
- Inoculum Preparation: Grow the microbial strain in a nutrient-rich medium, then harvest and wash the cells to remove residual carbon.
- Inoculation and Incubation: Aseptically place pre-treated polymer films in Erlenmeyer flasks containing MSM. Inoculate with the microbial suspension. Maintain control flasks with polymer but no inoculum, and with inoculum but no polymer.
- Incubation: Incubate the flasks in a shaker incubator (e.g., 30°C, 120 rpm) for several weeks.
- Analysis:
- Biofilm Formation: Periodically check for biofilm formation on the polymer surface using SEM.
- Weight Loss: After incubation, carefully remove the films, clean them to remove adhered biomass, dry, and measure weight loss.
- Surface Analysis: Perform FTIR analysis on the retrieved films to track changes in the Carbonyl Index and other functional groups.
- Metabolic Activity: Monitor microbial growth (e.g., optical density) or CO₂ production in the headspace to confirm bioassimilation.
Table 1: Mechanical and Degradation Properties of Common Biodegradable Polyesters
Data compiled for biomedical applications [19].
| Polymer | Tensile Modulus (MPa) | Ultimate Tensile Strength (MPa) | Elongation at Break (%) | Typical Degradation Time (Months) | Key Degradation Mechanism |
|---|---|---|---|---|---|
| PGA | 7,000 - 8,400 | ~890 | ~30 | 6 - 12 | Hydrolysis (Fast) |
| PLA | ~3,500 | ~55 | 30 - 240 | > 24 | Hydrolysis (Slow) |
| PCL | ~700 | 4 - 28 | 700 - 1000 | > 24 | Hydrolysis & Enzymatic |
| PLGA (50:50) | ~2,000 | ~64 | 3 - 10 | 1 - 3 | Hydrolysis (Rate tunable by LA:GA ratio) |
| PHB | ~3,500 | ~40 | 5 - 8 | > 24 | Hydrolysis |
Table 2: Characteristics of Common Non-(Readily)Biodegradable Polymers
Data relevant to recycling and environmental degradation research [22] [23] [24].
| Polymer | Key Structural Feature | Primary Degradation Challenge | Potential Degradation Approach |
|---|---|---|---|
| Polyethylene (PE) | C-C backbone, hydrophobic | High molecular weight, stable C-C bonds | Oxo-biodegradation (UV/heat pre-treatment + microbial) |
| Polypropylene (PP) | C-C backbone with methyl groups | Steric hindrance from branches | Oxo-biodegradation; more difficult than PE |
| Polystyrene (PS) | C-C backbone with benzene rings | Aromatic ring stability | Specific microbial consortia (e.g., R. ruber); often requires pre-treatment |
| Polyethylene Terephthalate (PET) | Ester bonds + aromatic rings | Crystallinity and aromatic content | Chemical recycling (e.g., glycolysis, hydrolysis); enzymatic degradation |
Degradation Pathway Visualizations
Polyester Hydrolytic Degradation Pathway
Title: Polyester Hydrolytic Degradation Mechanism
Oxo-Biodegradation of Polyolefins
Title: Two-Stage Oxo-Biodegradation of Polyolefins
Troubleshooting Guide & FAQs
This section addresses common challenges you might encounter in your research on polymer degradation and its health effects, providing targeted solutions based on current experimental models.
FAQ 1: How can I accurately quantify micro- and nanoplastic (MNP) accumulation in bone tissue for toxicological assessment?
- Challenge: Researchers often struggle with detecting and quantifying MNPs in complex, calcified tissues like bone, where background interference is high and particle distribution is heterogeneous.
- Solution: Implement a multi-step digestion and extraction protocol followed by advanced spectroscopic confirmation.
- Tissue Preparation: Dissect and clean bone tissue thoroughly to remove adherent soft tissue. Pulverize the sample under liquid nitrogen to a fine powder using a sterile mortar and pestle.
- Organic Matrix Digestion: Digest 1g of pulverized bone tissue using 10 mL of 10% potassium hydroxide (KOH) solution. Incubate at 60°C for 48 hours with continuous agitation to fully dissolve the organic component without degrading common polymers like PS, PE, and PP [25].
- Density Separation: Centrifuge the digestate and resuspend the pellet in a saturated sodium iodide (NaI) solution (density ~1.8 g/cm³). Centrifuge again; MNPs will float to the surface and can be collected by vacuum filtration onto a polycarbonate membrane filter [4].
- Identification and Quantification: Analyze the filtered particles using µ-Fourier Transform Infrared Spectroscopy (µ-FTIR) or Pyrolysis-Gas Chromatography/Mass Spectrometry (Pyr-GC/MS). For bone studies, Pyr-GC/MS is often preferred for its ability to quantify specific polymer masses (e.g., μg of PS per gram of tissue) [25] [4].
FAQ 2: My in vivo model is not showing consistent inflammatory responses to polymer degradation products. What factors should I optimize?
- Challenge: Inconsistent inflammatory outcomes can stem from variable MNP bioavailability, differences in animal model physiology, or inconsistent characterization of the administered dose.
- Solution: Standardize the MNP exposure material and focus on precise delivery routes.
- Particle Characterization: Before exposure, fully characterize the MNPs using Dynamic Light Scattering (DLS) for hydrodynamic diameter and Zeta potential for surface charge. This ensures batch-to-batch consistency [25].
- Exposure Route: For systemic and bone-targeted effects, consider intravenous (IV) injection to bypass gastrointestinal variability. For oral exposure, use gavage with a well-dispersed MNP suspension in a vehicle like 0.05% carboxymethyl cellulose, rather than mixing it into feed, to ensure accurate and consistent dosing [25].
- Endpoint Analysis: Move beyond general cytokine profiling. Focus on specific osteotoxicity markers by analyzing gene and protein expression of key osteoclastogenic factors like RANKL in bone marrow or bone tissue using RT-qPCR and ELISA [25].
FAQ 3: What is the best method to distinguish the toxicity of the polymer particle itself from the toxicity of leached additives?
- Challenge: The inherent toxicity of polymer particulates is often conflated with the effects of chemical additives (e.g., plasticizers, stabilizers) that can leach out, leading to misinterpretation of mechanisms.
- Solution: Employ a rigorous experimental design with appropriate controls.
- Prepare Leachate: Incurate the MNPs (e.g., 1 mg/mL) in the experimental medium (e.g., cell culture medium or saline) under standard culture conditions (37°C, with agitation) for 48 hours. Centrifuge at high speed (e.g., 100,000 × g for 2 hours) to pellet all particles. Carefully collect the supernatant, which is the particle-free leachate [4].
- Design Experimental Groups:
- Group A: Unexposed controls (medium only).
- Group B: Exposed to the full MNP suspension (particles + potential leachates).
- Group C: Exposed only to the particle-free leachate.
- Comparative Analysis: Assess toxicological endpoints (e.g., cell viability, oxidative stress, gene expression) across all groups. A significant effect in Group B but not in Group C points to particle-dominated toxicity. A significant effect in Group C indicates leachate-dominated toxicity [25] [4].
Quantitative Data on MNP Exposure and Effects
The following tables consolidate key quantitative data from recent studies to aid in experimental design and data interpretation.
Table 1: Documented Concentrations of Microplastics in Human Tissues and Fluids
| Matrix/Tissue | Detected Polymers | Average Concentration | Citation |
|---|---|---|---|
| Peripheral Blood | PET, PS, PE | 1.6 μg/mL | [25] |
| Bone Marrow | PE, PS, PVC, PA66, PP | 51.29 μg/g | [25] |
| Weekly Human Ingestion (Estimated) | Various | 0.1 - 5.0 g (equiv. to 74,000–121,000 particles) | [25] [26] |
Table 2: Key Signaling Pathways Implicated in MNP-Induced Osteotoxicity
| Pathway | Cell Type(s) | Primary Experimental Model | Key Outcome(s) | Citation |
|---|---|---|---|---|
| RANKL / NF-κB | Osteoclasts, Macrophages | Rodent Bone Marrow | Promotion of osteoclast differentiation and bone resorption activity. | [25] |
| MAPK | Osteoblasts, Osteoclasts | In Vitro Cell Cultures | Alteration of cell differentiation, proliferation, and apoptosis. | [25] |
| BMP/Smad | Osteoblasts, MSCs | In Vitro Cell Cultures | Disruption of bone formation and homeostasis. | [25] |
| Oxidative Stress (Nrf2/ARE) | Various Bone Cells | In Vivo (Rodent) & In Vitro | Induction of reactive oxygen species (ROS), leading to inflammation and cell damage. | [25] [4] |
Detailed Experimental Protocols
Protocol 1: Assessing Osteoclastogenesis in Primary Bone Marrow-Derived Macrophages (BMMs) Exposed to MNPs
This protocol is critical for evaluating the impact of MNPs on bone resorption.
- BMM Isolation: Euthanize an 8-10 week old C57BL/6 mouse following ethical guidelines. Dissect out femurs and tibiae, and flush the bone marrow cavity with alpha-MEM medium using a sterile 25-gauge needle.
- Cell Culture: Suspend the collected cells in complete alpha-MEM medium (supplemented with 10% FBS, 1% Penicillin-Streptomycin, and 30 ng/mL of Macrophage Colony-Stimulating Factor (M-CSF)). Culture in a humidified incubator at 37°C with 5% CO₂ for 3 days to allow for adherence and proliferation of BMMs.
- MNP Exposure and Differentiation: Seed BMMs in a 96-well plate at a density of 8 x 10³ cells/well. Replace the medium with osteoclastogenic medium (complete alpha-MEM with 30 ng/mL M-CSF and 50 ng/mL RANKL). Add the test MNPs (e.g., 50 nm PS-NPs at 10-100 μg/mL) to the treatment wells. Include a positive control (RANKL only) and a negative control (no RANKL). Refresh the medium and treatments every two days.
- Endpoint Analysis (Day 7):
- Tartrate-Resistant Acid Phosphatase (TRAP) Staining: Fix cells and stain using a commercial TRAP staining kit. Multinucleated (≥3 nuclei) TRAP-positive cells are counted as mature osteoclasts.
- Pit Assay: Seed BMMs on synthetic hydroxyapatite-coated plates. After the differentiation period, visualize resorption pits by light microscopy after washing away the cells. The percentage of resorbed area can be quantified with image analysis software [25].
Protocol 2: Life Cycle Assessment (LCA) for Evaluating Chemical Recycling of Mixed Plastic Waste
This methodology is essential for framing polymer degradation research within the context of sustainable recycling.
- Goal and Scope Definition: Define the objective (e.g., to compare the climate change impact of chemical recycling vs. incineration with energy recovery). Set the functional unit to "management of 1 tonne of mixed plastic waste (MPW)". The system boundaries should include all processes from waste collection to the production of the final recycled product (naphtha) [27].
- Life Cycle Inventory (LCI): Compile energy and material input/output data. For a decentralized pyrolysis plant (e.g., 165 kg/hr capacity), this includes:
- Inputs: Electricity, natural gas for process heat, MPW feedstock.
- Outputs: Primary product (naphtha), by-products (e.g., char, gases), and emissions (CO₂, CH₄, NOₓ) [27].
- Life Cycle Impact Assessment (LCIA): Use LCA software (e.g., SimaPro, OpenLCA) and databases (e.g., ecoinvent) to translate inventory data into environmental impacts. The key category is Global Warming Potential (kg CO₂-equivalent) [27].
- Interpretation: Compare the results against conventional scenarios. For example, the study found a reduction of 1284 kg CO₂-eq. per tonne of MPW when using chemical recycling instead of waste-to-energy incineration [27].
Signaling Pathways and Experimental Workflows
Diagram: MNP-Induced Disruption of Bone Homeostasis
Diagram: Experimental Workflow for In Vivo MNP Osteotoxicity
The Scientist's Toolkit: Research Reagent Solutions
Table 3: Essential Reagents and Materials for Polymer Degradation and Toxicity Research
| Item | Function/Application | Example & Notes |
|---|---|---|
| Polystyrene Nanospheres | Model MNPs for in vitro and in vivo exposure studies. | Available in various sizes (e.g., 50 nm, 100 nm) and surface functionalizations (plain, carboxylated, aminated). Useful for studying particle-size-dependent effects [25]. |
| Recombinant M-CSF | Promotes the survival and proliferation of BMM precursors. | Essential for the in vitro differentiation of osteoclasts from bone marrow cells [25]. |
| Recombinant RANKL | The key cytokine that induces osteoclast differentiation. | Used in combination with M-CSF to generate osteoclasts in culture for bone resorption studies [25]. |
| TRAP Staining Kit | Histochemical identification of mature osteoclasts. | Allows for the quantification of osteoclast number and activity in cell culture or bone tissue sections [25]. |
| KOH Solution | Digests organic biological material for MNP extraction. | Effective for isolating MNPs from complex tissues like bone without significantly degrading common polymers [25] [4]. |
| Synthetic Hydroxyapatite-Coated Plates | Substrate for measuring osteoclast resorptive function. | Used in the pit assay to quantitatively assess the bone degradation capacity of mature osteoclasts in vitro [25]. |
| Pyrolysis-GC/MS System | Quantitative analysis of polymer mass in biological and environmental samples. | The gold-standard method for unequivocally identifying and quantifying specific polymer types (e.g., PS, PE) in complex matrices [25] [4]. |
Analytical Techniques and Processing Technologies for Degradation Assessment
FAQs: Core Techniques in Polymer Degradation Research
Q1: How can rheology detect polymer degradation during mechanical recycling?
Rheological measurements are highly sensitive to changes in molecular structure caused by degradation. A decrease in the zero-shear viscosity (η₀) often indicates a reduction in average molecular weight due to chain scission, a common thermal or thermo-mechanical degradation effect during extrusion or injection molding [28]. Conversely, an increase in the steady-state recoverable compliance (Jₑ⁰) can signal the formation of a branched structure or the presence of a low molecular weight fraction, which alters the elasticity of the polymer melt [28]. These measurements provide a rapid, bulk assessment of molecular changes without the need for dissolution, making them ideal for quality control in recycling processes [3] [28].
Q2: Why is infrared (IR) spectroscopy particularly valuable for analyzing recycled polymers?
IR spectroscopy excels not only in identifying polymer types but also in diagnosing the chemical consequences of degradation. It can directly detect the formation of oxygen-containing functional groups like carbonyls (C=O) and hydroperoxides (ROOH) that result from thermal-oxidative degradation [16] [29]. Furthermore, it can probe the material's physical structure, providing insights into changes in crystallinity and molecular orientation induced by processing history [29]. This makes it a powerful tool for comparing recycled material to virgin polymer references and for assessing batch-to-batch homogeneity [29].
Q3: What chromatographic method is best for quantifying changes in molecular weight after reprocessing?
Size Exclusion Chromatography (SEC), also known as Gel Permeation Chromatography (GPC), is the primary chromatographic technique for this purpose [16] [30]. It separates polymer molecules by their hydrodynamic volume, providing detailed data on the molecular weight distribution (MWD). A shift in the MWD or a decrease in the average molecular weight (e.g., Mₙ, M𝓌) directly confirms chain scission from degradation. An increase in the polydispersity index (Đ) can indicate simultaneous scission and cross-linking events [3]. SEC/GPC is a routine method for understanding the scission and cross-linking processes that occur during polymer degradation [16].
Q4: How do I choose between NIR and MIR spectroscopy for plastics sorting and analysis?
The choice depends on the application and sample characteristics. Near-Infrared (NIR) spectroscopy is fast, requires little to no sample preparation, and is well-suited for rapid identification and sorting of clean plastics based on their distinct spectral features [31]. However, it is less effective for black plastics containing carbon black, which absorbs NIR radiation [31]. Mid-Infrared (MIR) spectroscopy probes fundamental molecular vibrations, providing richer chemical information and is more effective for analyzing filled or dark-colored polymers, as it can be used with techniques like ATR that are less affected by strong absorbers [29] [31].
Troubleshooting Guides
Rheometry: Interpreting Complex Viscosity Data
A researcher is analyzing a recycled polypropylene melt and observes an unexpected rheological response.
- Problem: The complex viscosity curve shows a significant drop at low frequencies compared to the virgin material.
- Investigation & Solution:
| Observation | Possible Cause | Underlying Degradation Mechanism | Confirmatory Experiment |
|---|---|---|---|
| Drop in low-frequency viscosity and modulus. | Reduction in average molecular weight. | Chain scission due to thermo-mechanical stress during reprocessing [3]. | Perform SEC/GPC to measure the molecular weight distribution and confirm the shift [3]. |
| Increase in elasticity (Jₑ⁰) and a broader relaxation time spectrum. | Formation of long-chain branching or a high molecular weight tail. | Cross-linking or branching via radical recombination during thermal-oxidative degradation [3] [28]. | Conduct elongational rheometry to check for strain hardening, a signature of long-chain branching [28]. |
Chromatography: SEC/GPC Analysis of Degraded Polymers
A scientist runs an SEC test on a mechanically recycled polyester and encounters issues with the chromatogram.
- Problem: The SEC chromatogram shows peak broadening and a shifting baseline.
- Investigation & Solution:
| Symptom | Potential Issue | Root Cause in Recycling Context | Corrective Action |
|---|---|---|---|
| Broad, tailing peaks. | Column overloading or undesirable interactions between the analyte and the stationary phase. | Presence of low molecular weight fragments (degradation products) or additives from the waste stream [3]. | Reduce the injection volume or concentration. Use a guard column. Ensure the eluent is a good solvent for all potential degradation products [32]. |
| Shifting or drifting baseline. | Contamination of the system or detector cell by previous samples. | Carry-over of polymer additives (e.g., stabilizers, plasticizers) or degraded oligomers [32]. | Flush the system thoroughly with a strong solvent. Use a dedicated column for recycled materials analysis. Filter samples to remove insoluble gel particles [32]. |
Spectroscopy: FTIR for Oxidation Tracking
An analyst uses FTIR to monitor oxidation in polyethylene after multiple extrusion cycles but gets noisy, inconsistent data.
- Problem: The carbonyl index calculation is inconsistent between replicate samples.
- Investigation & Solution:
| Symptom | Likely Reason | Impact on Degradation Assessment | Corrective Action |
|---|---|---|---|
| High noise in the carbonyl region (~1715 cm⁻¹). | Poor contact between the sample and ATR crystal, or an insufficient number of scans. | Inaccurate quantification of the oxidation level, leading to unreliable conclusions about material stability [29]. | Ensure the sample is pressed firmly and uniformly against the crystal. Increase the number of scans to improve the signal-to-noise ratio. |
| Inconsistent absorbance values. | Sample inhomogeneity and surface irregularities. | Recycled polymer batches are often inhomogeneous; a non-representative measurement leads to high data variance [29]. | Prepare a homogeneous film via compression molding [29]. Take spectra from multiple spots on the sample and average the results. |
Experimental Protocols
Protocol 1: Monitoring Thermal-Oxidative Degradation via FTIR
Aim: To quantify the level of oxidation in a polyolefin (e.g., PE or PP) sample subjected to multiple extrusion cycles.
Materials:
- FTIR spectrometer with ATR accessory
- Compression molding press
- Virgin and recycled polymer pellets
Method:
- Sample Preparation: Compression mold pellets into uniform thin films (~100 µm thickness) using a predefined cycle (e.g., 200°C for 2 minutes) [29].
- Data Acquisition:
- Place the film on the ATR crystal.
- Collect a background spectrum.
- Collect sample spectra in the range of 4000–400 cm⁻¹ with a resolution of 4 cm⁻¹ and 32 scans per spectrum.
- Repeat the measurement on at least three different spots of the film.
- Data Analysis:
- Use a baseline correction method (e.g., subtracting the absorbance at a non-absorbing wavelength like ~1900 cm⁻¹) [31].
- Calculate the Carbonyl Index using the following formula, which uses an internal reference peak to normalize the data:
- Carbonyl Index = (Area under carbonyl peak ~1715 cm⁻¹) / (Area under reference peak ~1460 cm⁻¹ or ~2849 cm⁻¹) [16] [29].
Protocol 2: Assessing Molecular Weight Change via SEC/GPC
Aim: To determine the change in molecular weight and distribution of a polymer after a reprocessing step.
Materials:
- SEC/GPC system with refractive index (RI) detector
- Appropriate columns (e.g., 3x mixed-bed columns)
- Solvent (e.g., THF for PS, PLA; TCB for PE, PP at high temperature)
- Narrow dispersity polymer standards for calibration
Method:
- Sample Preparation: Dissolve the virgin and recycled polymer samples in the eluent at a concentration of ~1–2 mg/mL. Agitate gently for several hours until fully dissolved. Filter the solution through a 0.45 µm PTFE syringe filter [30].
- System Calibration: Run a series of narrow MWD standards to create a calibration curve of log(Molecular Weight) vs. elution time/volume.
- Chromatographic Run:
- Set the appropriate flow rate (e.g., 1.0 mL/min for THF) and column temperature.
- Inject the filtered sample solution and acquire the chromatogram.
- Data Analysis:
- Use the calibration curve to calculate the number-average (Mₙ) and weight-average (M𝓌) molecular weights, and the polydispersity index (Đ = M𝓌/Mₙ) for both virgin and recycled samples.
- A decrease in Mₙ and M𝓌 indicates chain scission. An increase in Đ suggests a broadening of the MWD, often due to simultaneous degradation processes [3].
Analytical Techniques for Polymer Degradation
Table 1: Key Characterization Techniques for Recycling Research
| Technique | Measures | Information Obtained | Application in Recycling Research |
|---|---|---|---|
| Rheology [28] | Zero-shear viscosity (η₀), Steady-state compliance (Jₑ⁰), Relaxation spectrum | Molecular weight changes, branching/cross-linking, melt stability | Quick assessment of degradation extent after reprocessing; quality control for recycled pellet batches. |
| FTIR Spectroscopy [16] [29] | Absorbance of specific chemical bonds (e.g., C=O, O-H) | Formation of oxidation products, chemical composition, polymer identification | Tracking thermo-oxidative degradation; identifying contaminants in sorted waste streams. |
| SEC/GPC [16] [3] [30] | Molecular weight distribution, Mₙ, M𝓌, Đ | Direct measure of chain scission and cross-linking | Quantifying the molecular damage from multiple processing cycles; establishing processing-structure relationships. |
| Thermal Analysis (TGA) [30] | Weight loss as a function of temperature | Thermal stability, filler content, volatile degradation products | Determining the processing temperature window for recycled materials; analyzing additive content. |
Table 2: Spectroscopic Signatures of Polymer Degradation
| Polymer | Degradation Type | Key Spectral Changes (Wavenumber, cm⁻¹) | Assigned Chemical Change |
|---|---|---|---|
| Polyolefins (PE, PP) [16] [29] | Thermal-Oxidative | ~1715 (s), ~3400 (broad) | Formation of carbonyl groups (ketones, acids); formation of hydroperoxides and alcohols. |
| Polyesters (PET, PLA) [3] | Hydrolysis | ~1715 (broadening), ~3500 (broad) | Increase in terminal carboxylic acid groups; increase in hydroxyl groups. |
| General | Chain Scission | Changes in fingerprint region (1400-600) | Alterations in crystallinity bands and chain end groups. |
Research Reagent Solutions
Table 3: Essential Materials for Polymer Degradation Analysis
| Reagent / Material | Function | Example Use-Case |
|---|---|---|
| Antioxidants (e.g., Hindered phenols, Phosphites) [3] | Stabilize polymer melts during processing and analysis by scavenging free radicals and decomposing hydroperoxides. | Added to recycled polymer melts during rheological testing to prevent additional thermal-oxidative degradation from affecting the measurement [3]. |
| HPLC/SEC Grade Solvents (e.g., THF, TCB) [32] [30] | Act as the mobile phase for SEC/GPC; must be pure and degassed to prevent column damage and baseline artifacts. | Dissolving polymer samples for SEC analysis to accurately determine molecular weight distribution after degradation [30]. |
| Compression Molded Films [29] | Create uniform, thin samples for transmission or ATR-FTIR spectroscopy, ensuring reproducible and quantitative results. | Preparing standardized samples from recycled pellets for reliable tracking of the carbonyl index evolution [29]. |
| Narrow Dispersity Polymer Standards [30] | Calibrate the SEC/GPC system to convert elution volume into molecular weight. | Essential for generating accurate molecular weight data for virgin and degraded polymers, allowing for direct comparison. |
Signaling Pathways and Workflows
Diagram 1: Polymer Degradation Analysis Workflow. This chart illustrates the pathway from polymer reprocessing to degradation, resulting molecular changes, and the advanced characterization techniques used for detection.
Diagram 2: Molecular Pathways of Thermal-Oxidative Degradation. This diagram outlines the key radical-based reaction steps, including initiation, propagation (with and without oxygen), and termination, leading to chain scission or cross-linking.
Troubleshooting Guide: FAQs for Experimental Challenges
FAQ 1: My enzymatic depolymerization of PET is yielding low monomer quantities. What could be the cause?
Answer: Low yield in PET enzymatic depolymerization is frequently due to substrate crystallinity and inadequate pretreatment [33] [34]. The enzyme's inability to access the polymer chains is a major bottleneck.
- Problem Identification: Highly crystalline PET (common in bottles) has tightly packed polymer chains that resist enzyme binding. Performance is often overestimated when using non-industrial, amorphous PET substrates in experiments [33].
- Solution: Implement a thermal pretreatment step to amorphize the PET. Heating the polymer above its glass transition temperature (Tg) and rapidly cooling it can disrupt its crystalline structure, making it more susceptible to enzymatic attack [35] [34].
- Recommended Protocol:
- Grind PET waste into fine flakes (<1 mm).
- Heat flakes to 70-100°C for 10-30 minutes.
- Rapidly quench in liquid nitrogen or ice water.
- Use the amorphized flakes as substrate for depolymerization with PET-hydrolyzing enzymes (e.g., engineered LCC, IsPETase variants) [33].
FAQ 2: How can I improve the stability and activity of my enzyme in a chemoenzymatic cascade process?
Answer: Reaction incompatibility between chemical and biological steps is a common issue, often caused by residual catalysts, solvents, or extreme pH from the pretreatment [36].
- Problem Identification: Glycolysis catalysts (e.g., metal acetates) or acidic/alkaline conditions used in chemical depolymerization can denature enzymes in subsequent steps [36].
- Solution: Introduce a neutralization and purification step between the chemical and enzymatic stages. Alternatively, explore enzyme engineering to develop more robust variants tolerant to process conditions [36].
- Recommended Protocol (For Glycolysis + Enzymatic Hydrolysis):
- Perform glycolysis on PET with a zinc acetate catalyst and ethylene glycol at 200°C [36].
- Cool the reaction mixture and dilute it with a neutral pH buffer.
- Use liquid-liquid extraction to separate the glycolyzed products from the catalyst.
- Adjust the pH and temperature to the optimum conditions for the specific enzyme (e.g., PETase) before introducing it to the purified stream.
FAQ 3: My polymer substrate is a mixed waste stream. How do I approach depolymerization?
Answer: Mixed plastics, especially those containing non-hydrolysable polymers like PE or PP, require targeted pre-separation or advanced cascade strategies [35] [36].
- Problem Identification: Enzymes are highly specific. A PET hydrolase will not degrade polyolefins, leading to incomplete depolymerization of mixed feeds [34].
- Solution: For polyesters (PET, PLA) blended with other plastics, a chemoenzymatic cascade is promising. For complex mixes, invest in upstream sorting using AI-assisted NIR (Near-Infrared) spectroscopy, which can achieve separation accuracy up to 95% [26].
- Recommended Protocol (For PET/PE Blends):
- Sorting: Use density-based separation (e.g., sink-float in water) to separate PET (denser) from PE (less dense).
- Pretreatment: For the PE fraction, employ a chemical oxidation step (e.g., with a peroxy acid) to introduce oxygen-containing functional groups [36].
- Depolymerization: Subject the sorted PET fraction to enzymatic depolymerization. The oxidized PE can be funneled to a different recycling pathway, such as pyrolysis or further chemoenzymatic cascades [36].
Experimental Protocols for Monomer Recovery
Protocol 1: Standardized Enzymatic Depolymerization of PET
This protocol is optimized for post-consumer PET, based on guidelines for reproducible PET hydrolase research [33].
- Substrate Preparation:
- Obtain clear, post-consumer PET bottles.
- Remove labels and lids, then wash and dry.
- Mechanically grind into flakes and sieve to a size of 0.1-0.5 mm.
- Amorphize by heating at 75°C for 1 hour, then rapidly cool on ice.
- Reaction Setup:
- Prepare a 1 mL reaction mixture in a suitable buffer (e.g., phosphate buffer, pH 8.0).
- Use a substrate loading of 100 g/L of amorphized PET flakes.
- Add the purified PET hydrolase (e.g., LCC ICGC, FAST-PETase) to a final concentration of 1-5 µM.
- Incubation:
- Incubate the reaction at the enzyme's optimal temperature (typically 60-72°C for thermostable variants) with constant agitation (e.g., 200 rpm) for 24-72 hours [33].
- Monomer Recovery:
- Stop the reaction by heating to 95°C for 10 minutes.
- Centrifuge the mixture to separate insoluble solids from the liquid hydrolysate.
- Analyze the liquid phase for monomers (TPA, MHET, EG) using High-Performance Liquid Chromatography (HPLC) or Gas Chromatography-Mass Spectrometry (GC-MS).
Protocol 2: Chemoenzymatic Depolymerization of Polyurethane (PU)
This two-step protocol converts polyether-based PU foam into its diamine monomer [36].
- Chemical Glycolysis Step:
- Charge a reactor with shredded PU foam and a 10-15 fold excess of ethylene glycol.
- Add a catalyst (e.g., diethanolamine or a metal complex) at 1-2 wt%.
- React under a nitrogen atmosphere at 180-200°C for 2-4 hours.
- Cool the mixture. The main product is a carbamate-terminated oligomer.
- Enzymatic Hydrolysis Step:
- Dilute the glycolysis product in a neutral, mild buffer (e.g., 50 mM Tris-HCl, pH 7.5).
- Add a recently discovered urethanase (e.g., enzymes identified from metagenomic screening) [36].
- Incubate at 30-40°C with shaking for 24-48 hours.
- The enzyme hydrolyzes the carbamate bonds, releasing toluene-2,4-diamine (TDA) and polyols.
- Recover TDA via extraction and confirm identity by GC-MS.
Table 1: Comparison of Plastic Recycling Method Yields and Conditions
| Polymer | Recycling Method | Reported Yield | Key Process Conditions |
|---|---|---|---|
| PET | Enzymatic Depolymerization [37] | ~56% (Overall process yield) | Enzyme (e.g., LCC), 72°C, pH 8.0 |
| PET | Chemical Glycolysis [37] | ≥90% | Metal catalyst, Ethylene Glycol, ~200°C |
| PET | Mechanical Recycling [37] | 70-90% | Melt extrusion & reprocessing |
| Polyamide (Nylon) | Chemical Hydrolysis [37] | High (Near-complete) | Strong acid, High Temperature & Pressure |
| Polyurethane (PU) | Chemoenzymatic Cascade [36] | Protocol established | Glycolysis (200°C) + Enzymatic hydrolysis (40°C) |
Table 2: Key Enzymes for Polymer Depolymerization
| Enzyme Class | Target Polymer(s) | Source / Example | Function |
|---|---|---|---|
| PET Hydrolase (Type I) | PET | Leaf-branch compost cutinase (LCC) [33] | Hydrolyzes ester bonds in PET to TPA and EG |
| PET Hydrolase (Type IIb) | PET | IsPETase (Ideonella sakaiensis) [33] | Mesophilic hydrolysis of PET |
| Urethanase | Polyurethane (PU) | Metagenomically-derived enzymes [36] | Hydrolyzes urethane (carbamate) bonds |
| Cutinase (Fungal) | PET, PEF | Fusarium species [33] | Hydrolyzes cutin and synthetic polyesters |
Experimental Workflow Visualization
Experimental Workflow for Monomer Recovery
The Scientist's Toolkit: Research Reagent Solutions
Table 3: Essential Reagents and Materials for Depolymerization Research
| Reagent/Material | Function in Experiment | Example Use Case |
|---|---|---|
| PET Hydrolase (e.g., LCC ICGC) | Primary biocatalyst for PET depolymerization | Hydrolyzing PET bottle flakes into TPA and EG monomers [33]. |
| Urethanase | Biocatalyst for breaking urethane links | Depolymerizing glycolyzed PU foam into diamines and polyols [36]. |
| Ethylene Glycol | Solvent and reagent for glycolysis | Chemical pretreatment of PET or PU in chemoenzymatic cascades [36]. |
| Metal Acetate Catalysts (e.g., Zn(OAc)₂) | Catalyst for chemical depolymerization | Accelerating the glycolysis reaction of PET [36]. |
| Amorphized PET Flakes | Standardized substrate for enzyme screening | Ensuring reproducible assessment of novel PET hydrolases under industry-relevant conditions [33]. |
| m-Chloroperoxybenzoic acid (mCPBA) | Chemical oxidant for pre-treatment | Introducing functional groups into polyolefins (PE, PP) to enable subsequent biocatalytic steps [36]. |
Troubleshooting Guides
Guide: Diagnosing Unexpected Melt Flow Rate (MFR) Changes
Problem: MFR measurements are significantly higher or lower than anticipated after repeated extrusion cycles, indicating potential degradation.
Investigation Procedure:
- Verify Test Conditions: Confirm MFR testing was performed under standard conditions (specified temperature and load, e.g., 190°C/2.16 kg for PE or 230°C/2.16 kg for PP) according to ISO 1133. Inconsistent pre-drying of hygroscopic materials (like PA6 or PLA) can cause volatile-induced bubbles and skewed results [38] [39].
- Determine Dominant Mechanism:
- MFR Increased: Suggests chain scission is dominant. This is common for polymers like PP [40] and PLA [38]. Confirm via Gel Permeation Chromatography (GPC) showing reduced molecular weight (Mw) [41] [38].
- MFR Decreased: Suggests cross-linking or long-chain branching (LCB) is dominant. This occurs in PE under oxidative conditions [11] [40]. Use rheology to identify increased complex viscosity and elasticity (e.g., via Van Gurp-Palmen plots) [11].
- Check for Oxidation:
- Perform Fourier-Transform Infrared (FTIR) spectroscopy. Look for new carbonyl (C=O) absorption peaks around 1700-1750 cm⁻¹, indicating thermal-oxidative degradation [40].
- Review processing parameters: Were extruder vents open to air? Was a nitrogen purge used? Oxygen availability significantly influences degradation pathways [11].
Resolution Actions:
- For Chain Scission: Incorporate primary (e.g., phenolic) and secondary (e.g., phosphite) antioxidants to inhibit radical-induced scission during processing.
- For Cross-linking: Ensure robust stabilization with primary antioxidants to prevent radical formation. Process under nitrogen inert gas purge if possible [11].
- Optimize Processing: Reduce extrusion temperature and screw speed to minimize thermal and shear stress [3].
Guide: Addressing Loss of Mechanical Properties
Problem: Recycled material exhibits excessive brittleness (reduced impact strength) or a sharp drop in elongation at break.
Investigation Procedure:
- Characterize Mechanical Failure:
- Analyze Thermal Properties: Use Differential Scanning Calorimetry (DSC) to measure crystallinity changes. For example, PLA crystallinity can increase from 6.9% to 39.5% after six cycles, explaining increased brittleness [38].
- Check for Hydrolysis: For condensation polymers (e.g., PLA, PA, PBS), trace moisture during processing causes hydrolytic chain scission [3]. Verify the material was sufficiently pre-dried (e.g., 4 hours at 80°C for PA66) [39].
Resolution Actions:
- Use impact modifiers or compatibilizers to restore toughness.
- Implement rigorous drying protocols before processing (e.g., vacuum oven drying).
- For PLA, note that while molecular weight decreases, increased crystallinity can paradoxically slow its biodegradation rate [38].
Guide: Managing Polymer Blend Incompatibility During Recycling
Problem: Recycling blended polymers (e.g., PBS/PLA) results in phase separation, poor mechanical performance, and inconsistent melt flow.
Investigation Procedure:
- Analyze Blend Morphology: Use Scanning Electron Microscopy (SEM) on fractured surfaces to check for phase separation. Poor adhesion between distinct phases indicates incompatibility.
- Investigate In-Situ Compatibilization: In some blends like PBS/PLA, mechanical recycling can induce transesterification reactions, forming PBS-co-PLA copolymers that act as compatibilizers [43]. Use NMR spectroscopy to detect these new copolymer structures.
Resolution Actions:
- Add compatibilizers to improve blend homogeneity and mechanical properties.
- Optimize processing conditions (temperature, shear) to promote in-situ compatibilization where chemically feasible [43].
Frequently Asked Questions (FAQs)
Q1: What are the primary chemical degradation mechanisms during multiple extrusion cycles? The main mechanisms are chain scission and cross-linking/long-chain branching (LCB), driven by thermal, thermo-mechanical, and thermal-oxidative stress [3]. The dominant pathway depends on polymer structure and processing environment. Polypropylene (PP) and Polylactic acid (PLA) predominantly undergo chain scission, reducing molecular weight and increasing MFR [38] [40]. Polyethylene (PE) can experience LCB under oxidative conditions, increasing viscosity and complexity [11]. Polyamide (PA) degradation primarily occurs via scission at the N-alkylamide bond [41].
Q2: How does the extrusion environment (e.g., air vs. inert gas) influence degradation? The presence of oxygen drastically alters degradation pathways. Processing in air promotes thermal-oxidative degradation, leading to chain scission and the formation of carbonyl groups. For polyolefins like HDPE, oxygen can also facilitate long-chain branching, increasing melt viscosity and elasticity [11]. Processing under a nitrogen (N₂) inert atmosphere minimizes oxidation, suppressing LCB formation and making chain scission from shear the primary mechanism [11].
Q3: How many times can a polymer typically be mechanically recycled before its properties degrade excessively? The practical limit varies by polymer type and application requirements. Studies often simulate 5-6 cycles. For instance, Poly(butylene succinate) (PBS) can undergo five cycles with only a slight reduction in strength and stiffness, but impact resistance declines [42]. PLA shows significant molecular weight reduction (up to 40%) and crystallinity increase after six cycles [38]. Polyolefins like HDPE can be reprocessed many more times (up to 100 in pristine conditions), but real-world recyclate variability limits this [11].
Q4: What are the key analytical techniques for monitoring polymer degradation? Key techniques and their functions are summarized in the table below.
Table: Essential Analytical Techniques for Monitoring Polymer Degradation
| Technique | Primary Function | Key Indicators of Degradation |
|---|---|---|
| Melt Flow Rate (MFR) | Measures melt viscosity & processability [41] | Increase = Chain scission; Decrease = Cross-linking/LCB [40] |
| Gel Permeation Chromatography (GPC) | Determines molecular weight (Mw) distribution [41] | Reduction in Mw; broadening of distribution [38] |
| Fourier-Transform Infrared (FTIR) Spectroscopy | Identifies new chemical functional groups [40] | Appearance of carbonyl (C=O) groups from oxidation [40] |
| Differential Scanning Calorimetry (DSC) | Measures thermal transitions & crystallinity [42] | Changes in Tm, Tg, Tc; significant increase in crystallinity [38] |
| Rheology | Characterizes viscoelastic properties & structure [11] | Van Gurp-Palmen plots reveal LCB; changes in viscosity curve [11] |
Q5: Can additives mitigate degradation during multiple extrusion cycles? Yes, stabilizers are crucial for mitigating degradation [3]. Primary antioxidants (radical scavengers) and secondary antioxidants (hydroperoxide decomposers) inhibit thermal-oxidative degradation. Other additives like chain extenders can actively repair chain scission in condensation polymers, and compatibilizers are essential for maintaining properties in polymer blends [43].
Table: Documented Property Changes in Polymers After Multiple Extrusion Cycles
| Polymer | Extrusion Cycles | Melt Flow Rate (MFR) Change | Molecular Weight Change | Key Mechanical Property Changes | Citation |
|---|---|---|---|---|---|
| PLA | 6 | Increase (MFI) | 40% reduction | Crystallinity increased from 6.9% to 39.5% | [38] |
| PBS | 5 | Progressive Increase | Partial recovery due to branching | Tensile strength: Slight reduction; Elongation at break: Increased; Impact resistance (at -50°C): Sharp decline | [42] |
| PA6 | 5 | Increase | Reduction (GPC) | - | [41] |
| PA6 & PA66 | 6 | - | - | Flexural strength & Young's modulus: Decreasing trend; Elongation: Increasing trend | [39] |
| HDPE | 5 | - | Mw increase & broader MWD (in air) | - | [11] |
| PP (impact copolymer) | 10 | Increase from 7 to 17 g/10min | - | Tensile modulus: Increased by ~25% | [40] |
Experimental Protocols
Protocol: Simulating Mechanical Recycling via Multiple Extrusion
This protocol outlines a standard method for simulating multiple mechanical recycling loops in a laboratory setting [41] [38].
Workflow Diagram: Multiple Extrusion Recycling Simulation
Materials:
- Virgin polymer granules (e.g., PA6, PLA, HDPE)
- Laboratory twin-screw extruder
- Pelletizer
- Drying oven
- Balance
Step-by-Step Procedure:
- Preparation: Weigh a sufficient quantity of virgin polymer. Pre-dry according to manufacturer specifications (e.g., 2-4 hours at 80°C for polyamides) to prevent hydrolytic degradation [39].
- Initial Extrusion (Cycle 1):
- Set the extruder temperature profile according to the polymer's melting point and thermal stability.
- Set screw speed (e.g., 100 rpm) and feed rate.
- Process the entire batch, collect the extrudate strand.
- Cool the strand in a water bath and pelletize.
- Collect a representative sample for characterization (MFR, GPC, etc.). This is "1st pass" material.
- Subsequent Recycling Cycles (Cycle 2 to N):
- Take the pelleted material from the previous cycle.
- Repeat the drying and extrusion steps under identical processing parameters (temperature, screw speed, residence time).
- Collect a sample after each extrusion cycle for analysis.
- Characterization: Analyze samples from each cycle to track degradation. Key tests include MFR, GPC for molecular weight, DSC for thermal properties, and FTIR for chemical structure [41] [38].
Protocol: Rheological Analysis to Probe Degradation Mechanisms
This protocol uses rheology to distinguish between chain scission and long-chain branching, which is particularly useful for polyolefins like PE and PP [11].
Workflow Diagram: Rheological Degradation Analysis
Materials:
- Rheometer with parallel plate geometry
- Compression molding press
- Polymer samples from each extrusion cycle
Step-by-Step Procedure:
- Sample Preparation: Create uniform disks using compression molding. Ensure samples are bubble-free and have smooth, parallel surfaces.
- Rheometer Setup: Load the sample between pre-heated parallel plates (e.g., 190°C for PE). Trim excess material and ensure good contact.
- Frequency Sweep Test: Perform an oscillatory frequency sweep across a wide angular frequency range (e.g., 0.1 to 100 rad/s) at a constant strain within the linear viscoelastic region.
- Measure the storage modulus (G'), loss modulus (G"), and complex viscosity (η*) as functions of frequency.
- Data Analysis - Van Gurp-Palmen Plot:
- Plot the phase angle (δ) against the magnitude of the complex modulus (|G|) for each recycled sample.
- Interpretation:
- Long-Chain Branching (LCB): Successive recycling cycles in an oxidative environment cause increased curvature in the vGP plot, and the phase angle at low |G| decreases. This indicates more elastic, solid-like behavior [11].
- Chain Scission: The vGP plot shows a flattened curve with minimal change in phase angle, indicating a reduction in molecular weight and the absence of new relaxation mechanisms [11].
The Scientist's Toolkit: Research Reagent Solutions
Table: Essential Research Reagents and Materials for Recycling Studies
| Reagent/Material | Function in Research | Specific Example / Note |
|---|---|---|
| Primary Antioxidant | Radical scavenger; inhibits initiation of oxidation during processing. | Phenolic antioxidants (e.g., Irganox 1010). Crucial for all polymers, especially in early cycles [3]. |
| Secondary Antioxidant | Hydroperoxide decomposer; acts synergistically with primary antioxidants. | Phosphites (e.g., Irgafos 168). Helps prevent molecular weight degradation [3]. |
| Chain Extender | Re-joins severed polymer chains; can restore molecular weight of condensation polymers. | Multi-functional epoxies or oxazolines. Useful for recycled PLA or PET [3]. |
| Compatibilizer | Improves interfacial adhesion in polymer blends; reduces phase separation. | For PBS/PLA blends, in-situ formed copolymers can act as compatibilizers [43]. |
| Stabilizer Masterbatch | Pre-dispersed, high-concentration additive blend for easy incorporation. | Ensures homogeneous distribution of additives during compounding [39]. |
| Inert Gas (N₂) | Creates an oxygen-free processing environment to suppress thermo-oxidative degradation. | Purging the extruder barrel with N₂ favors chain scission over long-chain branching in HDPE [11]. |
In both conventional polymer processing (e.g., extrusion, injection molding) and Additive Manufacturing (AM) via Fused Filament Fabrication (FFF), plastic materials are subjected to heat and mechanical stress, which can induce chemical and physical changes collectively known as degradation. This phenomenon is particularly critical in the context of mechanical recycling, where polymers undergo multiple processing cycles, potentially leading to a cumulative decline in material properties that can affect the performance and reliability of final products [44] [3].
Understanding the specific degradation pathways is essential for researchers and development professionals aiming to incorporate recycled content into new products, especially in high-value sectors like medical device development. This technical support center provides a foundational guide for diagnosing, understanding, and mitigating these issues.
Understanding the Core Degradation Mechanisms
The degradation of polymers during processing is driven by several key mechanisms, which are shared to varying degrees between conventional processing and FFF.
Classification of Degradation Pathways
The table below summarizes the primary degradation mechanisms, their main causes, and typical consequences for the polymer structure [3].
Table 1: Common Polymer Degradation Mechanisms During Processing
| Mechanism | Main Inducing Factor(s) | Primary Structural Consequences |
|---|---|---|
| Thermal Degradation | High temperature | Random chain scission, end-chain β-scission (depolymerization), side-group elimination. |
| Thermo-mechanical Degradation | High temperature + Mechanical shear forces | Chain scission via mechanochemical radical generation. |
| Thermo-oxidative Degradation | High temperature + Oxygen | Chain scission and long-chain branching (LCB) via peroxide radical formation. |
| Hydrolysis | Moisture + Temperature | Chain scission, especially prevalent in polyesters (e.g., PLA). |
Comparative Degradation Pathways: FFF vs. Conventional Processing
FFF can be considered a form of extrusion, but its specific conditions, such as the use of filament and layer-by-layer deposition, create a unique degradation profile.
Table 2: Comparison of Degradation in Conventional Processing and FFF
| Aspect | Conventional Processing (e.g., Extrusion) | Fused Filament Fabrication (FFF) |
|---|---|---|
| Typical Thermal History | Single, relatively short, high-shear exposure. | Multiple heating cycles: during filament production and then again during 3D printing [3]. |
| Shear Profile | High shear rates (up to 10⁵ s⁻¹) in extruder [11]. | Generally lower shear in the nozzle, but dependent on nozzle diameter and print speed. |
| Oxygen Exposure | Limited by process design; can be controlled with inert atmospheres [11]. | Potentially greater exposure to ambient air during the printing process. |
| Impact on Recycled Polymers | Well-studied for many polymers; chain scission and branching can be simulated rheologically [11]. | Recycling can be distributed (e.g., using Recyclebots); degradation from multiple processes accumulates, affecting mechanical properties like tensile strength [44]. |
Frequently Asked Questions (FAQs) on Degradation
Q1: Why is understanding degradation particularly important for recycled polymers in FFF? Recycled polymers have already undergone one or more processing histories, making them more susceptible to further degradation. In FFF, the polymer is processed at least twice (once to make filament, once to print), which can lead to cumulative damage like reduced molecular weight, manifested as lower tensile strength and impact resistance in final parts [44] [3]. Controlling this is essential for producing functional components from recyclate.
Q2: How does the dominant degradation mechanism affect the final material properties? The type of degradation dictates the property change. Chain scission, dominant in inert environments or for certain polymers like polyesters, reduces molecular weight, leading to a decrease in melt viscosity and mechanical strength. Conversely, long-chain branching (LCB), promoted by thermo-oxidative conditions in polymers like polyethylene, can increase viscosity and elasticity, making processing more difficult and potentially leading to defects like warping [11].
Q3: What is a key experimental method to simulate and study extrusion-related degradation without large-scale equipment? Rheology is a powerful tool. By applying oscillatory shear to a polymer melt in a controlled gaseous environment (e.g., air vs. N₂) for an extended period, researchers can simulate the structural changes occurring during mechanical recycling. The evolution of complex viscosity and Van Gurp-Palmen plots can distinguish between chain scission and long-chain branching mechanisms [11].
Q4: My 3D printed parts from recycled PLA are weaker than those from virgin material. What is the likely cause? This is a classic sign of thermo-mechanical and/or hydrolytic degradation leading to chain scission. Each processing cycle—during recycling into filament and subsequent FFF—subjects the PLA to heat and shear, shortening the polymer chains. Moisture absorbed by the PLA can also cause hydrolysis during heating. This cumulative damage reduces the average molecular weight, directly impacting mechanical strength [44] [3].
Troubleshooting Common FFF Issues Linked to Degradation
Many common FFF printing failures can be directly or indirectly linked to material degradation, especially when using recycled or reprocessed polymers.
Print Quality Issues
Table 3: Troubleshooting Print Quality Issues Related to Degradation
| Problem & Symptom | Potential Link to Degradation | Corrective Actions |
|---|---|---|
| Under-Extrusion & Weak Infill [45] [46] | Degradation can alter melt viscosity. Polymer may have degraded, leading to inconsistent flow. | - Check for partial nozzle clog (itself caused by degraded material) [45].- Increase extruder temperature slightly to compensate for viscosity changes.- Measure filament diameter; inconsistent diameter can be a result of poor extrusion of degraded material. |
| Layer Adhesion & Cracks in Tall Objects [45] | Reduced molecular weight from chain scission compromises inter-layer diffusion and welding. | - Increase extruder temperature by 10°C to improve polymer diffusion between layers [45].- Enclose the printer to reduce cooling drafts and allow slower, more complete layer bonding.- Ensure filament is dry to prevent hydrolytic degradation during printing. |
| Warping & Corner Lifting [46] | Degradation can change crystallization behavior and internal stresses, particularly in semi-crystalline polymers. | - Use adhesives (e.g., glue stick, hairspray) on the build plate to improve adhesion [46].- Increase bed temperature within a recommended range to control cooling stress.- Use a brim or raft to increase the part's adhesion surface area. |
| Stringing / Hairy Prints [46] | Degradation can affect the melt's viscoelasticity and its response to retraction settings. | - Optimize retraction settings (distance and speed) to account for potential changes in melt viscosity [46].- Ensure filament is dry; moisture can contribute to both degradation and oozing. |
Material and Hardware Issues
Table 4: Troubleshooting Material and Hardware Issues
| Problem & Symptom | Potential Link to Degradation | Corrective Actions |
|---|---|---|
| Jammed Nozzle / Clogged Extruder [45] | Thermal degradation can cause carbonization or cross-linking of polymer inside the nozzle, creating a clog. | - Perform a "cold pull" to clean the nozzle.- Use a small needle or an airbrush cleaning kit to clear the nozzle orifice while heated [45].- Dismantle and inspect the hot end for stubborn residues. |
| Discoloration / Scorching | Thermal-oxidative degradation has occurred, burning the polymer. This is often visible as a darkening or yellowing [45]. | - Lower the extruder temperature to the lower end of the filament's recommended range.- Check that the thermistor is accurately reading the temperature.- Clean the nozzle to remove any burnt material that could seed further degradation. |
Essential Experimental Protocols for Degradation Analysis
Rheological Simulation of Mechanical Recycling
This protocol allows for the rapid assessment of a polymer's susceptibility to degradation under different conditions, mimicking multiple extrusion passes [11].
Objective: To simulate the structural evolution of a polymer (e.g., HDPE, PLA) during repeated processing cycles using a rheometer.
Materials and Equipment:
- Controlled-stress or strain-controlled rheometer with parallel plate or cone-and-plate geometry.
- Polymer sample (virgin or recyclate) in pellet or pre-molded disk form.
- Inert and oxidative gas sources (e.g., N₂ and compressed air).
Methodology:
- Sample Loading: Place the polymer sample between the pre-heated rheometer plates and allow it to melt to achieve a consistent seal.
- Environmental Control: Set the environmental control of the rheometer to the desired gas (N₂ for inert, air for oxidative conditions).
- Simulated Recycling: Program the rheometer to run consecutive frequency sweeps (e.g., from 100 to 0.1 rad/s) at a constant temperature representative of processing (e.g., 180-220°C) over a period of several hours.
- Data Collection: Record the evolution of viscoelastic properties (complex viscosity η*, storage modulus G', loss modulus G") after each frequency sweep.
Data Analysis:
- Plot the complex viscosity at a specific frequency (e.g., 10 rad/s) versus the number of sweeps to quantify degradation rate.
- Use Van Gurp-Palmen plots (phase angle δ vs. complex modulus |G|) to identify the onset of long-chain branching (increased curvature, lower δ at low |G|) or chain scission (flattening of the curve) [11].
Methodology for Evaluating Recyclability in FFF
This methodology provides a framework for quantifying the impact of multiple closed-loop recycling cycles on a polymer's properties for FFF application [44].
Objective: To characterize the physico-chemical and mechanical degradation of a polymer (e.g., PLA) through multiple cycles of grinding, re-extrusion into filament, and FFF printing.
Materials and Equipment:
- Virgin polymer (e.g., PLA filament).
- Filament extruder (commercial or open-source like a Recyclebot).
- FFF 3D printer.
- Grinder or crusher.
- Tensile testing machine.
- Melt Flow Index (MFI) tester or rheometer.
Methodology:
- Baseline Characterization: Test virgin filament for mechanical properties (tensile strength, modulus) and MFI.
- Process Chain Definition: Define the recycling process chain (e.g., Printing → Grinding → Extrusion → Filament). A "Feedstock" chain may skip the printing step.
- Cycling: Subject the material to multiple passes through the defined process chain.
- Analysis: After each cycle, characterize the material:
- Mechanical: Print and test standardized tensile bars (e.g., ISO 527).
- Rheological: Measure MFI or perform full rheology.
- Chemical: Use FTIR or GPC to track molecular weight and formation of oxidative groups.
Key Analysis: Compare the tensile properties and melt flow behavior of the recycled material against the virgin baseline to determine the degradation trajectory [44].
The Scientist's Toolkit: Key Research Reagents and Materials
Table 5: Essential Materials and Equipment for Polymer Degradation Research
| Item | Function / Application in Research |
|---|---|
| Rheometer | The core instrument for simulating processing degradation and characterizing changes in melt viscosity and viscoelasticity without large-scale extrusion [11]. |
| Controlled Atmosphere (N₂, O₂) | Gas cylinders to create inert or oxidative environments in rheometers or extruders, allowing isolation of thermo-mechanical vs. thermo-oxidative degradation pathways [11]. |
| Stabilizers / Antioxidants | Additives (e.g., hindered phenols, phosphites) that can be compounded into the polymer to scavenge free radicals and inhibit thermo-oxidative degradation during processing, extending material life [3]. |
| Filament Extruder | Device to produce consistent filament from virgin or recycled polymer pellets. Open-source "Recyclebots" enable distributed recycling and compounding [44]. |
| Gel Permeation Chromatography (GPC) | Analytical technique for measuring the molecular weight distribution of polymers. Critical for quantifying chain scission (decrease in Mw) during degradation [3]. |
| Fourier-Transform Infrared (FTIR) Spectroscopy | Used to detect the formation of specific chemical groups (e.g., carbonyls, hydroxyls) that are indicative of oxidative degradation [3]. |
Frequently Asked Questions (FAQs)
FAQ 1: What are the most significant recent breakthroughs in enzyme engineering for PET depolymerization? Recent breakthroughs focus on improving enzyme efficiency and industrial viability. Key advances include engineering the Fast-PETase variant for enhanced thermostability and activity [47], and developing integrated process innovations that drastically reduce energy use and chemical requirements, making enzymatic recycling cost-competitive with virgin PET production [48]. Furthermore, engineered cutinases are now being used for the selective hydrolysis of aliphatic-aromatic copolyesters, enabling precise polymer analysis [49].
FAQ 2: Why does the crystallinity of my PET substrate hinder enzymatic degradation, and how can I overcome this? Enzymatic degradation is a surface erosion process where enzymes primarily attack the amorphous regions of a polymer [50]. The dense, ordered structure of crystalline regions prevents enzymes from accessing the polymer chains [51]. To overcome this:
- Apply Pre-treatment: Use physical methods like milling or grinding to increase the surface area and reduce the polymer's crystallinity [52] [50].
- Use Amorphous Substrates: Whenever possible, use amorphous PET films, which are significantly more susceptible to enzymatic attack than their crystalline counterparts [47].
FAQ 3: I am experiencing low degradation yields. What are the key factors I should optimize? Low yields can be attributed to several factors related to the enzyme, substrate, and reaction conditions. The table below summarizes the key parameters to troubleshoot.
Table 1: Troubleshooting Guide for Low Degradation Yields
| Category | Factor | Optimal Range / Characteristics | Recommendation |
|---|---|---|---|
| Reaction Conditions | Temperature | Near the polymer's glass transition temperature (Tg) but below enzyme denaturation point (e.g., 50-72°C for many PETases) [52] | Perform activity assays at different temperatures to find the optimum for your enzyme. |
| pH | Enzyme-specific, often pH 7-9 for PET hydrolases [52] | Use a buffered system to maintain pH, as acid production from TPA can inhibit the reaction. | |
| Enzyme | Thermostability | High stability at operating temperature (e.g., >65°C) [52] | Use engineered thermostable variants (e.g., Fast-PETase) [47]. |
| Specific Activity | High turnover number for the target polymer. | Select enzymes known for your polymer (e.g., FsCut for PBAT, PBS, PCL) [50]. | |
| Substrate | Crystallinity | Low crystallinity is preferred [47]. | Implement a pre-treatment step (milling, heat) to amorphize the polymer [52]. |
| Surface Area | High surface-to-volume ratio [50]. | Grind polymer into fine powders or use thin films to maximize enzyme accessibility. |
FAQ 4: What analytical techniques are most sensitive for detecting early-stage polymer degradation? Conventional techniques like weight loss or SEM only detect extensive degradation. For early-stage analysis, highly sensitive techniques are required, as summarized in the table below.
Table 2: Sensitive Analytical Techniques for Detecting Polymer Degradation
| Technique | What It Measures | Detection Threshold (Estimated) | Measurement Time | Key Advantage |
|---|---|---|---|---|
| Quartz Crystal Microbalance (QCM) | Mass changes on a surface | ~0.1-1 chain scissions/nm² [53] | Minutes to Hours | Real-time, label-free monitoring of surface erosion. |
| Time-of-Flight Secondary Ion Mass Spectrometry (ToF-SIMS) | Surface chemical composition | ~0.1-1 chain scissions/nm² [53] | Hours | High surface sensitivity; provides molecular fingerprint. |
| Automated Spectroscopic Ellipsometry | Film thickness and morphology | ~0.1-1 chain scissions/nm² [53] | Minutes | Rapid, non-contact measurement of nanoscale thickness loss. |
| Liquid Chromatography-Mass Spectrometry (LC-MS) | Soluble degradation products | Picomole to nanomole levels [49] | Hours | Identifies and quantifies specific monomers and oligomers. |
| X-ray Photoelectron Spectroscopy (XPS) | Surface elemental composition | ~1% of a monolayer [53] | Hours | Detects changes in surface chemistry due to hydrolysis. |
Experimental Protocols
Protocol: Enzymatic Degradation of an Amorphous PET Film
This protocol is adapted from a study investigating the structural decay of PET during enzymatic degradation [47].
1. Research Reagent Solutions
- PETase Enzyme: Recombinantly expressed and purified Fast-PETase (or another PET hydrolase) in a suitable buffer (e.g., PBS).
- Substrate: Amorphous PET film. Prepared by melt-quenching PET pellets at 300°C and rapidly cooling to room temperature [47].
- Reaction Buffer: 100 mM HEPES-NaOH, pH 8.0.
- Equipment: Thermostatic air incubator or water bath, microtubes, standard protein purification equipment (for enzyme preparation).
2. Methodology
- Step 1: Enzyme Purification. Express the His-tagged Fast-PETase in E. coli and purify using Immobilized Metal Affinity Chromatography (IMAC). Use a Ni-Sepharose column, wash with PBS containing 20 mM imidazole, and elute with PBS containing 300 mM imidazole. Desalt into PBS without imidazole using a size-exclusion column [47].
- Step 2: Substrate Preparation. Evenly cut the amorphous PET film into small pieces (e.g., 8 fan-shaped pieces from a round film) to increase the surface area and ensure consistent exposure to the enzyme solution.
- Step 3: Degradation Reaction.
- Reconstitute the purified Fast-PETase in the HEPES reaction buffer to a final concentration of 500 nM.
- Immerse the PET film pieces in the reaction buffer in a 1.5 mL microtube.
- Incubate the reaction at 50°C in an air-phase incubator without agitation for the desired duration (e.g., from hours to several days) [47].
- Step 4: Analysis.
- Quantification: Analyze the reaction buffer by HPLC to quantify soluble degradation products like terephthalic acid (TPA) and mono(2-hydroxyethyl) terephthalic acid (MHET) [52].
- Structural Analysis: Analyze the solid PET film using techniques like Wide-Angle X-Ray Diffraction (WAXD) and Scanning Electron Microscopy (SEM) to observe structural decay and surface erosion [47].
Diagram 1: PET degradation experimental workflow.
Protocol: Screening Enzyme Activity on Various Biodegradable Polyesters
This protocol is based on a study that screened esterase, arylesterase, and cutinase activities on multiple commercial biodegradable polymers [50].
1. Research Reagent Solutions
- Enzymes: Fusarium solani cutinase (FsCut), Alcanivorax borkumensis esterase (AbEst), Pseudomonas pseudoalcaligenes arylesterase (PsEst).
- Polymers: PBAT, PBS, PCL, PHB, PHBV, PLA.
- Equipment: Commercial blender with titanium blades (for grinding), sieve shaker, HPLC system with appropriate columns, incubator.
2. Methodology
- Step 1: Polymer Pre-treatment.
- Grind plastic pellets into a powder using a commercial blender. Use repeated crushing cycles (e.g., 3 minutes on, 5 minutes off) with dry ice to prevent melting and recrystallization.
- Sieve the powder into specific size fractions (e.g., 100, 250, 500 μm) using an electromagnetic sieve shaker. Use the sieved powder immediately or store dry and dark [50].
- Step 2: Enzymatic Degradation Assay.
- Incubate the grinded polymer powder with the selected enzyme in a suitable buffer at its optimal pH and temperature for 7 days.
- For FsCut, which showed high activity on PBAT, PBS, and PCL, typical reactions can be performed at 40-50°C [50].
- Step 3: Product Identification and Quantification.
- After incubation, analyze the supernatant using HPLC and LC-HRMS to identify and quantify the released monomers and oligomers [50].
The Scientist's Toolkit: Research Reagent Solutions
Table 3: Essential Reagents and Materials for Depolymerization Research
| Item | Function / Role | Example(s) / Specifications |
|---|---|---|
| PET-Hydrolyzing Enzymes | Catalyze the hydrolysis of ester bonds in PET and other polyesters. | Fast-PETase (engineered variant for thermostability) [47], Cutinases from F. solani (FsCut) or T. fusca [51] [50]. |
| Cutinase (Engineered) | Selective hydrolysis of specific bonds in copolyesters for analytical purposes. | Engineered cutinase for characterizing aliphatic-aromatic homo- and co-polyesters [49]. |
| Amorphous PET Film | Model substrate with low crystallinity, enabling high degradation rates. | Prepared by melt-quenching PET pellets at 300°C and rapid cooling [47]. |
| Grinded Polymer Powder | Increases surface area and reduces crystallinity, enhancing enzyme accessibility. | Powder sieved to specific fractions (e.g., <100 μm) [50]. |
| HEPES Buffer (pH 8.0) | Maintains optimal pH for many PET hydrolases during reactions. | 100 mM concentration is commonly used [47]. |
| LC-HRMS System | Identifies and quantifies degradation products (monomers, oligomers). | Critical for understanding degradation pathways and efficiency [49] [50]. |
Diagram 2: Enzymatic depolymerization mechanism.
Strategies for Mitigating Degradation and Enhancing Recyclate Quality
FAQs: Stabilizers and Polymer Degradation
1. Why do recycled plastics require stabilizer systems, unlike virgin polymers?
Recycled plastics undergo additional thermal and mechanical stress during reprocessing (e.g., in extruders), which accelerates degradation. Each heat cycle can cause chain scission, where long polymer chains break down into shorter, more reactive fragments. This leads to a loss of mechanical properties like tensile strength and elongation, as well as discoloration. Stabilizer systems are essential to mitigate this degradation and maintain the material's performance [54] [55].
2. What is the fundamental difference between primary and secondary antioxidants?
- Primary Antioxidants (e.g., hindered phenols) work by donating a hydrogen atom to stabilize (deactivate) the highly reactive free radicals (shorter chain segments) that initiate chain scission, thereby stopping the degradation chain reaction [54].
- Secondary Antioxidants (e.g., phosphite esters or thioesters) are considered preventative. They function by decomposing hydroperoxides, which are unstable intermediates in the degradation process, into more stable, non-radical products. This prevents the formation of new free radicals [54]. Used together, they provide a synergistic stabilization effect.
3. Can additives improve the compatibility of mixed plastic waste?
Yes. When recycling mixed plastics like polyethylene (PE) and polypropylene (PP), the immiscibility of the different polymers often leads to poor mechanical properties. Compatibilizers act as bonding agents between the incompatible phases. They improve the blend's miscibility, which enhances critical properties like Stress Crack Resistance (SCR) and elongation at break [56].
4. How do I select the right additive package for my recycled polymer?
The choice depends on the polymer type and the primary challenge you aim to solve. The table below summarizes recommended solutions for common recycled polymers based on industry guidance [55].
Table: Additive Selection Guide for Common Recycled Polymers
| Polymer | Typical Challenges | Recommended Additive Solutions | Function |
|---|---|---|---|
| Recycled Polypropylene (PP) | Heat degradation, gas fading, color instability | ULTRANOX 626, ANOX IC-14 | Provides melt stability, gas fade resistance, and excellent color stability. |
| Recycled HDPE | Heat stabilization, gas-fading, plate-out | ULTRANOX 626, ANOX 20, LOWINOX 1790 | Enhances heat stability, prevents gas fading, and reduces plate-out on equipment. |
| Recycled Polyamide (Nylon PA6/PA66) | Heat stability, impact resistance, weathering | LOWINOX HD98, NAUGARD 445 | Improves heat stability, color retention, and weathering resistance. |
| Recycled PET | Molecular weight retention, color stability | ULTRANOX 626, WESTON 705T | Maintains molecular weight during processing and ensures color control. |
| PE/PP Blends | Poor compatibility, low stress crack resistance | Compatibilizers (e.g., ROYALTUF, POLYBOND) | Improves miscibility between polymer phases, enhancing mechanical properties [56]. |
Troubleshooting Guide: Common Issues in Recyclate Reprocessing
Problem: Thermal Degradation and Discoloration
- Symptoms: Yellowing or browning of the polymer, unpleasant odor, reduced viscosity, and gels or black specks.
- Root Cause: Exposure to high temperatures and shear during extrusion causes oxidative degradation and chain scission.
- Solution:
- Increase Primary Antioxidant: Boost the level of a hindered phenol antioxidant to better scavenge free radicals.
- Incorporate a Secondary Antioxidant: Add a phosphite (e.g., ULTRANOX 626) to decompose hydroperoxides [55].
- Optimize Processing: Lower processing temperatures and screw speeds to reduce shear-induced degradation [56].
Problem: Poor Mechanical Properties in Blends
- Symptoms: Low impact strength, brittleness, and poor stress crack resistance.
- Root Cause: Incompatibility between different polymer phases (e.g., PE and PP) in the recycled stream.
- Solution:
- Add a Compatibilizer: Introduce a compatibilizing agent (e.g., 3% by weight) to act as an interfacial bridge between the immiscible phases. Studies show this directly improves Stress Crack Resistance (SCR) [56].
- Consider an Impact Modifier: For applications requiring high toughness, use impact modifiers to enhance elongation at break and impact strength.
Problem: Color Instability and Gas Fading
- Symptoms: Color change after processing or over time, especially in non-black plastics.
- Root Cause: The antioxidant itself can form colored oxidation products when exposed to nitrogen oxides in the atmosphere.
- Solution:
- Use Gas-Fade Resistant Antioxidants: Switch to specialized antioxidants like ULTRANOX 626 or LOWINOX 1790, which are designed to resist gas fading [55].
- Employ Carbon Black: For applications where color is not critical, adding 2-4% carbon black masterbatch acts as a highly effective UV stabilizer and provides a consistent black color [56].
Experimental Protocols: Validating Additive Performance
Protocol 1: Evaluating Thermal Stability via Oxidative Induction Time (OIT)
Objective: To determine the effectiveness of antioxidants in delaying the thermal oxidation of recycled polymer blends.
Materials:
- Recycled polymer blend (e.g., rHDPE/rHMWPE)
- Tested additives: Antioxidant masterbatch, Carbon Black (CB) masterbatch
- Differential Scanning Calorimeter (DSC)
- Oxygen gas supply
Methodology:
- Sample Preparation: Prepare blends with varying additive concentrations using a twin-screw extruder. For example, as per the experimental design in [56], prepare samples with 0%, 0.5%, and 0.7% antioxidant, and with/without 4% carbon black.
- DSC Analysis:
- Place a small sample (5-10 mg) into a DSC pan.
- Heat the sample at a constant rate (e.g., 20°C/min) under a nitrogen atmosphere to a specified isothermal temperature (e.g., 200°C for PE).
- Once equilibrated, switch the purge gas from nitrogen to oxygen.
- The OIT is the time interval (in minutes) from the introduction of oxygen to the onset of oxidative degradation, marked by a sharp exothermic peak on the DSC curve.
- Data Interpretation: Longer OIT values indicate better thermal stability. The data will show that adding antioxidants and carbon black significantly delays oxidation [56].
Protocol 2: Measuring Stress Crack Resistance (SCR)
Objective: To assess the improvement in mechanical durability provided by compatibilizers in recycled polyolefin blends.
Materials:
- Compression-molded plaques of recycled PE blends
- Notched Crack Ligament Stress (NCLS) test apparatus
- Compatibilizer (e.g., a propylene-ethylene copolymer)
Methodology:
- Sample Preparation: Manufacture test specimens from a reference blend and blends containing a compatibilizer (e.g., 3% by weight) [56].
- Notching: Introduce a controlled notch into the specimens to create a stress concentration point.
- Testing: Subject the notched specimens to a constant tensile load in a controlled environment. The NCLS test measures the stress required to cause the notch to open and form a crack.
- Data Interpretation: A higher stress value at failure indicates superior resistance to stress cracking. Research confirms that the addition of a compatibilizer directly improves the NCLS and UCLS (Un-notched) values of recycled PE blends, whereas antioxidants and carbon black alone do not [56].
Research Workflow and Additive Mechanisms
The Scientist's Toolkit: Key Research Reagents
Table: Essential Materials for Polymer Reprocessing Research
| Reagent / Material | Function / Rationale | Example Applications |
|---|---|---|
| Hindered Phenol Antioxidants | Primary antioxidants that donate hydrogen atoms to neutralize free radicals, halting the chain scission process. | Essential for all polyolefins, especially heat-sensitive polymers like PP. ANOX 20 for HDPE [55]. |
| Phosphite Antioxidants | Secondary antioxidants that decompose hydroperoxides, preventing the formation of new free radicals. Synergistic with primary AOs. | ULTRANOX 626 for melt stability and gas fade resistance in PP and HDPE [55]. |
| Compatibilizers | Improve interfacial adhesion between immiscible polymer phases in blends, enhancing mechanical properties like impact strength and SCR. | ROYALTUF or POLYBOND for PE/PP blends or filled systems [55] [56]. |
| Carbon Black Masterbatch | Provides protection against ultraviolet (UV) light and can delay thermal oxidation. Also masks color inconsistencies. | Added at 2-4% to protect pipes and outdoor products from UV degradation [56]. |
| Twin-Screw Extruder | Standard laboratory equipment for melting, mixing, and compounding polymer blends with additives under controlled shear and temperature. | Used to prepare homogeneous test samples for OIT and SCR testing [56]. |
| Differential Scanning Calorimeter (DSC) | Analytical instrument used to measure the Oxidative Induction Time (OIT), a key metric for quantifying thermal stability. | Validates the effectiveness of antioxidant packages in recycled resins [56]. |
Troubleshooting Guide: Common Issues in Polymer Reprocessing
Problem: Excessive Molecular Weight Reduction After Extrusion
- Observed Symptom: A significant drop in the weight-average molecular weight (M̄W) of the polymer, leading to poor mechanical properties like reduced tensile strength and brittleness [57] [58].
- Primary Causes:
- Excessively high melt temperature causing thermal chain scission [57] [3].
- Screw speed set too high, leading to excessive thermo-mechanical shear degradation [57] [9].
- Residence time in the extruder is too long, allowing cumulative degradation [57].
- Insufficient stabilization against thermal-oxidative degradation [3].
- Solutions:
- Reduce the barrel temperature profile to the minimum required for homogeneous melting [57].
- Lower the screw speed to decrease shear-induced degradation [57].
- Increase the throughput rate, if possible, to shorten the material's residence time [57].
- Ensure the use of appropriate antioxidants and processing stabilizers [3].
Problem: Inconsistent Melt Flow Rate (MFR) Between Batches
- Observed Symptom: High variability in MFR measurements of the reprocessed material, indicating unstable degradation levels [57].
- Primary Causes:
- Solutions:
Problem: Discoloration (Yellowing) and Odor
- Observed Symptom: The reprocessed polymer exhibits a yellow hue and/or an unpleasant smell [57] [3].
- Primary Causes:
- Solutions:
Frequently Asked Questions (FAQs)
Q1: What is the most critical parameter to control for minimizing polypropylene (PP) degradation during twin-screw extrusion? There is no single most critical parameter; degradation is a synergistic result of thermal, mechanical, and oxidative stresses. However, melt temperature is a fundamental factor as it directly accelerates the rate of all thermally-activated degradation reactions, including chain scission [57] [3] [9]. Controlling temperature, in conjunction with managing screw speed (shear) and excluding oxygen, is essential for minimizing molecular weight reduction [57].
Q2: How does screw speed specifically influence mechanical degradation? Increasing the screw speed raises the weighted average shear rate inside the extruder. This has two main effects:
- It increases the mechanical shear stress, which can directly break polymer chains via a mechanochemical mechanism [9].
- It increases viscous dissipation, which in turn raises the melt temperature, indirectly promoting thermal degradation [57] [9]. The net effect is often greater degradation at higher screw speeds, although the relationship can be complex and depends on the specific screw configuration (e.g., more intensive degradation occurs in kneading blocks compared to conveying elements) [57].
Q3: Why is oxygen exclusion so important, even at relatively low concentrations? Oxygen acts as a potent propagator in the radical chain reactions that define degradation. Even small amounts of solubilized oxygen can lead to thermal-oxidative degradation [3] [9]. This pathway can generate multiple chain scission events from a single radical initiation, significantly amplifying the reduction in molecular weight compared to purely thermal degradation in an inert atmosphere [3]. Therefore, effective oxygen exclusion is crucial for suppressing this autocatalytic degradation cycle.
Q4: How can I quantitatively predict the extent of degradation for my process parameters? A mathematical model has been developed for polypropylene that predicts the change in weight-average molecular weight based on key process variables. The model equation is [57]: M̄W / M̄W,0 = 1 / exp( T/T₀ • ( 1 + ( γ̇w/γ̇₀ )² ) • Δtv/tv,0 ) Where:
- M̄W and M̄W,0 are the final and initial molecular weights.
- T is the melt temperature.
- γ̇w is the weighted average shear rate.
- Δtv is the residence time.
- T₀, γ̇₀, tv,0 are material- and equipment-specific sensitivity parameters.
Quantitative Data on Process Parameter Effects
The following table summarizes the general influence of key process parameters on the degradation of polypropylene during twin-screw extrusion, as established in research [57].
Table 1: Effect of Extrusion Parameters on Polypropylene Degradation
| Process Parameter | Direction of Change | Effect on Molecular Weight | Primary Degradation Mechanism |
|---|---|---|---|
| Barrel Temperature | Increase | Decrease | Thermal, Thermal-Oxidative [57] [3] |
| Screw Speed | Increase | Decrease | Thermo-Mechanical [57] [9] |
| Throughput | Increase | Increase (less degradation) | Reduced Residence Time [57] |
| Oxygen Presence | Increase | Decrease | Thermal-Oxidative [3] [9] |
Table 2: Model Sensitivity Parameters for Different Extruder Sizes (PP) [57] These parameters are used in the predictive degradation model and highlight the need for equipment-specific calibration.
| Screw Diameter | T₀ [°C] | γ̇₀ [s⁻¹] | tv,0 [s] |
|---|---|---|---|
| 25 mm | 23,278.54 | 741.84 | 8.75 |
| 28 mm | 23,823.97 | 1219.07 | 11.29 |
| 45 mm | 931.81 | 16,809.61 | - |
Experimental Protocol: Quantifying Extrusion-Induced Degradation
Objective: To determine the degree of polymer degradation induced by a specific set of extrusion parameters by measuring the change in molecular weight and melt flow rate.
Materials and Equipment:
- Virgin polymer (e.g., Polypropylene)
- Co-rotating twin-screw extruder
- Gravimetric feeder
- Nitrogen gas purging system
- Granulator
- Gel Permeation Chromatography (GPC) system
- Melt Flow Rate (MFR) tester
Procedure:
- Baseline Characterization: Determine the initial weight-average molecular weight (M̄W,0) of the virgin polymer using GPC and the initial MFR (MFR₀) according to ASTM D1238 (e.g., 230°C/2.16 kg for PP) [57].
- Process Setup: Configure the extruder with a standard screw profile. Set the desired temperature profile, screw speed, and throughput. Activate the nitrogen purge on the feed throat and vents.
- Processing: Process the virgin polymer through the extruder. Ensure steady-state conditions are reached before collecting sample.
- Sample Collection: Collect the extrudate, allow it to cool, and pelletize it using the granulator.
- Post-Processing Characterization: Determine the final molecular weight (M̄W) of the pelletized material using GPC. Also, measure the final MFR (MFR).
- Data Analysis: Calculate the relative change in molecular weight (M̄W / M̄W,0). The MFR can be related to molecular weight using empirical relationships; for PP, one adapted model is: M̄W = 1.8095 • 10²¹ • MFR⁻¹³.⁶⁵³ [57].
Degradation Pathways and Experimental Workflow
Polymer Degradation Pathways
Experimental Workflow for Parameter Optimization
The Scientist's Toolkit: Research Reagent Solutions
Table 3: Essential Materials for Polymer Reprocessing Research
| Item | Function / Relevance to Research |
|---|---|
| Nitrogen Gas Supply | Creates an inert atmosphere within the extruder to suppress thermal-oxidative degradation pathways [3] [9]. |
| Polymer Stabilizers | Additives (e.g., antioxidants, phosphites) that scavenge free radicals or decompose hydroperoxides, slowing down the degradation process during processing [3]. |
| Titanium Dioxide (TiO₂) | A common filler used in studies to investigate how different additives and thermodynamic properties influence the degradation behavior of compounds [57]. |
| Solvents for GPC | High-purity tetrahydrofuran (THF) or other suitable solvents are required for dissolving polymer samples and conducting Gel Permeation Chromatography to determine molecular weight distributions [57] [3]. |
| Melt Flow Rate Tester | Standard equipment for a rapid, indirect assessment of molecular weight changes via melt viscosity measurements, following standards like ASTM D1238 [57]. |
In polymer recycling research, predicting the lifetime of materials is crucial for developing efficient reprocessing strategies and ensuring the quality of recycled products. Kinetic modeling of chain scission reactions provides the foundational framework for these predictions. These models mathematically describe how polymer chains break down under various environmental stresses, such as heat, moisture, or chemical agents, allowing researchers to extrapolate long-term behavior from short-term experimental data. Accurately selecting and applying the right kinetic model is therefore not merely an academic exercise but a practical necessity for advancing sustainable polymer management and enabling the circular economy.
Troubleshooting Guides
Guide 1: Resolving Negative Rate Predictions in Kinetic Models
- Problem Description: During simulation, your kinetic model predicts negative reaction rates or polymer chain lengths, which are physically impossible and halt the simulation.
- Root Cause: This typically occurs when using an additive Gaussian error structure in nonlinear models. While mathematically convenient, this assumption does not reflect the physical reality that reaction rates and molecular weights must be non-negative. Variances in experimental data can easily lead the model to predict invalid negative values [59].
- Solution Steps:
- Transform the Model: Instead of the standard form (e.g.,
y = η(θ, x) + ε), use a logarithmic transformation to assume multiplicative log-normal errors [59]. - Implement the Log Model: Reformulate the model as
ln(y) = ln(η(θ, x)) + ln(ε). This ensures that all simulated reaction rates remain non-negative, as the error term becomes multiplicative (η(θ, x) * ε) and is always positive [59]. - Re-fit Parameters: Recalibrate your model parameters using the transformed model structure. This often improves parameter estimation and simulation stability, especially for models with a wide range of substrate concentrations [59].
- Transform the Model: Instead of the standard form (e.g.,
Guide 2: Selecting Between Chain-End and Random Scission Models
- Problem Description: Experimental molecular weight data does not fit the expected degradation model, leading to poor prediction of the lifetime and degradation products.
- Root Cause: The chosen scission model (chain-end or random) may be incorrect for the polymer-solvent system. A common incorrect assumption is that the degradation mechanism is governed solely by the polymer's molecular chemistry [60].
- Solution Steps:
- Analyze Time-Dependent MWD: Collect molecular weight distribution (MWD) data at multiple time points throughout the degradation process.
- Fit to Both Models: Fit the experimental MWD data to both chain-end scission and random scission kinetic models [60] [61].
- Determine the Dominant Mechanism: The model with the best fit indicates the dominant scission mechanism.
- Apply the Solubility Rule: Use the following decision diagram to guide and validate your model selection based on the key finding that polymer solubility is the primary factor determining the scission mode [60].
Guide 3: Diagnosing Model-Experiment Mismatch in Hydrolytic Degradation
- Problem Description: A model that assumes uniform bulk degradation fails to match experimental data, which shows heterogeneous degradation through the material thickness (e.g., a faster-degrading core).
- Root Cause: The phenomenon of autocatalysis is occurring. As esters and other bonds hydrolyze, they generate acidic end groups (e.g., carboxylic acids) that catalyze further hydrolysis. In thick samples, these acidic products cannot diffuse out quickly, accelerating degradation in the material's core [61].
- Solution Steps:
- Shift to a Reaction-Diffusion Framework: Implement a model that couples the hydrolysis reaction kinetics with the diffusion of short-chain oligomers and acidic catalysts [61].
- Incorporate a Discrete Scission Model: Within this framework, use a model that allows you to define different scission probabilities for bonds along the polymer backbone, rather than assuming all bonds are equally likely to break [61].
- Calibrate with Common Data: Calibrate this advanced framework using standard experimental data, such as mass loss and molecular weight reduction profiles over time. A well-constructed model can back-calculate the specific scission mechanism (random, chain-end, or mixed) from this data [61].
Frequently Asked Questions (FAQs)
FAQ 1: What is the most critical factor to consider when choosing a kinetic model for polymer degradation in recycling? The physical state of the polymer, specifically its solubility in the reaction environment, is the most critical factor [60]. Soluble polymers tend to degrade via chain-end scission, while insoluble polymers (a common scenario in the recycling of many plastics in aqueous environments) primarily undergo random scission. This factor can be more decisive than the type of degradable bonds or the polymer's molecular weight [60].
FAQ 2: Why is the random scission model particularly important for recycling studies? The random scission model is vital because it accurately describes the degradation of many solid, insoluble polymers—a common physical form in waste streams. For example, the hydrolysis of polyamide-6 (PA6) in subcritical water, a promising chemical recycling method, is well-described by a random scission model as water penetrates the polymer matrix and breaks chains at random points [62]. This model is essential for predicting the yield of valuable monomers and oligomers during recycling processes.
FAQ 3: My model fits the data well initially but fails to predict long-term behavior. What could be wrong? This is often a sign of a changing degradation mechanism over time. A single-mechanism model might capture the initial phase but fail as the process advances. The degradation mechanism can shift due to factors like the buildup of catalytic degradation products (autocatalysis), changes in crystallinity, or the exhaustion of more reactive bonds [63] [61]. Consider using models that can account for multiple or evolving mechanisms.
FAQ 4: What are the best experimental practices for obtaining reliable kinetic parameters?
- Measure Multiple Properties: Do not rely on a single data type. Collect data on mass loss, molecular weight (Mn, Mw), and molecular weight distribution (MWD) over time [61].
- High Data Density: Especially in the early stages of degradation, frequent sampling helps capture the initial kinetics accurately.
- Use MWD for Mechanism Identification: The evolution of the full molecular weight distribution is the most powerful dataset for distinguishing between random and chain-end scission mechanisms [60] [61].
Data Presentation
Table 1: Characteristics of Primary Chain Scission Mechanisms
| Feature | Random Scission | Chain-End Scission |
|---|---|---|
| Definition | Cleavage of polymer backbone bonds occurs at any point along the chain with equal probability [62]. | Cleavage occurs sequentially, starting from the terminal ends of the polymer chain [60]. |
| Typical Polymer State | Insoluble polymers (e.g., plastics in aqueous environments) [60]. | Soluble polymers [60]. |
| Impact on Molecular Weight | Rapid decrease in average molecular weight; broadens molecular weight distribution initially [62]. | Slow, steady decrease in molecular weight; minimal mass loss until the final stages [61]. |
| Relevance to Recycling | Highly relevant for chemical recycling of condensation polymers (e.g., PA6, PET) via hydrolysis or solvolysis [62]. | Common in biological recycling (enzymatic degradation) and certain chemical recycling processes. |
Table 2: Common Kinetic Models and Parameters for Lifetime Prediction
| Model Name | Core Equation (Simplified) | Key Parameters | Best-Suited For |
|---|---|---|---|
| Random Scission (Polymer) | ( \frac{1}{Xt} - \frac{1}{X0} = k \cdot t ) (Where ( X_n ) is number-average DP) [62] | Scission rate constant (( k )), Activation Energy (( E_a )) [62]. | Hydrolytic/thermal degradation of solid polymers; predicting monomer yield in chemical recycling [62]. |
| Michaelis-Menten (Enzyme) | ( v = \frac{V{max} \cdot [S]}{Km + [S]} ) [59] | ( V{max} ), ( Km ) (Michaelis constant). | Enzymatic degradation of polymers (e.g., biodegradation). |
| Autocatalytic Model | ( \frac{d[M]}{dt} = k \cdot [M]^a \cdot [C] ) (Where [C] is catalyst concentration) [61] | Rate constant (( k )), reaction orders (( a )), diffusion coefficient of catalyst [61]. | Bulk-eroding polymers like PLA and PGA where acidic products accelerate internal degradation [61]. |
| Arrhenius Model | ( k = A \cdot e^{(-E_a / RT)} ) [63] | Pre-exponential factor (A), Activation Energy (( E_a )), Gas constant (R), Temperature (T) [63]. | Accelerated aging studies; extrapolating degradation rates from high-temperature experiments to service conditions [63]. |
Experimental Protocols
Protocol: Determining Scission Mode and Kinetics via Hydrolytic Degradation
Objective: To identify the dominant chain scission mode (random or chain-end) and extract the corresponding kinetic parameters for a polymer under hydrolytic conditions relevant to recycling [62] [61].
Materials and Reagents:
- Polymer sample (e.g., ground pellets or film)
- High-pressure reactor (e.g., Parr reactor) for subcritical water studies [62]
- Thermostated water bath or oven
- Analytical balance
- Equipment for Gel Permeation Chromatography (GPC/SEC)
- Filtering setup
Methodology:
- Sample Preparation: Precisely weigh multiple identical portions of the polymer sample (e.g., ~0.5 g each) and load them into separate reaction vessels.
- Reaction Setup: Add the degradation medium (e.g., deionized water at a specified mass ratio to polymer) to each vessel [62]. Seal the vessels to prevent evaporation.
- Isothermal Degradation: Place the vessels in a pre-heated oven or oil bath set at a constant temperature (e.g., 250°C for subcritical water studies [62]). Ensure rapid heat-up times.
- Sequential Sampling: Remove replicate vessels at predetermined time intervals (e.g., 10, 20, 40, 80 min). Immediately quench the samples in an ice-water bath to stop the reaction.
- Product Recovery: Filter the contents to separate solid residues (undegraded polymer, oligomers) from the liquid phase. Dry the solid residues under vacuum.
- Analysis:
- GPC Analysis: Dissolve the solid residues in a suitable solvent and analyze via GPC to determine the molecular weight distribution (MWD) at each time point [62].
- Mass Loss Determination: Calculate the mass loss from the mass of the dried solid residue compared to the initial polymer mass.
Workflow Diagram:
The Scientist's Toolkit: Research Reagent Solutions
| Item | Function in Experiment |
|---|---|
| Subcritical Water Reactor | Provides a high-temperature, high-pressure environment for efficient hydrolytic degradation of polymers like PA6 and PET, serving as an environmentally friendly reaction medium [62]. |
| Gel Permeation Chromatography (GPC/SEC) System | The primary analytical tool for tracking the evolution of molecular weight and molecular weight distribution over time, which is essential for identifying the scission mechanism [62] [61]. |
| Molecular Dynamics (MD) Simulation Software | Used to simulate the phase behavior and miscibility of polymers with solvents (e.g., water) at the molecular level, helping to predict and explain the dominant degradation mode (e.g., random scission in miscible systems) [62]. |
| Monte Carlo Simulation Algorithm | A computational tool used to model the statistical nature of random chain scission events and predict the resulting molecular weight distributions, aiding in model development and validation [62]. |
The steady increase in global plastics production, coupled with a linear lifecycle where over 75% of plastic waste ends up in landfills or the environment, has created an urgent need for advanced recycling strategies [64]. Mechanical recycling faces a fundamental challenge: most polymers are immiscible and phase-separate when processed together, creating blends with weak interfaces and inferior mechanical properties [65]. This immiscibility stems from the low entropies of mixing inherent to polymer blends due to their long chain lengths [65].
Compatibilization technology addresses this challenge by using amphiphilic polymers or particles that reside at the interface between immiscible phases, strengthening the interface, lowering interfacial tension, and inhibiting droplet coalescence [65]. This technical support center provides researchers with practical guidance for implementing compatibilization strategies within mixed plastic waste streams, framed within the context of recycling reprocessing and polymer degradation research.
Troubleshooting Guides
Common Experimental Challenges and Solutions
Problem: Poor Mechanical Properties in Compatibilized Blends
- Potential Cause 1: Incompatible compatibilizer architecture
- Solution: Ensure compatibilizer has sufficient block length. Studies show block lengths greater than twice the molecular weight of entanglement (Me) form better entanglements with homopolymer phases [65].
- Potential Cause 2: Insufficient compatibilizer loading
- Solution: Optimize compatibilizer concentration. Research demonstrates optimal loading at 5 php (parts per hundred polymer) for r-PET/r-HDPE blends [66].
- Potential Cause 3: Inadequate dispersion during melt processing
- Solution: Use twin-screw extruder instead of manual mixing for better phase dispersion [66].
Problem: Thermal Degradation During Processing
- Potential Cause 1: Excessive processing temperature
- Solution: Lower processing temperature while maintaining polymer melt flow.
- Potential Cause 2: Polymer degradation from repeated processing
- Solution: Incorporate stabilizers suitable for recycled polymers.
- Potential Cause 3: Oxidation during high-temperature processing
- Solution: Process under inert atmosphere when possible.
Problem: Phase Separation Despite Compatibilizer Addition
- Potential Cause 1: Incorrect compatibilizer chemistry for polymer system
- Solution: Select compatibilizers with chemical affinity for both phases. For PE/PLA blends, oxidized PE works effectively [64].
- Potential Cause 2: Insufficient mixing energy
- Solution: Optimize screw speed and configuration in extruder.
- Potential Cause 3: Compatibility limited to surface only
- Solution: For plasma functionalization, reduce melt viscosity to enable bulk functionalization [64].
Frequently Asked Questions (FAQs)
Q1: What are the key molecular characteristics of an effective compatibilizer? Effective compatibilizers typically have blocky architectures rather than random or alternating structures. Blocky copolymers with block lengths greater than twice the molecular weight of entanglement (Me) significantly outperform alternating copolymers, which tend to lay flat at the interface without forming sufficient entanglements with either homopolymer phase [65]. The blocky structure enables the compatibilizer to form loops at the biphasic interface that effectively "stitch" the phases together through chain entanglements.
Q2: How can I compatibilize blends containing crystalline polymers? Compatibilizing crystalline polymer blends requires consideration of both entanglement and crystallization behavior. Research on PVC/POE blends compatibilized with chlorinated polyethylene (c-PE) shows that the strength of the compatibilized interface depends on both the molecular architecture of the compatibilizer and its ability to crystallize [65]. Blockier copolymers are more effective compatibilizers than random copolymers as they can diffuse and entangle with both homopolymers upon annealing at temperatures above the glass transition temperature.
Q3: What are the advantages of non-reactive compatibilization methods? Non-reactive methods like electrostatic compatibilization offer versatility across different polymer systems. This approach utilizes acid-base proton transfer between minimally functionalized polymers (<6 mol% functionalization) to create compatible blends while preserving the crystallinity of semicrystalline polymers during melt reprocessing [67]. This method has been successfully demonstrated with waste-derived polystyrene modified with acid groups and polyethylene functionalized with basic groups.
Q4: How much compatibilizer is typically needed for effective results? Effective compatibilizer loading varies by system but typically ranges from 1-7 php (parts per hundred polymer). For r-PET/r-HDPE blends, research shows 5 php provides optimal viscosity, thermal stability, and mechanical properties [66]. For PE/iPP blends, advanced graft copolymers can be effective at concentrations as low as 1 wt% [68].
Q5: Can compatibilizers handle complex mixed waste streams with more than two polymers? Yes, emerging technologies show promise for ternary blends. Janus nanosheets (JNs) have demonstrated effectiveness as interfacial compatibilizers for polypropylene (PP), polyamide 6 (PA6), and polystyrene (PS) ternary blends, showing 21.1-34.8% improvements in elongation at break [69]. Their unique amphiphilic structure enhances interfacial adhesion between multiple immiscible phases.
Table 1: Performance of Different Compatibilizer Systems
| Polymer System | Compatibilizer Type | Optimal Loading | Tensile Strength | Elongation at Break | Key Findings | Source |
|---|---|---|---|---|---|---|
| PLA/LDPE | Plasma-oxidized LDPE | Not specified | Not specified | 70% increase vs. control | Up to 6 mol% oxygen incorporation | [64] |
| r-PET/r-HDPE | Proprietary compatibilizer | 5 php | 35 MPa | 17% | Improved thermal stability (30°C ↑ in crystallization temp) | [66] |
| PVC/POE | Blocky chlorinated PE (23/9B) | Not specified | Not specified | Not specified | Blockier copolymers more effective than random | [65] |
| PS/PE | Electrostatic (acid-base) | <4-6 mol% functionalization | Not specified | 3-order magnitude toughness increase | Preserved crystallinity in PE | [67] |
| PP/PA6/PS | Janus Nanosheets | Not specified | Increased | 21.1-34.8% improvement | Effective in ternary blends | [69] |
Table 2: Comparison of Compatibilization Strategies
| Strategy | Mechanism | Advantages | Limitations | Polymer Systems |
|---|---|---|---|---|
| Block Copolymers | Interfacial anchoring + chain entanglement | Strong interfacial adhesion, well-established | Synthesis complexity, cost | Wide range including PE/PP [68] |
| Plasma Oxidized Polymers | Bulk oxidative functionalization | Catalyst-free, utilizes renewable energy | Limited to surface without viscosity modification | PE to compatibilize PLA/PE [64] |
| Electrostatic Compatibilization | Acid-base proton transfer | Minimal functionalization needed, preserves crystallinity | Requires polymer functionalization | Amorphous/semicrystalline blends [67] |
| Janus Nanosheets | Physical interfacial compatibilization | Works for ternary blends, novel mechanism | Emerging technology, scalability unknown | PP/PA6/PS blends [69] |
| Reactive Compatibilization | In-situ copolymer formation | No pre-synthesis needed, efficient | May require specific functional groups | Various including r-PET/r-HDPE [66] |
Experimental Protocols
Plasma Oxidation Protocol for PE Compatibilizers
Principle: Non-thermal atmospheric plasma (NTAP) enables molecular activation under mild conditions through collisions of energetic electrons with gas molecules, generating ions, free radicals, and excited species for oxidative functionalization [64].
Materials:
- Polyethylene waste (wax or LDPE)
- Oxygen plasma source
- Temperature-controlled reaction chamber
- Viscosity modifier (for high MW LDPE)
- Extraction solvents (for viscosity modifier removal)
Methodology:
- Sample Preparation: Melt PE wax (>110°C) or LDPE with viscosity modifier
- Plasma Treatment: Impinge oxygen plasma on melt surface
- Process Optimization: Adjust temperature to reduce melt viscosity and enhance chain mobility
- Post-processing: Extract viscosity modifier if used
- Characterization: Analyze oxygen incorporation via XPS, FTIR, and NMR
Key Parameters:
- Treatment time: Up to 4 hours for ~6 mol% oxygen incorporation
- Temperature: Above polymer melting point (>110°C for PE wax)
- Plasma conditions: Oxygen-based, atmospheric pressure
Compatibilizer Performance Evaluation in Blends
Principle: Assess compatibilizer effectiveness through morphological, thermal, rheological, and mechanical analyses to quantify improvements in interfacial adhesion and material properties [66].
Materials:
- Immiscible polymer blend components (e.g., r-PET/r-HDPE)
- Compatibilizer
- Twin-screw extruder
- Injection molding or compression molding equipment
- Testing equipment (tensile tester, rheometer, DSC, SEM)
Methodology:
- Melt Compounding: Use twin-screw extruder for uniform dispersion
- Sample Preparation: Mold into standardized test specimens
- Rheological Testing: Measure viscosity and elasticity
- Thermal Analysis: DSC for crystallization behavior and thermal stability
- Mechanical Testing: Tensile strength and elongation at break
- Morphological Analysis: SEM for phase separation and interface quality
Key Parameters:
- Compatibilizer loading: 0-7 php (optimize for each system)
- Processing temperature: Polymer-specific melt temperatures
- Screw speed: Sufficient for dispersion without degradation
Research Reagent Solutions
Table 3: Essential Materials for Compatibilization Research
| Reagent/Material | Function | Example Applications | Key Characteristics |
|---|---|---|---|
| Blocky Chlorinated PE | Compatibilizer for crystalline/amorphous blends | PVC/POE blends [65] | Block sequence distribution, controlled chlorine content |
| Plasma-oxidized PE | Compatibilizer from waste PE | PLA/LDPE blends [64] | Up to 6 mol% oxygen incorporation, tunable viscosity |
| Janus Nanosheets | Interfacial compatibilizer for ternary blends | PP/PA6/PS blends [69] | Amphiphilic structure, physical interfacial stabilization |
| Acid/Base Functionalized Polymers | Electrostatic compatibilization | PS/PE blends [67] | <6 mol% functionalization, preserves crystallinity |
| PE-graft-iPP Copolymers | Non-reactive compatibilizer for PE/iPP | Mixed polyolefin recycling [68] | Multi-graft architecture, enables co-crystallization |
Advanced Methodologies
Electrostatic Compatibilization Protocol
Principle: Utilizing acid-base proton transfer between minimally functionalized polymers to create electrostatic interactions that compatibilize otherwise immiscible blends [67].
Materials:
- Waste-derived polystyrene (PS)
- Amorphous polybutadiene (PBD) or polyethylene (PE)
- Functionalization reagents (acid and diethylamino base groups)
- Hydrogenation catalyst (for PBD to PE conversion)
- Standard polymer processing equipment
Methodology:
- Polymer Functionalization: Modify PS with <4 mol% acid groups
- Base Functionalization: Modify PBD with <6 mol% diethylamino groups
- Hydrogenation: Convert functionalized PBD to semicrystalline PE
- Blending: Combine functionalized polymers under melt conditions
- Characterization: Assess optical transparency, mechanical properties, and domain sizes
Key Parameters:
- Charge density: 1.0 to 3.5 mol% for optimal compatibilization
- Molecular weight: Higher MW PS (up to 470 kDa) increases toughness
- Functionalization level: Low enough to preserve crystallinity
In mechanical recycling, polypropylene (PP) is subjected to significant thermal and mechanical stress, leading to chain scission, reduced molecular weight, and deterioration of mechanical properties [70] [71]. While twin-screw extruders (TSE) are commonly used, understanding the impact of different extruder types and screw designs is crucial for minimizing degradation and producing high-quality recycled materials. This technical resource center provides evidence-based troubleshooting and experimental guidance for researchers investigating polymer degradation during reprocessing.
Comparative Performance Data
Quantitative Comparison of TSE vs. QSE
Table 1: Comparative degradation indicators for TSE and QSE during polypropylene reprocessing
| Parameter | Twin-Screw Extruder (TSE) | Quad-Screw Extruder (QSE) | Measurement Method |
|---|---|---|---|
| Molecular Weight Reduction | Moderate reduction with increasing cycles/speed | Greater reduction, especially at higher screw speeds | GPC, Melt Flow Index [70] |
| Melt Temperature | Increases with screw speed, decreases slightly with cycles | Higher melt temperatures generated compared to TSE | Type K thermocouple [70] |
| Head Pressure | Decreases with screw speed and processing cycles | Lower head pressures compared to TSE | Pressure transducer [70] |
| Zero-Shear Viscosity | Decreases with reprocessing | Greater reduction compared to TSE | Parallel plate rheometry [70] |
| Impact Strength | Significant reduction after reprocessing | Similar reduction to TSE | Notched Izod impact testing [70] |
| Primary Degradation Mechanism | Thermal-mechanical and oxidative degradation | Higher mechanical stress at three intermeshing points | Molecular weight distribution analysis [70] |
Table 2: Influence of processing parameters on polypropylene degradation
| Processing Parameter | Effect on Degradation | Optimal Range for Minimal Degradation |
|---|---|---|
| Screw Speed | Higher speeds increase degradation in both TSE and QSE [70] [72] | Lower speeds (e.g., 500 vs. 1500 rpm) [70] |
| Number of Reprocessing Cycles | Linear increase in degradation with multiple cycles [70] [72] | Minimize number of reprocessing cycles |
| Processing Temperature | Higher temperatures accelerate degradation [72] | Lower temperature profiles (200-230°C vs. 240-280°C) [70] [72] |
| Throughput Rate | Lower throughputs increase residence time and degradation [72] | Higher throughput rates where feasible |
| Screw Configuration | Kneading blocks (especially 90°) cause more degradation than conveying elements [72] | Conservative use of kneading elements |
Experimental Protocols for Degradation Analysis
Multiple Extrusion Simulation Protocol
Purpose: To simulate mechanical recycling and evaluate processing stability [70]
Materials:
- Virgin impact copolymer polypropylene (e.g., Borealis BB125MO)
- Antioxidants/stabilizers (if testing stabilization packages)
Equipment:
- Twin-screw extruder (e.g., Technovel KZW15TW-45/60 MG-NH) AND/OR
- Quad-screw extruder (e.g., Technovel WDR15QD-45MG-NH)
- Strand die, water bath, pelletizer
- Controlled temperature zones
Procedure:
- Set barrel temperature profile (200-230°C from feed to die)
- Maintain constant feed rate (2.3 kg/h)
- Set screw speeds (500, 1000, 1500 rpm)
- Process material through three consecutive cycles
- Collect melt temperature and head pressure data during processing
- Pelletize extrudate after water bath cooling
- Repeat for all speed variations [70]
Degradation Characterization Methods
Melt Flow Index Measurement:
- Follow ASTM D1238-20 (Procedure A)
- Temperature: 230°C
- Load: 2.16 kg
- Perform five measurements per sample
- Report relative MFI (MFI/MFI₀) [70]
Rheological Properties:
- Use parallel plate rheometer (e.g., TA Instruments ARES-G2)
- Prepare specimen disks via micro-injection molding (230°C, 3 min soak time)
- Perform strain sweep (0.1-100% at 10Hz) to determine linear viscoelastic range
- Conduct frequency sweep (0.01-100 Hz)
- Calculate zero-shear viscosity and analyze storage/loss moduli crossover [70]
Morphological Analysis:
- Prepare molded specimens for FESEM
- Examine dispersed rubbery phase morphology
- Measure particle size and distribution [70]
Impact Strength Testing:
- Perform notched Izod impact testing
- Correlate results with morphological changes [70]
Visual Experimental Workflow
Polymer Degradation Analysis Workflow
The Scientist's Toolkit: Research Reagent Solutions
Table 3: Essential materials and equipment for extrusion degradation studies
| Item | Function/Application | Specifications/Notes |
|---|---|---|
| Impact Copolymer Polypropylene | Base material for reprocessing studies | Heterophasic PP with rubbery dispersed phase (e.g., Borealis BB125MO) [70] |
| Phenolic Antioxidants | Prevent thermo-oxidative degradation during processing | Common stabilization system for PP [70] |
| Hindered Amine Stabilizers | Secondary stabilization system | Improves recyclability [70] |
| Titanium Dioxide (TiO₂) | Filler for compound degradation studies | Affects degradation behavior [72] |
| Parallel Plate Rheometer | Characterize viscoelastic properties and molecular weight changes | e.g., TA Instruments ARES-G2 [70] |
| Extrusion Plastometer | Measure melt flow index as degradation indicator | Follows ASTM D1238-20 [70] |
| Field Emission SEM | Analyze morphological changes in heterophasic systems | Examine rubbery phase particle size distribution [70] |
Troubleshooting Guide: FAQs
Q1: Why does our recycled polypropylene show significantly reduced impact strength after multiple processing cycles?
A: Impact strength reduction correlates strongly with changes in the morphology of the dispersed rubbery phase in impact copolymer PP. Research shows that reprocessing causes reductions in particle size and distribution of the rubbery phase, directly affecting impact performance [70]. This degradation occurs in both TSE and QSE systems and worsens with increasing processing cycles and screw speeds.
Q2: We're experiencing greater-than-expected molecular weight reduction in our quad-screw extruder compared to historical twin-screw data. Is this normal?
A: Yes, this expected behavior. QSEs generate higher stresses due to three intermeshing points along their screws compared to one in TSEs, resulting in greater molecular weight reduction [70]. This manifests as higher melt flow indices, decreased zero-shear viscosity, and shifted crossover points for storage/loss moduli. Consider optimizing processing parameters specifically for QSE technology.
Q3: Which processing parameters most significantly affect polypropylene degradation during reprocessing?
A: The most influential parameters are:
- Screw speed: Higher speeds increase degradation [70] [72]
- Number of processing cycles: Cumulative damage with each cycle [70]
- Processing temperature: Higher temperatures accelerate degradation [72]
- Screw configuration: Kneading blocks cause more degradation than conveying elements [72]
- Throughput rate: Lower rates increase residence time and degradation [72]
Q4: How can we minimize degradation while maintaining adequate mixing in our extrusion process?
A: Implement these strategies:
- Use lower barrel temperature profiles (200-230°C vs. 240-280°C) [70] [72]
- Employ more conservative screw configurations with fewer kneading blocks [72]
- Optimize screw speed to balance mixing efficiency with degradation [70]
- Incorporate more effective stabilization packages [70] [71]
- Consider using a molten resin reservoir to improve properties [73]
Q5: Is a quad-screw extruder better for recycling than a twin-screw extruder?
A: Each technology has distinct advantages. QSEs offer greater free volume, potentially higher throughput, and better mixing due to three intermeshing regions [70]. However, they also cause greater molecular weight reduction due to higher stresses. TSEs may produce less degradation but with potentially lower mixing efficiency. The choice depends on your priority: mixing efficiency (QSE) versus molecular weight preservation (TSE).
Q6: What mathematical models can predict polypropylene degradation during extrusion?
A: Research has developed models that describe molecular weight decrease as a function of process variables. One established model calculates the ratio of weight-average molecular weight after and before processing as: M̄W/M̄W,0 = 1/exp(T/T₀ · (1 + (γ̇w/γ̇₀)²) · (ΔtV/tV,0)) Where T is melt temperature, γ̇w is weighted shear rate, and ΔtV is residence time, with sensitivity parameters T₀, γ̇₀, and tV,₀ [72].
Performance Validation and Comparative Analysis of Recycled Polymers
Standards and Protocols for Validating Recycled Polymer Quality in Biomedical Applications
Troubleshooting Guide: Common Issues in Validating Recycled Polymers
FAQ 1: What are the primary standards for validating recycled polymer biocompatibility? Biocompatibility validation is critical for recycled polymers in biomedical applications. Key standards include ISO 10993 ("Biological evaluation of medical devices"), which provides a framework for evaluating the biological response to medical devices and their materials. For biodegradable polymers specifically, assessments must confirm that degradation byproducts are non-toxic and that the material maintains its intended functionality throughout the degradation process [74]. Furthermore, compliance with environmental regulations such as REACH and FDA standards is crucial for applications in healthcare and drug delivery [75].
FAQ 2: How does sterilization impact the properties of recycled polymers? The choice of sterilization technique significantly affects the properties of recycled polymers and must be carefully selected based on material composition [76]. The table below summarizes the effects of different sterilization methods on common medical polymers:
| Sterilization Method | Polymer Types Affected | Potential Adverse Effects |
|---|---|---|
| Autoclaving (Steam) | Polyvinyl Chloride (PVC) | Plasticizer loss, reduced molecular weight, increased tensile modulus and yield strength [77] |
| Gamma Radiation | PVC/Polystyrene Blends, Polypropylene (PP), Polymethyl Methacrylate | Structural degradation, discoloration, crosslinking [77] |
| Ethylene Oxide (EO) | Polyurethane (PU) | Toxicity requiring long aeration times to remove residues [77] |
| Vaporized Hydrogen Peroxide/Peracetic Acid | Polyurethane (PU) | Antioxidant degradation, coloration changes [77] |
FAQ 3: What are the key challenges in recycling plastic-based biomedical materials? Recycling medical plastics presents unique challenges, including:
- Difficulties in Sorting and Cleaning: Contamination and the mixed nature of clinical waste streams complicate recycling efforts [77] [76].
- Material Degradation: Repeated processing and sterilization can lead to property changes, such as inconsistent color and reduced strength, making recycled materials less appealing for new products [77] [26].
- Validation Requirements: After each sterilization cycle, validation tests are essential to ensure medical devices maintain functionality and that the risk of disease transmission is eliminated [77].
FAQ 4: What advanced technologies are improving the sorting of plastic waste? The integration of artificial intelligence (AI) in sorting systems is a major advancement, enhancing separation accuracy and throughput by up to 95% [26]. These systems, often used in Material Recovery Facilities (MRFs), can achieve material recovery rates of 75-90% for specific streams like PET [26]. Furthermore, spectroscopic techniques are being employed for effective sorting of medical plastics, which is a critical step in the recycling workflow [76].
Experimental Protocols for Validation
Protocol 1: Assessing Mechanical Integrity Post-Sterilization
This protocol evaluates the impact of sterilization on the mechanical properties of recycled polymers, which is vital for device functionality.
1.0 Materials and Equipment
- Tensile Testing Machine: For measuring mechanical properties.
- Sterilization Equipment: Autoclave, gamma irradiator, or EO chamber as required.
- Specimen Molds: For preparing standardized test samples.
2.0 Methodology
- Sample Preparation: Prepare specimens from the recycled polymer according to relevant ASTM/ISO standards (e.g., ASTM D638 for tensile properties).
- Baseline Testing: Perform initial tensile tests on control samples to determine baseline mechanical properties (tensile strength, modulus, elongation at break).
- Sterilization Cycle: Subject test samples to the chosen sterilization method (e.g., autoclaving at 121°C for 15-20 minutes).
- Post-Sterilization Testing: Repeat the tensile testing on sterilized samples.
- Data Analysis: Compare pre- and post-sterilization data. A significant change in properties (e.g., >5% reduction in tensile strength) indicates the sterilization method may be unsuitable for that polymer.
Protocol 2: Chemical Recycling via Pyrolysis for Contaminated Waste
Pyrolysis is a promising thermochemical treatment for heterogeneous or contaminated plastic waste, breaking it down into recoverable components [77] [26].
1.0 Materials and Equipment
- Pyrolysis Reactor: A high-temperature, oxygen-free system.
- Collection Vessels: For condensable gases (oil) and non-condensable gases.
- Gas Chromatography-Mass Spectrometry (GC-MS): For analyzing the output products.
2.0 Methodology
- Feed Preparation: Shred plastic waste to increase surface area. Minimal pretreatment is needed, making this suitable for certain contaminated streams [77].
- Reactor Loading: Load the shredded plastic into the pyrolysis reactor in an inert atmosphere (e.g., N₂).
- Thermal Decomposition: Heat the reactor to a target temperature (typically 300-700°C) to depolymerize the plastic.
- Product Collection: Condense the output vapors to collect hydrocarbon oil and capture non-condensable syngas.
- Product Analysis: Use GC-MS to characterize the chemical composition of the oil, assessing its potential as a feedstock for new polymers or fuels.
Research Reagent Solutions and Essential Materials
The table below lists key materials and reagents used in the recycling and validation of polymers for biomedical applications.
| Reagent/Material | Function in Research & Validation |
|---|---|
| Poly (lactic-co-glycolic acid) (PLGA) | A biodegradable polymer used in nanoparticles for drug delivery; a common target for recycling and reprocessing studies [74]. |
| Polylactic Acid (PLA) | A common bio-polymer; its degradation and behavior under radiation sterilization (e.g., electron beam) is often studied [77]. |
| Chitosan & Gelatin | Natural polymers researched for applications in tissue engineering, drug delivery, and as sustainable materials [74]. |
| Compatibilizers | Additives used in mechanical recycling to improve the miscibility and properties of blended plastic wastes [26]. |
| Engineered Enzymes/Microbial Consortia | Biological agents used in advanced recycling to depolymerize plastics in an environmentally benign manner [26]. |
Experimental Workflows for Polymer Recycling Validation
Workflow 1: Recycling and Validation Pathway
Workflow 2: Sterilization Method Selection Logic
Welcome to the Technical Support Center for Polymer Recycling Research. This resource is designed for researchers and scientists investigating the property evolution of polymers subjected to multiple mechanical recycling cycles. Mechanical recycling, which involves reprocessing plastic waste through melting and reshaping, is a cornerstone of the circular economy for plastics [40]. However, repeated exposure to high temperatures and shear forces during processing induces thermo-mechanical and oxidative degradation, permanently altering the polymer's physicochemical structure [40] [16]. This degradation manifests as changes in molecular weight, melt viscosity, crystallinity, and ultimately, mechanical performance [40] [78]. The extent and mechanisms of degradation differ significantly between polymer types; for instance, polypropylene (PP) primarily undergoes chain scission, while polyethylene (PE) tends toward chain branching and cross-linking [40]. This guide provides targeted troubleshooting and methodologies to help you accurately characterize these changes and understand their implications for the quality and potential applications of recycled materials.
FAQs: Addressing Common Research Challenges
Q1: Why does recycled polypropylene (PP) become more brittle after just a few processing cycles, while recycled polyethylene (PE) sometimes shows increased melt strength?
This difference stems from distinct dominant degradation mechanisms. The property changes you observe are classic indicators of the underlying molecular-level transformations.
- For Recycled PP (Brittleness): PP is highly susceptible to chain scission during thermomechanical processing. This involves the breaking of the main polymer backbone, which reduces the average molecular weight [40] [16]. A key diagnostic indicator is a significant increase in the Melt Flow Index (MFI), signaling reduced melt viscosity and shorter polymer chains [40]. These shorter chains impair the material's ability to absorb impact energy, leading to embrittlement.
- For Recycled PE (Increased Melt Strength): In contrast, PE degradation during processing often involves chain branching and cross-linking [40] [16]. While chain scission also occurs, the resulting free radicals can recombine to form long-chain branches or even cross-linked networks. This increases the molecular weight and melt strength but can also reduce resistance to photo-oxidation and alter crystallinity, which in turn affects mechanical properties [40].
The following diagram illustrates these divergent degradation pathways:
Q2: What are the most sensitive techniques to monitor early-stage degradation in recycled polymers?
Early-stage degradation can be subtle. A multi-technique approach is recommended to capture chemical, molecular, and physical property changes [40] [79].
- Melt Flow Index (MFI): A very sensitive and straightforward method to track changes in melt viscosity, which is directly related to molecular weight. A significant increase suggests chain scission (common in PP), while a decrease suggests cross-linking (common in PE) [40].
- Fourier Transform Infrared (FTIR) Spectroscopy: This technique identifies the formation of new chemical functional groups, such as carbonyl groups (C=O) and hydroperoxides (O-OH), which are products of oxidative degradation [16] [78]. Monitoring the carbonyl index is a standard way to quantify the extent of oxidation.
- Rheology: Beyond MFI, advanced rheological analysis (e.g., using a parallel-plate rheometer) can detect subtle changes in viscoelastic behavior, such as the crossover modulus, which is sensitive to branching and cross-linking [40].
- Gel Permeation Chromatography (GPC): This is the definitive method for measuring changes in molecular weight distribution. It can quantify the reduction in average molecular weight from chain scission or the broadening of the distribution from branching [16].
Q3: Our recycled polymers are failing fatigue tests. What could be the root cause?
Fatigue failure is a critical concern for recycled plastics in durable applications. The root cause often lies in the accumulation of microstructural damage during processing.
- Microcrack Formation: Cyclic loading can lead to the gradual accumulation of plastic deformation and the formation of microcracks, which ultimately lead to failure [78]. Recycled materials may have a higher density of inherent flaws that act as initiation sites for these cracks.
- Accelerated Thermo-Oxidative Degradation: The recycling process itself can consume or degrade the polymer's stabilizer package (e.g., antioxidants) [40]. This leaves the material more vulnerable to oxidative degradation during its subsequent service life, which can embrittle the polymer and drastically reduce its fatigue resistance [40] [4].
- Microstructural Heterogeneities: Recycled polymers, especially from post-consumer waste, can contain contaminants or have an uneven distribution of crosslinks and molecular weights, creating weak points that are prone to failure under repeated stress [80].
Experimental Protocols & Data Interpretation
Standard Protocol: Simulating Multiple Recycling Loops
A widely used method to study degradation during recycling is a simulated multiple processing protocol using extrusion or injection molding [40].
Title: Protocol for Accelerated Ageing via Multiple Extrusion/Injection Molding
Objective: To investigate the progressive thermomechanical and oxidative degradation of a polymer across multiple processing cycles.
Materials & Reagents:
- Virgin polymer granules (e.g., PP impact copolymer, HDPE, LDPE)
- Optional: Industrial post-consumer recycled (PCR) flakes
Procedure:
- Initial Processing: Process the virgin or PCR material using a twin-screw extruder or injection molding machine under defined temperature, screw speed, and pressure settings.
- Specimen Collection: Collect a representative sample of the processed material for characterization (Step 3) and mold standard test specimens (e.g., tensile bars).
- Initial Characterization: Subject the collected material and test specimens to the characterization techniques outlined in Section 3.2.
- Regrinding: Grind the molded test specimens into flakes of a consistent size.
- Reprocessing: Repeat steps 1-4, using the reground material from the previous cycle for the subsequent processing run. A typical study will involve 3 to 10 such cycles [40].
- In-Process Monitoring: Record key processing parameters during each cycle, such as:
- Maximum injection pressure
- Metering time (plasticizing time)
- Melt temperature
- Part weight [40]
The workflow for this protocol is summarized below:
Key Characterization Techniques for Degradation Analysis
The following table summarizes the core characterization methods used to track degradation, their underlying principles, and how to interpret the results.
Table 1: Essential Characterization Techniques for Polymer Recycling Studies
| Technique | What It Measures | Key Parameters to Track | Interpretation of Results in Recycling Context |
|---|---|---|---|
| Melt Flow Index (MFI) | Mass of polymer extruded through a die in 10 minutes under a specified load [40]. | - Flow Rate (g/10 min) | ↑ MFI = Chain scission (common in PP) [40].↓ MFI = Cross-linking/Branching (common in HDPE) [40]. |
| FTIR Spectroscopy | Absorption of infrared light to identify chemical functional groups and bonds [16] [79]. | - Carbonyl Index (C=O stretch ~1700 cm⁻¹)- Hydroperoxide Index (O-OH) | Increase in indices = Oxidative degradation. Confirms chemical mechanism behind property changes [16]. |
| Tensile Testing | Mechanical response to uniaxial stretching until failure. | - Elongation at Break- Tensile Strength- Young's Modulus | Dramatic ↓ in Elongation at Break is a very sensitive indicator of embrittlement [16]. Strength and modulus may also change. |
| Differential Scanning Calorimetry (DSC) | Thermal transitions and crystallinity behavior [78]. | - Melting Temperature (Tₘ)- Crystallinity (%) | Changes in Tₘ and crystallinity indicate alterations in the polymer's microstructure due to degradation [78]. |
| Gel Permeation Chromatography (GPC) | Molecular weight distribution of the polymer. | - Number Avg. Molar Mass (Mₙ)- Weight Avg. Molar Mass (M𝄯)- Polydispersity Index (PDI) | ↓ Mₙ and M𝄯 = Chain scission.↑ PDI = Broadening of distribution, often from branching or a mix of scission/cross-linking [16]. |
Quantitative Data from Research Studies
The table below compiles exemplary data from research to illustrate typical property evolution across multiple processing cycles.
Table 2: Exemplary Property Changes in Polyolefins After Multiple Processing Cycles [40]
| Polymer Type | Recycling Cycles | Melt Flow Index (MFI) | Tensile Modulus | Key Degradation Mechanism |
|---|---|---|---|---|
| Impact PP Copolymer | Virgin (Cycle 0) | 7 g/10 min | ~1350 MPa | Chain Scission |
| 1 | ~11 g/10 min | ~1400 MPa | ||
| 3 | ~14 g/10 min | ~1450 MPa | ||
| 6 | ~25 g/10 min | ~1500 MPa | ||
| High-Density PE (HDPE) | Virgin (Cycle 0) | 7 g/10 min | ~1100 MPa | Chain Branching & Cross-linking |
| 1 | ~6.5 g/10 min | ~1150 MPa | ||
| 3 | ~5.8 g/10 min | ~1200 MPa | ||
| 6 | ~5 g/10 min | ~1250 MPa |
Note: The data in Table 2 is illustrative, based on trends reported in [40]. Actual values are dependent on specific polymer grades and processing conditions.
The Scientist's Toolkit: Essential Research Reagents & Materials
Table 3: Key Materials and Reagents for Polymer Recycling Studies
| Item | Function/Relevance | Example / Note |
|---|---|---|
| Virgin Polymer Granules | Baseline material for comparative analysis. Essential for isolating the effect of recycling from initial material quality. | Use well-characterized, commercial grades (e.g., PP Homo/Copolymer, HDPE, LDPE) [40]. |
| Post-Consumer Recycled (PCR) Flakes | Real-world test material. Often has a history of degradation and contains unknown stabilizer packages. | Sourced from recycling companies; requires thorough washing and characterization [40] [78]. |
| Antioxidants & Stabilizers | Used in controlled experiments to study the mitigation of degradation. | Adding fresh stabilizers to PCR can help determine if property loss is due to degraded additives [40]. |
| Compatibilizers | Experimental additives to improve the miscibility and properties of mixed plastic waste streams. | Often used in blends of polyolefins or with contaminants to study upgradability [81]. |
| Reference Materials | For calibrating and validating analytical equipment. | Narrow MWD polystyrene for GPC, known carbonyl compounds for FTIR, etc. [79]. |
This case study investigates the degradation kinetics of medical-grade polyesters, a critical area of research for developing sustainable recycling processes and understanding the material's lifespan in biomedical applications. The degradation behavior directly impacts the feasibility of mechanical recycling and the safety profile of medical devices. This analysis provides troubleshooting guidance and foundational methodologies for researchers and scientists working in polymer reprocessing and drug development.
Troubleshooting Guide: Common Experimental Challenges
Problem 1: Inconsistent Degradation Rates Between Experimental Batches
- Potential Cause: Variations in initial crystallinity of the polyester samples.
- Solution: Characterize the thermal history of all samples prior to degradation experiments. Use Differential Scanning Calorimetry (DSC) to determine the percent crystallinity and ensure all samples are subjected to identical annealing conditions [82].
- Prevention: Implement a standardized pre-degradation thermal treatment protocol for all polymer specimens.
Problem 2: Difficulty in Determining Erosion Mechanism (Bulk vs. Surface)
- Potential Cause: Reliance on a single characterization method (e.g., gravimetric analysis only).
- Solution: Employ a multi-modal analysis approach. Combine gravimetric analysis with Size Exclusion Chromatography (SEC) to track molecular weight changes and Scanning Electron Microscopy (SEM) to visualize surface morphology [83].
- Prevention: Design experiments to calculate the "erosion number" which considers material dimensions, diffusivity, and bond hydrolysis rate constant to predict the dominant erosion mechanism [82].
Problem 3: Autocatalytic Effect Skews Degradation Profile
- Potential Cause: Acidic by-products trapped within bulk material, accelerating internal degradation.
- Solution: Introduce controlled porosity into specimen design to facilitate by-product diffusion [82]. Consider incorporating basic salts to neutralize acidic breakdown products [82].
- Prevention: For non-porous specimens, ensure sufficiently small sample dimensions (below critical thickness, Lcritical) to allow by-product egress.
Problem 4: Unstable Rheological Properties During Reprocessing
- Potential Cause: Polymer chain scission or cross-linking during multiple extrusion cycles, altering melt viscosity.
- Solution: Monitor the Melt Flow Index (MFI) after each reprocessing cycle. A significant increase indicates chain scission, while a decrease suggests cross-linking or branching [40] [10].
- Prevention: Incorporate appropriate stabilizers into the polymer formulation to mitigate shear and thermal degradation during processing.
Frequently Asked Questions (FAQs)
FAQ 1: Why is understanding degradation kinetics crucial for recycling medical-grade polyesters? Degradation kinetics determine the maximum number of viable mechanical recycling cycles before the material's properties fall below functional requirements. For polyesters like PLA, multiple reprocessing cycles lead to progressive reduction in molecular weight and changes in crystallinity, which directly impact the performance of recycled material in new products [10]. This knowledge is fundamental for designing circular economy pathways for medical plastics.
FAQ 2: What is the most reliable method to confirm chemical degradation has occurred? While physical methods like gravimetric analysis infer degradation, chemical analysis is required for confirmation. Techniques such as Fourier Transform Infrared Spectroscopy (FTIR) can identify changes in chemical bonds, while Size Exclusion Chromatography (SEC) quantitatively tracks the reduction in molecular weight, providing direct evidence of chain scission [83].
FAQ 3: How do material properties influence the degradation rate of polyesters? Several interdependent properties govern degradation rates [82]:
- Crystallinity: Higher crystallinity typically slows degradation as crystalline regions restrict water diffusion.
- Glass Transition Temperature (Tg): The proximity of Tg to the degradation temperature affects polymer chain mobility and water accessibility.
- Molecular Weight: Lower molecular weight polymers often degrade more rapidly due to a higher concentration of chain ends.
- Hydrophilicity: More hydrophilic polymers permit greater water uptake, accelerating hydrolytic degradation.
FAQ 4: What are the limitations of standardized degradation assessment guidelines? Current standards like ASTM F1635-11 have limitations [83]:
- They often involve invasive techniques that disturb the ongoing degradation process during sampling.
- They typically do not facilitate real-time, continuous monitoring of degradation.
- They may not adequately account for the solubility of polymer fragments, potentially mistaking dissolution for degradation.
Table 1: Key Degradation Parameters for Polyesters Under Different Conditions
| Polymer Type | Test Condition | Key Measured Parameter | Change Observed | Citation |
|---|---|---|---|---|
| Polylactic Acid (PLA) | 6 Reprocessing Cycles | Molecular Weight (Mₙ) | Reduction up to 40% | [10] |
| Polylactic Acid (PLA) | 6 Reprocessing Cycles | Crystallinity | Increased from 6.9% to 39.5% | [10] |
| Polypropylene (PP) | Multiple Recycling Loops | Melt Flow Index (MFI) | Significant increase (indicating chain scission) | [40] |
| Polyester/ZnO Composite | TGA at 5-20°C/min | Activation Energy | Reduced vs. neat polyester (catalytic effect) | [84] |
Table 2: Essential Research Reagent Solutions for Degradation Studies
| Reagent/Solution | Function/Application | Typical Concentration/Notes |
|---|---|---|
| Phosphate Buffered Saline (PBS) | Simulates physiological pH conditions for in vitro degradation studies. | 0.01M, pH 7.4 |
| Enzymatic Buffers (e.g., with Proteinase K) | Assesses enzymatically catalyzed hydrolysis, relevant for bioactive environments. | Buffer type and concentration are enzyme-specific. |
| Sodium Hydroxide (NaOH) / Hydrochloric Acid (HCl) | Used to adjust and maintain pH of degradation media, studying pH-dependent kinetics. | Varies; used to explore different physiological pH environments. |
| Solvents (Chloroform, Tetrahydrofuran) | For SEC sample preparation to determine molecular weight distributions. | HPLC grade for analytical techniques. |
Experimental Protocols for Key Analyses
Protocol 1: In Vitro Hydrolytic Degradation Study (Based on ASTM Guidance)
- Sample Preparation: Cut polyester specimens to defined dimensions (e.g., 10mm x 10mm x 1mm). Record initial dry mass (W₀) using a microbalance (precision ±0.1 mg).
- Degradation Media: Immerse samples in phosphate-buffered saline (PBS, pH 7.4) and maintain at 37°C in an incubator.
- Sampling Intervals: Remove triplicate samples at predetermined time points (e.g., 1, 7, 14, 28 days).
- Gravimetric Analysis: Rinse retrieved samples with deionized water, dry to constant mass under vacuum, and record final dry mass (Wt). Calculate mass loss %: [(W₀ - Wt) / W₀] * 100.
- Molecular Weight Analysis: Dissolve dried samples in appropriate solvent and perform SEC to determine changes in molecular weight distribution.
- Surface Morphology: Examine sample surfaces using SEM to visualize erosion patterns and cracking [83].
Protocol 2: Thermogravimetric Analysis (TGA) for Kinetic Parameters
- Instrument Calibration: Calibrate TGA instrument for temperature and mass.
- Sample Loading: Load 5-10 mg of polyester sample into a platinum crucible.
- Experimental Run: Heat sample from ambient temperature to 600°C under inert nitrogen atmosphere at multiple heating rates (β), typically 5, 10, and 20°C/min.
- Data Recording: Record mass loss (α) as a function of temperature (T), where α = (W₀ - Wt) / (W₀ - Wf).
- Kinetic Analysis: Apply model-free isoconversional methods (e.g., Friedman or Kissinger models) to the data from different heating rates to determine the apparent activation energy (Eₐ) of degradation [84].
Experimental Workflow and Signaling Pathways
Polyester Degradation Analysis Workflow
Polyester Hydrolytic Degradation Pathway
Toxicity and Biocompatibility Assessment of Degradation Products from Reprocessed Polymers
FAQs and Troubleshooting Guide
Frequently Asked Questions
Q1: What are the primary biological risks associated with degradation products from reprocessed polymers?
The primary risks stem from the chemical constituents released as polymers break down. These can include:
- Monomers and Additives: Residual monomers, plasticizers, stabilizers, or colorants can leach out [85].
- Oligomers and Short-Chain Fragments: These are produced during hydrolysis and can have enhanced bioavailability and potential toxicity [86].
- Nanoparticles: Incomplete degradation can generate nano-scale particles, which may cause unique biological interactions not seen with larger fragments [86]. The specific toxicological concerns include local irritation, systemic toxicity, genotoxicity, and sensitization (allergic reactions) [87] [88]. The key risk differentiator from conventional plastics is the degradation rate; faster-degrading polymers may release higher concentrations of leachables over a shorter period, but their persistence in the body is reduced [86].
Q2: How does the degradation mechanism (hydrolytic vs. oxidative) influence the toxicity profile of the resulting products?
The degradation mechanism fundamentally alters the chemical nature of the breakdown products, leading to different toxicity pathways.
- Hydrolytic Degradation: This occurs when water molecules cleave susceptible bonds in the polymer backbone (e.g., ester bonds in PLA, PGA, and PBAT) [88] [89]. It produces smaller acid and alcohol fragments, which can lower the local pH and cause acid-catalyzed tissue irritation [88].
- Oxidative Degradation: This is driven by reactive oxygen species (ROS) generated by inflammatory cells in response to the implanted material [88]. It is a more aggressive process that can lead to chain scission and the formation of peroxides and other reactive compounds, which can provoke a stronger inflammatory and immunotoxic response [88].
The table below summarizes the core differences:
Table 1: Influence of Degradation Mechanism on Toxicity Profile
| Feature | Hydrolytic Degradation | Oxidative Degradation |
|---|---|---|
| Primary Cause | Reaction with water [88] | Reaction with oxidants (e.g., ROS from inflammatory cells) [88] |
| Key Polymers Affected | Polyesters (PLA, PCL, PGA, PBAT), polyanhydrides [88] [89] | Polyurethanes, polyolefins [88] |
| Typical Degradation Products | Acids, alcohols, oligomers [88] | Peroxides, aldehydes, chain-cleaved fragments with reactive end-groups [88] |
| Potential Biological Impact | Local pH decrease, acid irritation [88] | Enhanced inflammation, immunotoxicity, potential for protein modification [88] |
Q3: Our in vitro cytotoxicity results are inconsistent with in vivo implantation data. What could be the cause?
This common problem arises from the oversimplification of in vitro systems. Key factors to investigate are:
- Improper Simulation of the Dynamic In Vivo Environment: Static in vitro tests may not wash away degradation products, leading to unrealistically high local concentrations and false positive toxicity. Conversely, they may miss chronic, low-level effects detected in vivo [88]. Ensure your extraction media are refreshed regularly to simulate dynamic physiological conditions.
- Lack of Metabolic and Immune System Components: In vitro systems lack the enzymatic, protein-binding, and inflammatory cell (e.g., neutrophils, macrophages) activity that significantly influences degradation and tissue response in vivo [88]. Consider incorporating enzymes or using simulated body fluids (SBF, SGF, SIF) that more closely mimic the target biological environment [86].
- Inadequate Characterization of the Test Material: The surface area, porosity, and crystallinity of the test sample can drastically alter degradation kinetics. An in vitro test using finely ground polymer may degrade much faster than an implanted solid device, skewing results [88]. Characterize your test samples thoroughly and ensure in vitro and in vivo samples have comparable physical forms.
Q4: Which international standards are critical for the biological safety evaluation of reprocessed polymers in medical devices?
Compliance with international standards is mandatory. The cornerstone standard is the ISO 10993 series, "Biological evaluation of medical devices" [87]. The following table outlines the key parts:
Table 2: Key ISO 10993 Standards for Biocompatibility Assessment [87]
| ISO 10993 Part | Biological Endpoint | Purpose and Relevance |
|---|---|---|
| Part 5 | Cytotoxicity | Tests for cell death, growth inhibition, and other toxic effects on mammalian cells in vitro [87]. |
| Part 6 | Local Effects after Implantation | Evaluates the local pathological effects on living tissue at the implantation site [87]. |
| Part 10 | Skin Sensitization | Determines the potential for allergic contact dermatitis (Type IV hypersensitivity) [87]. |
| Part 3 | Genotoxicity, Carcinogenicity | Assesses potential for DNA damage and tumorigenicity, critical for long-term implants [87]. |
| Part 11 | Systemic Toxicity | Evaluates potential adverse effects distant from the contact site, over acute, subchronic, or chronic durations [87]. |
| Part 12 | Sample Preparation | Provides guidance on preparing extracts and test articles, which is crucial for reprocessed materials with potential leachables [87]. |
Regional regulatory bodies (e.g., US FDA, EU MDR) also have specific guidances that must be consulted [87].
Troubleshooting Common Experimental Challenges
Problem: Inconsistent Degradation Rates Between Experimental Batches
- Potential Cause 1: Variations in the initial molecular weight or crystallinity of the reprocessed polymer. Reprocessing can cause macromolecular degradation, reducing viscosity and altering the material's microstructure [85].
- Solution: Implement rigorous pre-screening of all polymer batches using Gel Permeation Chromatography (GPC) for molecular weight and Differential Scanning Calorimetry (DSC) for thermal properties and crystallinity [89].
- Potential Cause 2: Fluctuations in the degradation environment (e.g., pH, enzyme concentration, temperature).
- Solution: Standardize buffer recipes, use fresh enzymes, and employ precise temperature-controlled incubation chambers. Monitor pH regularly throughout the experiment [89].
Problem: High Background Noise in Cytotoxicity Assays (e.g., MTT)
- Potential Cause: The polymer extracts or degradation products themselves are colored or interfere with the assay's spectrophotometric readout.
- Solution: Run an interference control where the assay is performed with the extract but without cells. Subtract this background value from the test results. Alternatively, switch to a different assay method (e.g., XTT, Neutral Red Uptake) that uses a different detection chemistry [87].
Problem: Failure in Sensitization Tests
- Potential Cause: Leachable chemicals from the polymer, such as residual catalysts, stabilizers, or degradation by-products, are acting as haptens and triggering an immune response [87] [85].
- Solution: Conduct a thorough chemical characterization of the polymer as per ISO 10993-18. Identify the specific sensitizing compound using techniques like LC-MS and reformulate the polymer to remove or reduce that constituent [87].
Standardized Experimental Protocols
Protocol 1: In Vitro Degradation and Analysis in Simulated Physiological Fluids
This protocol assesses the degradation behavior and fragment release of reprocessed polymers under simulated human conditions [86].
Research Reagent Solutions:
- Simulated Body Fluid (SBF): An ion-balanced solution mimicking blood plasma [86].
- Simulated Gastric Fluid (SGF): Acidic solution with pepsin, mimicking stomach conditions [86].
- Simulated Intestinal Fluid (SIF): Neutral solution with pancreatin, mimicking intestinal conditions [86].
Methodology:
- Sample Preparation: Cut polymer into standardized films or particles (e.g., 10mm x 10mm x 0.5mm). Accurately record initial mass (M₀) and sterilize.
- Incubation: Immerse each sample in a controlled volume of SBF, SGF, or SIF. Maintain at 37°C under gentle agitation. Use a ratio of 1 g polymer to 100 mL solution.
- Sampling and Analysis: At predetermined time points (e.g., 1, 7, 14, 28 days):
- Mass Loss: Rinse retrieved samples, dry thoroughly, and weigh (Mₜ). Calculate percentage mass loss:
(M₀ - Mₜ)/M₀ × 100%. - Molecular Weight Change: Analyze a subset of samples using Gel Permeation Chromatography (GPC) to track changes in molecular weight distribution.
- Morphology: Examine surface erosion and cracking using Scanning Electron Microscopy (SEM).
- Fragment Release: Analyze the incubation media for released micro/nanoparticles using techniques like Dynamic Light Scattering (DLS) or Nanoparticle Tracking Analysis (NTA) [86].
- Mass Loss: Rinse retrieved samples, dry thoroughly, and weigh (Mₜ). Calculate percentage mass loss:
Protocol 2: Cytotoxicity Testing of Polymer Extracts per ISO 10993-5
This test evaluates the cytotoxic potential of leachable substances from the polymer.
Research Reagent Solutions:
- Extraction Media: Cell culture medium with serum, polar solvent (e.g., saline), and non-polar solvent (e.g., DMSO or vegetable oil) [87].
- Cell Line: Established mammalian cell lines (e.g., L-929 mouse fibroblast or other relevant lineages).
Methodology:
- Sample Extraction: Incubate the polymer sample in extraction media at a standardized surface area-to-volume ratio (e.g., 3 cm²/mL or 0.1 g/mL) for 24 hours at 37°C [87].
- Cell Seeding: Culture cells in 96-well plates and allow them to attach for 24 hours.
- Exposure: Replace the culture medium with the polymer extract. Include negative (culture medium) and positive (e.g., latex, phenol) controls.
- Incubation and Assessment: Incubate cells for 24-72 hours. Assess cytotoxicity using a quantitative method such as the MTT assay, which measures the reduction of a yellow tetrazolium salt to purple formazan by metabolically active cells. Calculate cell viability relative to the negative control [87].
Visualization of Workflows and Pathways
Diagram 1: Biocompatibility Assessment Workflow
This diagram outlines the logical workflow for assessing the toxicity and biocompatibility of reprocessed polymers, integrating chemical, in vitro, and in vivo analyses.
Diagram 2: Polymer Degradation and Toxicity Pathways
This diagram illustrates the molecular mechanisms of polymer degradation and the subsequent biological toxicity pathways they can trigger.
The Scientist's Toolkit: Key Research Reagent Solutions
Table 3: Essential Reagents and Materials for Degradation and Biocompatibility Studies
| Reagent/Material | Function and Application |
|---|---|
| Simulated Body/Gastric/Intestinal Fluids (SBF, SGF, SIF) | Mimic in vivo physiological environments for in vitro degradation studies to predict material behavior in the body [86]. |
| Cell Culture Media (with Serum) | Used for preparing polymer extracts and maintaining mammalian cell lines for cytotoxicity testing according to ISO 10993-5 [87]. |
| Polar & Non-Polar Extraction Solvents | Ensure a comprehensive extraction of both water-soluble and fat-soluble leachable substances from the polymer for toxicological testing [87]. |
| MTT/XTT Reagents | Tetrazolium salts used in colorimetric assays to quantitatively measure cell viability and proliferation in cytotoxicity tests [87]. |
| Enzymes (e.g., Esterases, Proteases) | Used to study enzymatic degradation pathways, which are relevant for polymers designed to degrade in specific biological niches [89]. |
| Reference Materials | Positive (e.g., phenol, latex) and negative controls required for validating biological test methods as per ISO 10993 standards [87]. |
Troubleshooting Guides
FAQ: Interpreting Life Cycle Assessment (LCA) Results
Q1: How can I effectively interpret and compare LCA results from different polymer recycling studies?
Interpreting Life Cycle Assessment (LCA) results requires careful attention to the system boundaries, functional units, and underlying assumptions used in each study. A recent LCA for a chemical recycling technology, TAC, reported 78% CO2 eq. savings compared to incineration with energy recovery, potentially rising to 89% with grid decarbonization [90]. When comparing such figures, verify that studies assess equivalent waste management scenarios (e.g., recycling vs. incineration vs. landfilling) and similar plastic waste streams (e.g., hard-to-recycle flexibles) [91] [90]. Always check if the LCA is peer-reviewed and complies with ISO 14040/14044 standards.
Q2: What are the primary reasons for variability in carbon footprint reporting across recycling technologies?
Variability stems from several technical factors. Mechanical recycling generally has lower energy demand but is highly sensitive to contamination, which can increase processing energy and yield losses [91]. Thermolysis methods (pyrolysis/gasification) are energy-intensive but can handle mixed wastes, with emissions heavily dependent on process heat source and efficiency [91]. Chemical depolymerization can enable closed-loop recycling but may involve toxic chemicals and substantial energy for purification [91]. Key variables include:
- Energy source: Use of renewable electricity significantly reduces carbon footprint [90].
- Feedstock quality: Pre-sorting and washing requirements.
- Process efficiency: Conversion yields and catalyst usage [91].
Q3: My LCA model shows unexpectedly high energy consumption for mechanical recycling. What operational factors should I investigate?
High energy consumption in mechanical recycling often relates to upstream and core process inefficiencies. Focus on:
- Sorting Efficiency: Inefficient sorting of complex plastic waste streams increases processing time and energy [92].
- Contamination Level: Food residue, dirt, or mixed materials require more intensive washing and drying, raising energy use [93].
- Material Degradation: Poorly controlled reprocessing can cause polymer degradation, necessitating higher throughput to achieve yield targets and increasing energy per unit output [91] [93].
- Machine Maintenance: Blockages, hopper bridging, and die head clogging in recycling machinery reduce energy efficiency and require preventive maintenance [93].
FAQ: Experimental Challenges in Recycling Efficiency
Q4: During reprocessing experiments, I observe significant polymer degradation. What are the leading causes and solutions?
Polymer degradation during reprocessing manifests as reduced molecular weight, discoloration, and impaired mechanical properties. This is a core concern in recycling reprocessing polymer degradation research.
Cause: Thermal Overheating
- Problem: Overheating in extruders or during preconditioning (e.g., cutter compaction) breaks polymer chains [93].
- Solution: Precisely calibrate and monitor temperature zones based on specific polymer type. Use thermal stabilizers appropriate for the polymer system and prevent local clogging that causes residence time distribution [93].
Cause: Mechanical Shear Overload
Cause: Residual Contamination
- Problem: Presence of impurities (e.g., other polymer types, labels, adhesives) can catalyze degradation reactions [92].
- Solution: Implement rigorous waste sorting and washing protocols before reprocessing. Consider vacuum degassing systems during extrusion to remove volatile degradation products [93].
Q5: My recycled plastic pellets have inconsistent quality, including hollow shapes, stickiness, or non-uniform sizes. How can I resolve these issues?
These common operational problems directly impact the quality and eco-efficiency of your recycled output.
Problem: Hollow Pellets
- Cause: Inadequate degassing of volatile components, poor plasticization, or incorrect cooling parameters [93] [94].
- Solution: Employ a vacuum degassing system on the extruder. Optimize temperature zones for uniform melt viscosity and adjust cooling water temperature/circulation speed to prevent rapid surface solidification [93].
Problem: Sticky Pellets
Problem: Non-Uniform Pellets or Chunks
- Cause: Instability in material feeding, poor melt flow, or inefficient pellet cutting systems [93] [94].
- Solution: Utilize automatic feeding systems synchronized with the pelletizer. Maintain consistent melt flow through temperature control and prevent die head clogging. Use auto-speed and pressure-controlled pelletizers for consistent cut geometry [94].
Q6: When applying advanced recycling techniques (e.g., chemical, biological), what scalability challenges should I anticipate?
Scaling emerging recycling technologies from laboratory to industrial implementation presents specific hurdles.
Chemical Depolymerization Challenges:
- Feedstock Purity: Requires efficient pre-sorting to achieve high monomer yields, as contaminants can poison catalysts [91].
- Process Economics: High energy demands and costly catalysts impact viability; techno-economic analysis (TEA) is essential [91].
- Safety and Environmental Management: Requires handling of potentially toxic chemicals and managing by-products [91].
Biological Recycling Challenges:
- Processing Speed: Enzyme or microbial degradation rates are typically slow compared to thermal/chemical methods [91].
- Substrate Specificity: Most biological systems are effective only on specific bioplastics (e.g., PLA, PHA), limiting application to mixed waste [91].
- Sterility and Process Control: Maintaining optimal biological activity at scale requires careful control of temperature, pH, and sterility, adding complexity and cost [91].
Quantitative Data Comparison
Table 1: Environmental and Economic Characteristics of Primary Polymer Recycling Technologies
| Recycling Method | Applicable Plastic Types | CO2 Reduction Potential | Economic Considerations | Key Technical Limitations |
|---|---|---|---|---|
| Mechanical Recycling | PET, HDPE, LDPE, PP, PS [91] | High (due to lower energy demand) [91] | Cost-effective but sensitive to feedstock quality and sorting costs [91] | Quality degradation after repeated cycles; sensitive to contamination [91] |
| Pyrolysis | Mixed plastic waste, PS, PE, PP [91] | Moderate (energy-intensive process) [91] | High initial investment; operational costs sensitive to scale and energy prices [91] | High energy demand; technical complexity; by-product management [91] |
| Gasification | Mixed plastic waste, multi-layered packaging [91] | Moderate (energy-intensive process) [91] | High initial investment; viability depends on energy/ syngas markets [91] | Very high temperatures required; careful management of emissions and slag [91] |
| Chemical Depolymerization | PET, PA, PU, engineering plastics [91] | Varies (78-89% reported for specific technologies vs. incineration) [90] | High cost and complexity; catalyst and chemical input costs significant [91] | Often requires pure feedstocks; toxic chemical usage; energy-intensive purification [91] |
| Biological Recycling | PLA, PET, PHA [91] | High potential (low energy requirement at room temperature) [91] | Early R&D stage; costs currently high but potential for reduction [91] | Very slow process rates; primarily applicable to specific bioplastics [91] |
Table 2: Common Polymer Types and Their Recycling Characteristics
| Polymer Type | Common Applications | Recycling Compatibility | Key Challenges in Recycling |
|---|---|---|---|
| PET (Polyethylene Terephthalate) | Beverage bottles, food containers [5] | High (Mechanical, Chemical) [91] | Moisture sensitivity during reprocessing; contamination from labels and adhesives [92] |
| HDPE (High-Density Polyethylene) | Shampoo bottles, milk jugs, pipes [5] | High (Mechanical) [91] | Pigment removal; potential for oxidative degradation during reprocessing |
| LDPE (Low-Density Polyethylene) | Plastic bags, flexible packaging films [5] | Moderate (Mechanical) [91] | Film contamination (food, dirt); thin layers difficult to collect and sort [92] |
| PP (Polypropylene) | Food containers, automotive parts, furniture [5] | Moderate (Mechanical) [91] | Sensitivity to thermo-oxidative degradation; often used in multi-material structures [92] |
| PS (Polystyrene) | Packaging foam, disposable cutlery, insulation [5] | Low (Mechanical), Moderate (Pyrolysis) [91] | Low density makes collection inefficient; brittle nature limits recyclate value |
| PVC (Polyvinyl Chloride) | Pipes, window frames, medical devices [5] | Low [91] | Chlorine content complicates processing; potential hazardous emissions during thermal degradation |
| Engineering Plastics | Automotive, electronics, aerospace (e.g., CFRP, GFRP) [5] | Low (Mechanical), Emerging (Chemical) [91] | Complex composite structures; thermoset matrices are not melt-reprocessable [5] |
Experimental Protocols
Protocol: Life Cycle Assessment for Polymer Recycling Routes
Objective: To quantify and compare the environmental impacts of different polymer recycling pathways using standardized LCA methodology.
Methodology:
Goal and Scope Definition:
- Define specific research questions and intended applications of results.
- Establish system boundaries (cradle-to-gate or cradle-to-grave).
- Select functional unit (e.g., 1 kg of processed recycled pellet, 1 unit of packaging product).
Life Cycle Inventory (LCI):
- Collect primary data from experimental recycling trials including:
- Energy consumption (electricity, thermal) per kg of processed material [91]
- Material inputs (water, chemicals, catalysts)
- Outputs (recycled materials, emissions, waste streams)
- Supplement with secondary data from commercial databases for upstream (e.g., electricity generation) and downstream processes.
- Collect primary data from experimental recycling trials including:
Life Cycle Impact Assessment (LCIA):
- Select impact categories relevant to polymer recycling (global warming potential, energy consumption, water use, etc.) [91].
- Calculate category indicator results (e.g., kg CO2 eq. per functional unit).
- Normalize and weigh results if required for comparative assertions.
Interpretation:
- Evaluate significant issues identified in LCI and LCIA.
- Conduct sensitivity analysis of key parameters (e.g., energy source, transportation distance).
- Formulate conclusions and recommendations consistent with scope and goal.
Applications: This protocol enables researchers to generate comparable environmental impact data for different recycling technologies, supporting eco-efficiency claims and identifying improvement opportunities [91] [90].
Protocol: Techno-Economic Analysis for Recycling Processes
Objective: To evaluate the economic viability and identify cost drivers of polymer recycling technologies.
Methodology:
Process Modeling:
- Develop detailed process flow diagrams of the recycling system.
- Specify mass and energy balances based on experimental data.
Capital Cost Estimation:
- Itemize equipment costs (sorting, washing, shredding, reactors, extrusion, pelletizing).
- Include installation, instrumentation, and facility costs.
- Use established factoring methods for preliminary estimates.
Operating Cost Estimation:
- Raw material costs (waste plastic feedstock, chemicals, catalysts).
- Utilities (electricity, natural gas, water, wastewater treatment).
- Labor, maintenance, and overhead costs.
Financial Analysis:
- Calculate key indicators (net present value, internal rate of return, payback period).
- Conduct sensitivity analysis on critical parameters (feedstock cost, product value, energy cost).
Applications: TEA helps identify economic barriers, optimize process economics, and guide research priorities toward commercially viable recycling solutions [91].
Workflow Visualization
Polymer Recycling Analysis Workflow
Research Reagent Solutions
Table 3: Essential Research Materials for Polymer Recycling Studies
| Reagent/Material | Function in Research | Application Examples |
|---|---|---|
| Reference Polymer Materials | Provide standardized substrates for recycling studies | Virgin polymer pellets of known molecular weight and distribution for degradation studies |
| Thermal Stabilizers | Inhibit thermal oxidative degradation during reprocessing | Phosphites, hindered phenols for polyolefins; heat stabilizers for PVC |
| Catalysts for Depolymerization | Accelerate chemical breakdown to monomers | Metal catalysts for pyrolysis; transesterification catalysts for PET glycolysis |
| Enzymes for Biological Recycling | Catalyze selective polymer degradation under mild conditions | PET hydrolases, cutinases for polyester degradation; lignin-modifying enzymes |
| Analytical Standards | Enable quantification of process outputs and potential contaminants | Monomer standards for HPLC; hydrocarbon standards for GC-MS; emission factor standards |
| Process Aids | Improve handling and processing of recycled materials | Compatibilizers for mixed plastic streams; lubricants for extrusion; anti-blocking agents |
Conclusion
The interplay between polymer recycling and degradation presents both significant challenges and promising opportunities for biomedical applications. A thorough understanding of degradation mechanisms—from fundamental chain scission to complex thermo-oxidative pathways—is paramount for developing effective mitigation strategies. Advanced analytical techniques and kinetic models are crucial for accurate lifetime predictions and quality validation. While current recycling processes inevitably induce molecular-level damage, emerging technologies like enzymatic depolymerization and process optimization offer pathways to minimize property deterioration. For the biomedical field, future progress hinges on developing robust validation frameworks to ensure the safety and performance of recycled polymers, particularly regarding the toxicity of degradation products. Closing the loop through chemical recycling and designing polymers for circularity will be essential for sustainable biomedical material strategies, demanding continued collaboration between polymer scientists, process engineers, and clinical researchers.
References
- 1. Polymer degradation - Support home [https://support.3devo.com/troubleshooting-polymer-degredation]
- 2. Injection Molding Defects:Polymer Degradation [https://www.asaclean.com/blog/injection-molding-defectspolymer-degradation]
- 3. Molecular Pathways for Polymer Degradation during ... [https://pmc.ncbi.nlm.nih.gov/articles/PMC10004996/]
- 4. Degradation of Polymer Materials in the Environment and ... [https://www.mdpi.com/2073-4360/16/19/2807]
- 5. Recent Advances in Polymer Recycling - PubMed Central - NIH [https://pmc.ncbi.nlm.nih.gov/articles/PMC11902707/]
- 6. Recycling of waste from polymer materials: An overview ... [https://www.sciencedirect.com/science/article/abs/pii/S0141391013003133]
- 7. UW-Madison researchers map out a promising future for ... [https://engineering.wisc.edu/news/uw-madison-researchers-map-out-a-promising-future-for-solvent-based-plastics-recycling/]
- 8. Constitutive modeling of diffusion-limited oxidation coupled ... [https://www.sciencedirect.com/science/article/abs/pii/S0167663625000328]
- 9. Molecular Pathways for Polymer Degradation during ... [https://www.mdpi.com/1420-3049/28/5/2344]
- 10. Effect of Degradation During Multiple Primary Mechanical ... [https://pmc.ncbi.nlm.nih.gov/articles/PMC12473880/]
- 11. Defining quality by quantifying degradation in the ... [https://www.nature.com/articles/s41467-024-52856-8]
- 12. Recent Advances in Polymer Recycling: A Review of ... [https://www.mdpi.com/2073-4360/17/5/603]
- 13. Polymer Degradation in Plastics & How to Prevent Them [https://in.chemtrend.com/news/polymer-degradation-in-plastics-how-to-prevent-them/]
- 14. Understanding Polymer Degradation: Challenges and ... [https://www.plastics-technology.com/articles/polymer-degradation-plastics-industry]
- 15. How changes in molecular weight and PDI of a polymer ... [https://www.sciencedirect.com/science/article/abs/pii/S0378517318309189]
- 16. Polymer Degradation - an overview [https://www.sciencedirect.com/topics/engineering/polymer-degradation]
- 17. Degradation mechanisms effect on the ... [https://link.springer.com/article/10.1007/s44347-025-00029-1]
- 18. Degradation of Polymer: A Comprehensive Overview - Reachem [https://www.reachemchemicals.com/blog/degradation-of-polymer-a-comprehensive-overview/]
- 19. Biomedical Applications of Biodegradable Polyesters - PMC [https://pmc.ncbi.nlm.nih.gov/articles/PMC6432531/]
- 20. Biodegradable Polymers: Properties, Applications, and ... [https://pmc.ncbi.nlm.nih.gov/articles/PMC12298952/]
- 21. Recent advances in biodegradable polymers for ... [https://www.nature.com/articles/s41529-022-00277-7]
- 22. Current Advances in Biodegradation of Polyolefins - PMC [https://pmc.ncbi.nlm.nih.gov/articles/PMC9416408/]
- 23. An overview of degradable and biodegradable polyolefins [https://www.sciencedirect.com/science/article/abs/pii/S0079670010001267]
- 24. Chemical degradation and recycling of polyethylene ... [https://pubs.rsc.org/en/content/articlehtml/2025/su/d4su00658e]
- 25. Potential threats of environmental microplastics to the ... [https://pmc.ncbi.nlm.nih.gov/articles/PMC12454088/]
- 26. Advanced technologies for plastic waste recycling [https://pubs.rsc.org/en/content/articlehtml/2025/ra/d5ra06715d]
- 27. Exploring the potential of chemical recycling using a ... [https://www.sciencedirect.com/science/article/pii/S0956053X25001278]
- 28. Rheological Measurements and Structural Analysis of ... [https://pmc.ncbi.nlm.nih.gov/articles/PMC8038039/]
- 29. IR Spectroscopy as a Diagnostic Tool in the Recycling ... [https://pmc.ncbi.nlm.nih.gov/articles/PMC12527066/]
- 30. Methods of Analyses for Biodegradable Polymers: A Review [https://pmc.ncbi.nlm.nih.gov/articles/PMC9694517/]
- 31. Spectroscopy for Plastics Recycling [https://www.oceanoptics.com/blog/spectroscopy-for-plastics-recycling/]
- 32. HPLC Troubleshooting Guide [https://scioninstruments.com/us/blog/hplc-troubleshooting-guide-2/]
- 33. Standardization guidelines and future trends for PET ... [https://www.nature.com/articles/s41467-025-60016-9]
- 34. Enzymatic Bio-Recycling: How Close Are We to Industrial ... [https://www.plasticsengineering.org/2025/07/enzymatic-bio-recycling-how-close-are-we-to-industrial-scale-008887/]
- 35. Enzymatic Depolymerization and Recycling [https://cleantech.com/enzymatic-depolymerization-and-recycling-using-enzymes-to-convert-linear-waste-streams-into-circular-supply-chains/]
- 36. Chemoenzymatic cascade depolymerization of plastics [https://www.nature.com/articles/s42004-025-01679-9]
- 37. and Degradation Pathways of Synthetic Textile Fibers such... Recycling [https://pmc.ncbi.nlm.nih.gov/articles/PMC12003217/]
- 38. Effect of Degradation During Multiple Primary Mechanical ... [https://www.mdpi.com/2073-4360/17/18/2542]
- 39. Mechanical Recycling and Its Effects on the Physical and ... [https://www.mdpi.com/2073-4360/15/23/4561]
- 40. Degradation indicators in multiple recycling processing ... [https://www.sciencedirect.com/science/article/abs/pii/S014139102300366X]
- 41. The impact of mechanical recycling on the degradation ... [https://www.sciencedirect.com/science/article/abs/pii/S0141391024001174]
- 42. Impact of Multiple Mechanical Recycling Cycles via Semi ... [https://pmc.ncbi.nlm.nih.gov/articles/PMC12298556/]
- 43. Mechanical recycling of poly(butylene succinate) ... [https://www.sciencedirect.com/science/article/pii/S1385894725006229]
- 44. Polymer recycling in an open-source additive ... [https://www.sciencedirect.com/science/article/abs/pii/S2214860416301695]
- 45. 3D Printing Troubleshooting Guide for Common Issues [https://blog.geeetech.com/3d-printing-trouble-shooting-guide/troubleshooting-guide-to-24-common-3d-printing-problems-part-1/]
- 46. 3D Printer Troubleshooting Guide [https://www.matterhackers.com/articles/3d-printer-troubleshooting-guide?srsltid=AfmBOorMej2ojsjR7x74if2_E15p-nQedbmVvKMzK1ZAGwWHAdBew97Y]
- 47. Structural decay of poly(ethylene terephthalate) by ... [https://www.nature.com/articles/s41428-025-01111-y]
- 48. Plastics Recycling With Enzymes Takes a Leap Forward [https://www.nrel.gov/news/detail/program/2025/plastics-recycling-with-enzymes-takes-a-leap-forward]
- 49. Enzymatic degradation of polymers: great potential for ... [https://hims.uva.nl/content/news/2025/06/enzymatic-degradation-of-polymers-great-potential-for-analysis-and-recycling.html?origin=HRUrNZgrQ0uFunXh6izRAg]
- 50. Screening Enzymes That Can Depolymerize Commercial ... [https://pmc.ncbi.nlm.nih.gov/articles/PMC9963400/]
- 51. Engineering Plastic Eating Enzymes Using Structural Biology [https://pmc.ncbi.nlm.nih.gov/articles/PMC10526444/]
- 52. Recent advances in enzyme engineering for improved ... [https://www.nature.com/articles/s43246-025-00919-8]
- 53. Review Analytical tools to assess polymer biodegradation [https://www.sciencedirect.com/science/article/abs/pii/S0048969724070773]
- 54. Additives for plastic film producers and converters [https://convertingquarterly.com/additives-for-plastic-film-producers-and-converters/]
- 55. Stabilization and Processing of Recycled Plastics, Product ... [https://www.chempoint.com/insights/stabilization-and-processing-of-recycled-plastics]
- 56. Effect of Additives on Thermal Degradation and Crack ... [https://pmc.ncbi.nlm.nih.gov/articles/PMC11281069/]
- 57. Degradation of Polypropylene and ... [https://pmc.ncbi.nlm.nih.gov/articles/PMC12157225/]
- 58. Polymer Degradation - an overview [https://www.sciencedirect.com/topics/materials-science/polymer-degradation]
- 59. Impact of the Error Structure on the Design and Analysis of ... [https://pmc.ncbi.nlm.nih.gov/articles/PMC10008308/]
- 60. Article Revealing chain scission modes in variable polymer ... [https://www.sciencedirect.com/science/article/pii/S2950636025001604]
- 61. A reaction-diffusion framework for hydrolytic degradation of ... [https://pubmed.ncbi.nlm.nih.gov/37343906/]
- 62. Random scission kinetic model for polymer degradation [https://www.sciencedirect.com/science/article/abs/pii/S0009250925007456]
- 63. Lifetime Prediction Methods for Degradable Polymeric ... [https://pmc.ncbi.nlm.nih.gov/articles/PMC7599543/]
- 64. Sustainable upcycling of polyethylene waste to ... [https://pubs.rsc.org/en/content/articlehtml/2025/gc/d5gc02799c]
- 65. Molecular design of effective compatibilizers of a crystalline ... [https://www.sciencedirect.com/science/article/abs/pii/S0032386125003714]
- 66. From Waste to Function: Compatibilized r-PET/r-HDPE ... [https://www.mdpi.com/2073-4360/17/12/1638]
- 67. Electrostatic Compatibilization of Amorphous and ... [https://pubmed.ncbi.nlm.nih.gov/40576311/]
- 68. Advanced compatibilization for mixed plastic recycling [https://nsf.elsevierpure.com/en/projects/sttr-phaseadvanced-compatibilization-for-mixed-plastic-recycling/]
- 69. Janus nanosheets as compatibilizer for ternary blends [https://papers.ssrn.com/sol3/papers.cfm?abstract_id=5638080]
- 70. The Impact of Reprocessing with a Quad Screw Extruder ... [https://pmc.ncbi.nlm.nih.gov/articles/PMC9269424/]
- 71. Long term thermo-oxidative degradation and stabilization ... [https://www.sciencedirect.com/science/article/pii/S0141391023000125]
- 72. Degradation of Polypropylene and ... [https://www.mdpi.com/2073-4360/17/11/1509]
- 73. Effects of a Twin-Screw Extruder Equipped with a Molten ... [https://pmc.ncbi.nlm.nih.gov/articles/PMC8037719/]
- 74. Frontiers | Editorial: Biodegradable polymers for biomedical ... [https://www.frontiersin.org/journals/materials/articles/10.3389/fmats.2025.1551590/full]
- 75. How Bio Works — In One Simple Flow ( Polymers ) 2025 [https://www.linkedin.com/pulse/how-bio-polymers-works-one-simple-flow-2025-vep4e]
- 76. Recycling of medical plastics [https://www.sciencedirect.com/science/article/pii/S2542504821000348]
- 77. Recent advances and challenges in recycling and reusing ... [https://pmc.ncbi.nlm.nih.gov/articles/PMC9568467/]
- 78. Mechanical and Thermal Degradation-Related ... [https://www.mdpi.com/2073-4360/16/20/2863]
- 79. Polymer Characterization Technique Overview [https://measurlabs.com/blog/polymer-characterization-techniques/]
- 80. Educational series: characterizing crosslinked polymer networks [https://pubs.rsc.org/en/content/articlehtml/2024/py/d3py00914a]
- 81. Polymer Recycling: Degradation, Processing, Applications [https://www.mdpi.com/journal/polymers/special_issues/Polym_Recycl]
- 82. Hydrolytic Degradation and Erosion of Polyester Biomaterials [https://pmc.ncbi.nlm.nih.gov/articles/PMC6350899/]
- 83. A review of biomaterial degradation assessment ... [https://www.nature.com/articles/s41529-024-00487-1]
- 84. Thermal Degradation Kinetics of ZnO/polyester ... [https://www.mdpi.com/2073-4360/12/8/1753]
- 85. Circulatory Management of Polymer Waste: Recycling into ... [https://pmc.ncbi.nlm.nih.gov/articles/PMC8401388/]
- 86. In vivo and in vitro degradation and biological toxicity ... [https://www.sciencedirect.com/science/article/abs/pii/S0304389425011112]
- 87. Biological Testing Methods of Medical Devices [https://namsa.com/resources/blog/biological-testing-methods-of-medical-devices/]
- 88. Degradability of Polymers for Implantable Biomedical Devices [https://pmc.ncbi.nlm.nih.gov/articles/PMC2769140/]
- 89. Advanced Biocompatible and Biodegradable Polymers [https://pmc.ncbi.nlm.nih.gov/articles/PMC12611034/]
- 90. Plastic Energy Publishes New LCA [https://plasticenergy.com/plastic-energy-publishes-new-lca/]
- 91. A systematic review of plastic recycling - PubMed Central - NIH [https://pmc.ncbi.nlm.nih.gov/articles/PMC12301532/]
- 92. 7 key challenges in plastic recycling and how to solve them [https://www.stenarecycling.com/news-insights/insights-inspiration/guides-articles/7-challanges-for-plastic-recycling/]
- 93. 7 Solutions to Common Plastic Recycling Operation Problems [https://www.polystarco.com/blog-detail/7-solutions-to-common-plastic-recycling-operation-problems-a-stable-production-guide/]
- 94. 7 Solutions to Common Plastic Recycling Operation ... [https://www.extrusion-info.com/articles/4231]