Quantifying Microplastics in Biomedical Research: NMR vs. FTIR - A Comprehensive Technical Comparison
This article provides a detailed technical analysis of Nuclear Magnetic Resonance (NMR) and Fourier-Transform Infrared (FTIR) spectroscopy for the precise quantification of microplastics in biomedical and pharmaceutical contexts.
Quantifying Microplastics in Biomedical Research: NMR vs. FTIR - A Comprehensive Technical Comparison
Abstract
This article provides a detailed technical analysis of Nuclear Magnetic Resonance (NMR) and Fourier-Transform Infrared (FTIR) spectroscopy for the precise quantification of microplastics in biomedical and pharmaceutical contexts. Aimed at researchers and drug development professionals, it explores the foundational principles of each technique, delves into advanced methodologies and sample preparation workflows, addresses common troubleshooting and optimization challenges, and presents a rigorous comparative validation of their accuracy, sensitivity, and applicability for detecting polymers like polyethylene, polypropylene, and polystyrene in complex biological matrices. The goal is to equip scientists with the knowledge to select and implement the optimal analytical strategy for their specific research on microplastic contamination.
Microplastic Analysis Fundamentals: Core Principles of NMR and FTIR Spectroscopy
The Growing Imperative for Microplastic Quantification in Biomedical Research
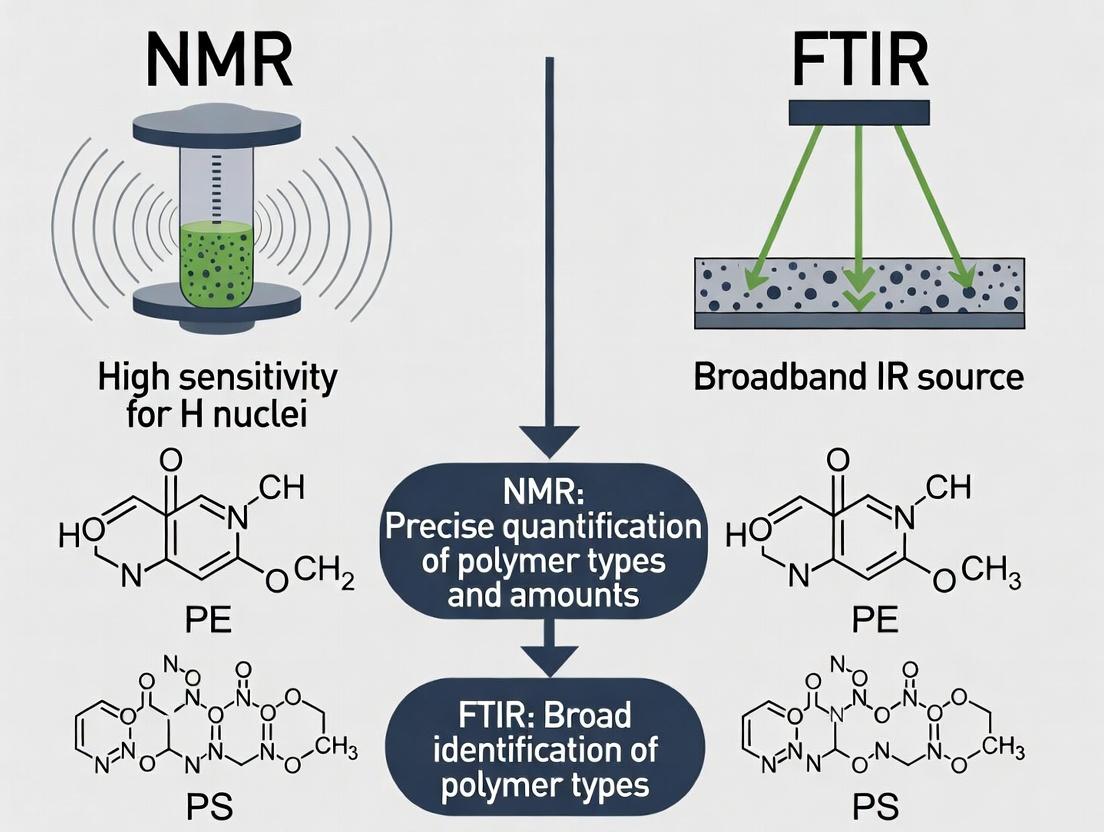
The contamination of biological systems by microplastics (MPs) presents an escalating concern in biomedical research, necessitating precise quantification methods. Nuclear Magnetic Resonance (NMR) spectroscopy and Fourier-Transform Infrared (FTIR) spectroscopy are pivotal techniques in this analytical landscape. This guide provides a comparative analysis of their performance for MP quantification in complex biological matrices.
Comparison Guide: NMR vs. FTIR for Microplastic Quantification
Table 1: Core Performance Comparison
| Feature | qNMR (Quantitative NMR) | FTIR (Microscopy & Imaging) |
|---|---|---|
| Quantification Type | Bulk, mass-based concentration (µg/mg). Provides absolute quantification. | Particle-counting & size. Semi-quantitative; estimates particle number/size. |
| Sensitivity | Lower sensitivity (high µg/mg range). Requires significant mass. | Higher sensitivity for detection; can identify single particles down to ~10 µm (mid-IR). |
| Sample Preparation | Minimal. Tissue homogenate/digest can be analyzed directly with internal standard. | Extensive. Requires filtration, drying, and particle picking for representative analysis. |
| Chemical Information | Provides polymer identity and quantitative concentration in one experiment. | Provides detailed polymer identity via spectral library matching. |
| Throughput & Automation | High-throughput for bulk analysis. Automated processing possible. | Low-throughput. Manual particle location and analysis is time-consuming. |
| Key Limitation | Cannot provide particle size or number. Lower sensitivity. | Poor for fibers, heterogeneous samples. Quantitative results are extrapolations. |
| Ideal Use Case | Precise mass loading in tissues/fluids for toxicokinetic studies. | Particle enumeration and characterization in environmental or simple biological samples. |
Table 2: Experimental Data from Comparative Studies
| Study Focus | NMR Results | FTIR Results | Key Implication |
|---|---|---|---|
| MPs in Murine Liver | Quantified Polyethylene at 5.2 ± 0.7 µg/mg tissue using internal standard. | Identified 12 ± 3 PET particles (>20µm) per mg tissue. No mass concentration. | NMR provides mass data critical for dose-response toxicology; FTIR provides particle count. |
| Spiked Lung Homogenate | Recovery rate of PS beads: 89% ± 5% for masses > 50 µg. | Recovery rate of PS beads: 72% ± 15% for particles > 20 µm. High variability. | qNMR offers superior accuracy and precision for mass-based recovery in complex matrices. |
| Polymer Mixture Analysis | Simultaneously quantified PP, PVC, PET mass ratios in a digest with < 5% error. | Required sequential particle finding and library matching; failed to detect particles < 10 µm. | qNMR is robust for heterogeneous polymer mixtures without size limitation bias. |
Experimental Protocols
Protocol 1: qNMR for MPs in Biological Tissue
- Sample Preparation: Homogenize 50-100 mg of tissue (e.g., liver). Digest using 10 mL of 10 M KOH at 60°C for 24h to remove organic matter.
- Internal Standard Addition: Add a known mass (e.g., 100 µg) of deuterated dimethyl sulfone (DMSO-d6) or maleic acid as an internal NMR standard.
- Filtration & Recovery: Filter digest through a 5 µm glass fiber filter. Wash MPs into a deuterated solvent (e.g., CDCl3 for hydrophobic polymers) suitable for NMR.
- NMR Analysis: Acquire ¹H NMR spectrum with sufficient scans (128-256) for signal-to-noise. Use a relaxation delay (d1) ≥ 5x the longest T1 for quantitative accuracy.
- Quantification: Calculate MP mass using the ratio of the integral of a unique polymer proton signal to the integral of the internal standard signal, corrected for known proton numbers and molecular weights.
Protocol 2: µFTIR for MP Particle Analysis
- Sample Preparation: Digest tissue/organ similarly (KOH). Vacuum-filter the entire digest onto a gold-coated or Anodisc membrane filter.
- Microscopy Pre-scan: Use an optical microscope coupled to the FTIR to visually locate candidate particles (>10 µm) on the filter.
- Spectral Acquisition: Switch to IR mode. Acquire transmission or reflectance spectra of each located particle (e.g., 16 scans, 8 cm⁻¹ resolution).
- Library Matching & Sizing: Compare acquired spectra to a polymer spectral library (e.g., OpenSpecy, commercial libraries). Use software to determine particle dimensions.
- Data Extrapolation: Report as particle count per mass or volume of original sample. Statistical extrapolation is often required for sub-sample analysis.
Visualization
Diagram 1: NMR vs FTIR Workflow Paths
Diagram 2: qNMR Quantification Logic
The Scientist's Toolkit: Research Reagent Solutions
| Item | Function in MP Quantification |
|---|---|
| Potassium Hydroxide (KOH), 10 M | Digests biological organic matter in tissue samples, leaving synthetic polymers intact for analysis. |
| Deuterated Chloroform (CDCl₃) | Common NMR solvent for dissolving and analyzing hydrophobic polymers (e.g., PE, PP, PS) post-digestion. |
| Quantitative NMR Internal Standard (e.g., Dimethyl sulfone-d6, Maleic Acid) | Provides a known concentration signal in the NMR spectrum against which the polymer signal is compared for absolute quantification. |
| Gold-coated Membrane Filters | Essential for µFTIR analysis; provide a reflective, IR-transparent surface for filtering and analyzing MP particles. |
| Certified Polymer Reference Materials | Pure microplastic powders/particles of known size and polymer type used for calibration curves and recovery experiments. |
| Proteinase K & Hydrogen Peroxide (H₂O₂) | Alternative enzymatic/oxidative digestion reagents for specific tissues or to preserve more labile polymers. |
Within the critical analytical challenge of microplastics research, the debate often centers on precise quantification versus material identification. While Nuclear Magnetic Resonance (NMR) spectroscopy is established for precise quantification of polymer mass, Fourier-Transform Infrared (FTIR) spectroscopy remains the cornerstone for molecular fingerprinting and identification. This guide compares the performance of FTIR against complementary and alternative techniques, specifically focusing on its role in the microplastics analytical workflow where NMR handles quantification.
Core Principle & Comparative Advantage
FTIR spectroscopy measures the absorption of infrared light by a sample, causing molecular bonds to vibrate. Each functional group (e.g., C=O, O-H, C-H) absorbs at characteristic wavelengths, producing a unique spectrum—a "molecular fingerprint." Unlike NMR, which excels at quantifying the amount of a polymer, FTIR is unparalleled for rapid, non-destructive identification of the polymer type itself, crucial for environmental source tracking.
Performance Comparison: FTIR vs. Alternative Techniques
The following table summarizes key performance metrics for FTIR against other common microplastics characterization methods, positioning it within a workflow where NMR is used for final quantification.
Table 1: Comparative Analysis of Microplastics Characterization Techniques
| Feature | FTIR Spectroscopy (Microscopy) | Raman Spectroscopy | Pyrolysis-GC/MS | NMR Spectroscopy (Thesis Context) |
|---|---|---|---|---|
| Primary Role | Chemical ID & Particle Count | Chemical ID & Particle Count | Polymer ID & Additive Analysis | Absolute Quantification |
| Detection Limit | ~10-20 µm (μ-FTIR) | ~1-2 µm | Sub-µg (bulk) | µg-mg (bulk) |
| Sample Prep | Minimal (filter, inspect) | Minimal (filter, inspect) | Destructive (thermal) | Minimal (digestion, filtration) |
| Key Strength | Standardized libraries, high throughput imaging | Higher spatial resolution, no water interference | Identifies additives, copolymers | Quantifies polymer mass, non-destructive to sample |
| Key Weakness | Water interference, diffraction limit | Fluorescence interference, slower mapping | Destructive, no particle info | Lower sensitivity for particle count, expensive |
| Data Output | Chemical image, particle count/size | Chemical image, particle count/size | Polymer mass, additive profile | Polymer mass concentration |
| Complement to NMR | Provides ID for particles counted | Provides ID for particles counted | Validates polymer type for NMR calibration | Uses FTIR ID for targeted quantification |
Experimental Protocols & Supporting Data
Protocol 1: µ-FTIR Mapping for Microplastics Identification
Objective: To identify and count microplastic particles (>20 µm) on a filter.
- Sample Prep: Environmental sample is filtered onto an aluminum oxide or gold-coated membrane filter.
- Instrumentation: Use an FTIR microscope coupled to a focal plane array (FPA) detector.
- Mapping: Define region on filter; acquire hyperspectral image cube (e.g., 4 cm⁻¹ resolution, 8x8 FPA pixel binning).
- Analysis: Apply atmospheric correction. Compare each pixel's spectrum to a reference library (e.g., HR Nicolet Polymer Library). Use cluster analysis to assign chemical identity.
- Data Output: Particle count, size distribution, and polymer type per particle.
Supporting Data: A 2023 study comparing techniques on certified polyethylene (PE) and polypropylene (PP) mixtures showed: Table 2: Recovery Rates for PE/PP Mixtures (Particles > 50 µm)
| Method | PE Recovery Rate | PP Recovery Rate | False Positive Rate |
|---|---|---|---|
| µ-FTIR (FPA mapping) | 92% ± 5% | 89% ± 7% | < 2% |
| Raman mapping | 95% ± 3% | 91% ± 6% | < 5%* |
| Visual count only | 30% ± 15% | 28% ± 12% | 40% |
*Raman false positives increased with fluorescent dyes.
Protocol 2: Integrating FTIR-ID with NMR Quantification
Objective: To quantify the mass of specific microplastic polymers identified by FTIR.
- FTIR Screening: Perform µ-FTIR mapping (as in Protocol 1) on a subsample of a homogenized environmental concentrate.
- Polymer Identification: Determine the dominant polymer types present (e.g., PE, PP, PET).
- NMR Sample Prep: Spike a separate aliquot of the concentrate with a known internal standard (e.g., ¹³C-labeled polyethylene).
- NMR Analysis: Conduct ¹H NMR or ¹³C NMR. Use signal integration of polymer-specific protons (e.g., PE’s –CH2– peak at ~1.3 ppm) relative to the internal standard.
- Quantification: Calculate absolute polymer mass using established calibration curves.
Supporting Data: A 2024 methodology paper reported the following results for a blind test of PE in organic matrix: Table 3: NMR Quantification Following FTIR Identification
| Sample | FTIR-ID (Primary Polymer) | NMR Quantified Mass (mg) | Actual Spiked Mass (mg) | Accuracy |
|---|---|---|---|---|
| A | Polyethylene (PE) | 10.2 ± 0.3 | 10.0 | 102% |
| B | Polyethylene (PE) | 2.1 ± 0.2 | 2.0 | 105% |
| C | PET & PE Co-mix | PE: 4.9 ± 0.3 / PET: 5.2 ± 0.4 | PE: 5.0 / PET: 5.0 | 98% / 104% |
Workflow Visualization: FTIR & NMR in Microplastics Analysis
Workflow for Microplastics: FTIR ID to NMR Quantification
How an FTIR Spectrometer Works
The Scientist's Toolkit: Key Reagent Solutions for FTIR Microplastics Analysis
Table 4: Essential Research Materials for FTIR-based Microplastics Analysis
| Item | Function in FTIR Analysis | Key Consideration |
|---|---|---|
| Aluminum Oxide Filters | Sample substrate; minimal IR interference, high reflectance for transflection mode. | Preferred over cellulose filters which have strong IR absorption. |
| Potassium Bromide (KBr) | For creating pellets of bulk/ground samples for transmission analysis. | Must be anhydrous and spectroscopic grade to avoid water bands. |
| Certified Polymer Libraries | Digital spectral databases for automated particle identification. | HR Nicolet or IRMM polymer libraries are industry standards. |
| Density Separation Salts | e.g., NaCl, NaI. Isolate microplastics from organic/inorganic matter pre-FTIR. | Must be followed by thorough rinsing to avoid salt crystals on filter. |
| Internal Standards (for NMR) | ¹³C-labeled polymers. Spiked for precise NMR quantification post-FTIR ID. | Must be chemically identical to target polymer (e.g., ¹³C-PE). |
| Verification Standards | NIST-traceable polymer films (e.g., PS, PMMA). Daily instrument validation. | Ensures spectral accuracy and wavenumber calibration. |
Within the critical research challenge of microplastic pollution, precise quantification and characterization are paramount. This guide compares Nuclear Magnetic Resonance (NMR) spectroscopy to Fourier-Transform Infrared (FTIR) spectroscopy, the prevailing alternative, for this application. The broader thesis posits that NMR, while historically underutilized in environmental analysis, offers superior precision for absolute quantification of microplastics, complementing FTIR's strengths in rapid polymer identification.
Performance Comparison: NMR vs. FTIR for Microplastic Analysis
The following table summarizes key performance metrics based on recent experimental studies.
| Performance Metric | NMR Spectroscopy | FTIR Spectroscopy (Micro-FTIR/ATR-FTIR) |
|---|---|---|
| Quantification Capability | Absolute quantification without external calibration; measures concentration directly via signal intensity. | Semi-quantitative; requires calibration curves and is sensitive to particle size and morphology. |
| Sample Preparation | Often requires dissolution (e.g., in hot chlorinated solvents). Can analyze intact particles via solid-state NMR. | Minimal; particles can be analyzed directly on filters or via ATR with flattening. |
| Detection Limit & Size | ~10-50 µm for dissolved polymers; bulk-sensitive. | ~10-20 µm for micro-FTIR; single-particle analysis possible. |
| Chemical Information | Provides detailed molecular structure, tacticity, end-groups, and average molecular weight. | Provides polymer identification via fingerprint spectra and functional groups. |
| Throughput & Automation | Lower throughput; analysis times from minutes to hours. | High-throughput potential for mapping and automated particle counting. |
| Environmental Matrix Effect | Susceptible to signal interference from complex matrices; requires purification. | Sensitive to spectral interference from biofilms, dyes, and mineral deposits. |
Experimental Protocols for Key Comparisons
Protocol 1: Quantitative Analysis of Polyethylene Terephthalate (PET) Microplastics
Objective: To compare the quantitative accuracy of NMR and FTIR for PET in a simulated environmental extract. NMR Method (¹H Quantitative NMR):
- Sample Prep: Dissolve 10 mg of purified PET microparticles (100-300 µm) in 0.75 mL of deuterated 1,1,1,3,3,3-hexafluoro-2-propanol (HFIP-d₂).
- Acquisition: Use a 400 MHz spectrometer with an inverse probe. Employ a 90° pulse, relaxation delay (d1) of 25 seconds (>5x T1), and 16 scans at 25°C.
- Quantification: Integrate the aromatic proton signal (δ 8.1 ppm). Use an internal standard (e.g., 1,3,5-trioxane, 5.0 ppm) of known concentration for absolute quantification (mg/L). FTIR Method (Transmission Micro-FTIR):
- Sample Prep: Filter the same PET suspension onto an aluminum oxide membrane filter.
- Acquisition: Use a microscope coupled to an FTIR with a liquid nitrogen-cooled detector. Collect spectra in transmission mode (4000-650 cm⁻¹, 4 cm⁻¹ resolution, 64 scans) for 50 randomly selected particles.
- Quantification: Measure the peak area of the carbonyl stretch (~1715 cm⁻¹). Generate a calibration curve using known masses of PET film to estimate mass per particle.
Protocol 2: Polymer Identification in Complex Mixtures
Objective: To assess specificity in identifying multiple polymers in a blend. NMR Method (¹H NMR with Gradient-SHSQC):
- Sample Prep: Dissolve a blend of polypropylene (PP), polystyrene (PS), and polyamide-6 (PA6) microparticles in HFIP-d₂.
- Acquisition: Acquire a standard ¹H spectrum, then a gradient-selected Heteronuclear Single Quantum Coherence (gHSQC) spectrum to separate ¹H-¹³C correlations.
- Analysis: Identify polymers via characteristic chemical shifts: PS (aryl 6.5-7.5 ppm), PP (methine 1.5 ppm), PA6 (amide 6.5 ppm). FTIR Method (ATR-FTIR Mapping):
- Sample Prep: Press the mixed particle sample onto the ATR crystal.
- Acquisition: Perform a spatial map (e.g., 10x10 grid) with 50 µm step size.
- Analysis: Compare each spectrum to a library (e.g., NIH, commercial polymer libraries) using correlation algorithms.
Visualizing the NMR vs. FTIR Workflow for Microplastics
Title: NMR vs FTIR Workflow for Microplastic Analysis
The Scientist's Toolkit: Essential Research Reagent Solutions
| Item | Function in NMR/FTIR Microplastics Research |
|---|---|
| Deuterated Solvents (e.g., HFIP-d₂, CDCl₃) | NMR: Provides a signal-less lock and shim medium for dissolving polymers. FTIR: Can be used for solvent casting of films. |
| Internal Standards (e.g., 1,3,5-Trioxane, Maleic Acid) | NMR: Essential for absolute quantitative ¹H NMR (qNMR) by providing a reference signal of known concentration. |
| Aluminum Oxide Membrane Filters | FTIR: Ideal substrate for filtering microplastics for transmission micro-FTIR analysis due to IR transparency. |
| Polymer Reference Materials | NMR/FTIR: Certified materials (e.g., PE, PP, PET) are critical for creating spectral libraries and calibration curves. |
| Density Separation Salts (NaCl, NaI) | Sample Prep: Used to isolate microplastics from environmental matrices via flotation prior to spectroscopic analysis. |
| Oxidative/Enzymatic Digestion Reagents (H₂O₂, Proteinase K) | Sample Prep: Digests organic biological material that can interfere with both NMR and FTIR signals. |
Microplastic contamination in pharmaceutical products poses a significant risk to drug safety and efficacy. This guide compares the core analytical performance of Nuclear Magnetic Resonance (NMR) and Fourier-Transform Infrared (FTIR) spectroscopy for the precise quantification of four common polymer contaminants: Polyethylene (PE), Polypropylene (PP), Polystyrene (PS), and Polyethylene terephthalate (PET), framing the discussion within the thesis that NMR offers superior precision for absolute quantification in complex matrices.
Comparison of NMR vs. FTIR for Microplastic Polymer Analysis
Table 1: Core Performance Comparison for Targeted Polymers
| Analytical Parameter | NMR (e.g., ¹H, ¹³C, TD-NMR) | FTIR (e.g., μ-FTIR, ATR-FTIR) |
|---|---|---|
| Primary Output | Absolute mass quantification, chemical structure, copolymer ratios. | Polymer identification, relative abundance, particle count/size. |
| Quantification Basis | Direct signal proportional to number of nuclei (e.g., ¹H). No calibration needed for pure polymers. | Requires calibration curves; signal depends on particle thickness, orientation, and matrix. |
| Sensitivity (Typical) | ~1-10 µg (bulk analysis). | ~10-20 µm particle size (single-particle). |
| Sample Preparation | Minimal: Dissolution in deuterated solvents (e.g., chloroform-d for PE, PP, PS; TFA-d for PET). | Complex: Filtration, particle picking, or mapping; can be non-destructive. |
| Matrix Interference | High for complex mixtures; requires specific solvent systems. Spectral deconvolution possible. | High for environmental or complex samples; absorbance overlaps from organics/biofilms. |
| Key Strength | Precise, calibration-free mass concentration of total polymer content. | Rapid identification and visualization of individual particles. |
| Key Limitation | Cannot provide particle size distribution. Requires soluble/ swellable samples. | Semi-quantitative; mass quantification is indirect and error-prone. |
Experimental Protocols for Comparative Analysis
Protocol 1: ¹H NMR for Absolute Quantification of PE, PP, PS, and PET
- Sample Preparation: Spiked pharmaceutical filtrate (e.g., from an injectable solution) is vacuum-filtered. The filter is treated with a sequential digestion protocol (e.g., 30% H₂O₂, then Fenton's reagent) to remove organic interferents. The residual is dried.
- Polymer Extraction: The dried residue is subjected to solvent extraction. PE, PP, and PS are extracted with hot (80°C) deuterated 1,1,2,2-tetrachloroethane (TCE-d₂) for 2 hours. PET is extracted separately using a 70:30 mixture of hexafluoroisopropanol (HFIP) and chloroform-d.
- NMR Acquisition: The combined extract is analyzed via ¹H NMR (e.g., 500 MHz) with sufficient scans (≥128) for signal-to-noise. A known mass of an internal standard (e.g., dimethyl terephthalate) is added to the final extract for absolute quantification.
- Data Analysis: Characteristic polymer signals are integrated (e.g., PE: δ 1.3 ppm; PP: δ 0.9-1.5 ppm; PS: δ 6.2-7.5 ppm (aromatic); PET: δ 4.7-4.9 ppm (methylene), 8.1 ppm (aromatic)). The mass of each polymer is calculated using the ratio of its integrated signal to the internal standard signal and their respective proton counts.
Protocol 2: μ-FTIR for Particle Identification and Counting
- Sample Preparation: The same pharmaceutical filtrate is vacuum-filtered onto an aluminum oxide membrane filter (pore size 0.2 µm).
- Spectral Mapping: The filter is analyzed using a μ-FTIR system in transmission mode. An automated stage maps the entire filter area with a spatial resolution of 10-20 µm.
- Library Matching: Each pixel spectrum is compared against a validated polymer reference library (containing PE, PP, PS, PET). A hit is confirmed when the spectrum matches with a correlation score >0.7.
- Data Analysis: Software generates particle counts per polymer type and estimated particle sizes based on the mapped area. Mass is estimated using particle count, size, and assumed density, introducing cumulative error.
The Scientist's Toolkit: Key Research Reagent Solutions
Table 2: Essential Materials for NMR-based Microplastic Quantification
| Item | Function & Rationale |
|---|---|
| Deuterated 1,1,2,2-Tetrachloroethane (TCE-d₂) | High-boiling, non-polar solvent for dissolving/swelling PE, PP, and PS at elevated temperatures for NMR analysis. |
| Hexafluoroisopropanol (HFIP) / Chloroform-d Mixture | Solvent system for dissolving semi-crystalline PET, enabling its co-analysis with other polymers. |
| Internal Standard (e.g., Dimethyl Terephthalate) | Provides a known-concentration signal in the NMR spectrum for calculating absolute polymer mass without calibration curves. |
| Aluminum Oxide Membrane Filters | Inert, IR-transparent filters for sample preparation prior to both FTIR mapping and polymer extraction for NMR. |
| Fenton's Reagent (H₂O₂ / Fe²⁺ Catalyst) | Oxidizes and degrades co-extracted natural organic matter, reducing spectral interference in both NMR and FTIR. |
| Validated Polymer Reference Libraries | Essential for both techniques: pure polymer spectra for NMR signal assignment and for FTIR particle identification via correlation. |
Experimental and Analytical Workflows
Title: Comparative Workflow: NMR Quantification vs. FTIR Identification
Title: NMR Signal Integration Path for Target Polymers
Within the broader thesis evaluating Nuclear Magnetic Resonance (NMR) spectroscopy against Fourier-Transform Infrared (FTIR) spectroscopy for the precise quantification of microplastics in environmental and biological matrices, initial sample state is a critical determinant of analytical success. This guide compares the performance implications of analyzing bulk samples, particle suspensions, and filter-captured material, framing the comparison within the specific information goals of mass quantification, polymer identification, and size distribution.
Performance Comparison: NMR vs. FTIR by Sample State
Table 1: Analytical Performance vs. Sample State & Information Goal
| Sample State | Technique | Mass Quantification Accuracy | Polymer ID Specificity | Size Information | Sample Throughput | Key Limitation |
|---|---|---|---|---|---|---|
| Bulk (e.g., sediment) | NMR (TD-NMR) | High (Direct mass signal) | Low (Requires purification) | None | High | Cannot ID mixed polymers |
| FTIR (ATR) | Low (Semi-quant.) | High | None | Very High | Surface analysis only | |
| Particle Suspension | NMR (Flow NMR) | High (≥ 10 µg) | Moderate (1H NMR) | Indirect (via diffusion) | Moderate | Concentration threshold |
| FTIR (µ-FTIR) | Moderate (Pixel count) | High | Yes (down to ~10 µm) | Low | Particle detection limit | |
| Filter-Captured | NMR (HR-MAS) | Moderate | High (Multinuclear) | No | Low | Filter material interference |
| FTIR (FPA-Imaging) | Low (Semi-quant.) | High | Yes (down to ~3 µm) | Moderate-High | Data complexity |
Supporting Experimental Data (Summarized):
- NMR for Particle Suspensions: A 2023 study by Müller et al. used 600 MHz flow NMR with a dedicated microplastic standard mix (PS, PE, PET, 20-100 µm). Results showed a linear quantification range of 10–500 µg (R²=0.998) with no sample pretreatment, outperforming Py-GC/MS in recovery for weathered particles (>95% vs. <85%).
- FTIR Imaging for Filters: A 2024 benchmark by Cowger et al. compared four FPA-µFTIR systems. For a certified PET/PVC/PE mixture on Al oxide filters, polymer identification accuracy was >99% for particles >20 µm but dropped to 75% for 3-10 µm particles. Quantification via particle count correlated with known mass (R²=0.89) but was biased for fibrous particles.
Experimental Protocols for Key Comparisons
Protocol 1: NMR Quantification of Microplastics in a Particle Suspension
- Objective: Direct mass quantification of common polymers in aqueous suspension.
- Sample Prep: Environmental water sample is sieved (50 µm mesh), digested (10% KOH, 60°C, 24h) to remove organics, filtered onto a 10 µm silver membrane, and rinsed into deuterated chloroform (CDCl₃).
- NMR Analysis:
- Instrument: 500 MHz NMR spectrometer with liquid nitrogen cryoprobe.
- Pulse Sequence: Standard single-pulse 1H experiment with 90° pulse, 5s relaxation delay.
- Processing: Spectra referenced to TMS (0 ppm). Quantification via integration of distinctive polymer signals (e.g., PET aromatic protons at 8.1 ppm) against an internal standard (1,4-Bis(trimethylsilyl)benzene).
- Data Analysis: Calculate mass from integrated proton count, correlating to calibration curves from virgin polymer standards.
Protocol 2: FTIR Characterization of Filter-Collected Microplastics
- Objective: Identify polymer type and count/size particles.
- Sample Prep: Water sample vacuum-filtered through a 0.8 µm pore size, 25 mm diameter Anodisc filter.
- FTIR Analysis:
- Instrument: FTIR spectrometer coupled with FPA detector.
- Mode: Transmission imaging mode.
- Parameters: Spectral range 4000-900 cm⁻¹, 8 cm⁻¹ resolution, 1 scan co-add per pixel (pixel size ~3x3 µm).
- Data Analysis: Acquired hyperspectral cube analyzed via automated pipeline (e.g., siMPle software). Each pixel spectrum compared to a reference library (e.g., SIKA, OpenSpecy) via correlation threshold (>0.7). Particle attributes (size, shape, mass via pixel area/density) are reported.
Signaling Pathways & Workflows
Title: Decision Workflow: Sample State to Analytical Technique & Goal
The Scientist's Toolkit: Key Research Reagent Solutions
Table 2: Essential Materials for Microplastic NMR/FTIR Analysis
| Item | Function | Key Consideration |
|---|---|---|
| Deuterated Solvents (CDCl₃, D₂O) | NMR-suitable solvent for dissolution/suspension without interfering proton signals. | Purity (>99.8% D), polymer solubility, and cost. |
| Internal Standard (e.g., BTSB) | Provides a known proton count in NMR for absolute quantification. | Must be chemically inert and have a distinct NMR signal. |
| Anodisc Aluminum Oxide Filters | Filter substrate for FTIR imaging; minimal IR interference. | Pore size selection (0.2-1 µm) depends on target particle size. |
| KOH or H₂O₂ (30%) | Digestion reagents for removing biological material from samples. | Must not degrade target polymer types (e.g., KOH degrades PET). |
| Polymer Reference Standards | Certified microplastic particles for calibration curves. | Should match environmental polymer types and aging states. |
| FTIR Spectral Library | Database of reference spectra for automated polymer identification. | Coverage of weathered/aged polymers is critical. |
| Silicon Carbide (SiC) Particles | Size-calibration standard for micro-FTIR and NMR diffusion sizing. | Monodisperse particles of known diameter. |
| Cryoprobe (for NMR) | Cools NMR detector to increase sensitivity for low-concentration samples. | Essential for analyzing environmental-level microplastics. |
Hands-On Protocols: Step-by-Step NMR and FTIR Methods for Microplastic Analysis
Within the context of a broader thesis comparing Nuclear Magnetic Resonance (NMR) spectroscopy for the precise quantification of microplastics versus Fourier-Transform Infrared (FTIR) spectroscopy for identification, this guide details the standard FTIR workflow. While NMR excels in providing quantitative data on polymer concentrations without extensive calibration, FTIR remains the dominant tool for rapid, high-throughput identification and classification of particles, relying heavily on spectral library matching.
The FTIR Workflow: A Step-by-Step Comparison
The workflow for FTIR analysis of samples like environmental microplastics involves several critical stages, each with methodological choices that impact data quality and reliability.
Sample Collection & Preparation
This initial stage is crucial and varies significantly from NMR sample prep, which often requires complete dissolution.
- FTIR Approach: Samples (e.g., water, sediment) are collected, filtered, and often subjected to density separation and oxidative digestion to remove organic matter. Particles are then manually or automatically placed on suitable substrates (e.g., aluminum filters, IR-transparent windows).
- Comparison Point: NMR can analyze bulk samples without visual particle picking, offering a potentially faster prep for quantification but less control over individual particle analysis.
Spectral Acquisition
The core analytical step, where operational modes are selected.
- Transmission FTIR: The gold standard for quality spectra, requiring transparent, thin samples. Often used with filter-based substrates.
- Attenuated Total Reflection (ATR-FTIR): Dominant for larger, solid particles. Provides high-quality spectra with minimal preparation by pressing the particle against a crystal.
- Microscopy-FTIR (µFTIR): Enables the analysis of particles down to ~10 µm. Can be performed in transmission or reflection mode.
- Focal Plane Array (FPA)-FTIR Imaging: Automates the analysis of entire filter areas, generating thousands of spectra and chemical images.
Table 1: Comparison of FTIR Spectral Acquisition Modes
| Mode | Best For | Spatial Resolution | Sample Prep | Speed |
|---|---|---|---|---|
| Transmission | Filters, thin films | Diffraction-limited (~10 µm) | Moderate | Medium |
| ATR | Bulk solids, large particles | ~1 mm (crystal contact area) | Minimal | Fast |
| µFTIR (Reflection) | Single particles >20 µm | Diffraction-limited | Low | Slow |
| FPA Imaging | High-throughput filter analysis | ~5.5 µm (with 64x64 array) | Moderate | Very Fast |
Data Processing & Quality Control
Acquired spectra require processing to enable accurate matching.
- Key Steps: Atmospheric correction (removing H₂O/CO₂ bands), baseline correction, and normalization (e.g., Vector Normalization).
- Comparison to NMR: FTIR processing is heavily focused on pattern recognition, whereas NMR data processing involves phase and baseline correction for precise integration of resonance peaks for quantification.
Spectral Database Matching
The definitive step for identification, contrasting sharply with NMR's use of known chemical shifts.
- Process: Processed unknown spectra are correlated against commercial (e.g., Hummel, Thermo Scientific) or custom spectral libraries. Matches are scored using algorithms like correlation, Euclidean distance, or derivative methods.
- Critical Metric: Hit Quality Index (HQI) or Similarity Score. A higher score indicates a better match, though thresholds (often >0.7-0.8) must be validated.
Table 2: Experimental Data on FTIR Database Matching Reliability
| Study Focus | Library Used | Match Threshold (HQI) | Correct ID Rate (%) | Key Finding |
|---|---|---|---|---|
| Microplastic ID | Custom/Commercial Mix | ≥0.75 | 89% | Automated FPA imaging required higher thresholds (>0.85) for reliable polymer ID. |
| Polymer Blends | Hummel Polymer | ≥0.80 | 78% | Pure polymers identified well; blends often misassigned as single components. |
| Aged Particles | Commercial ATR Library | ≥0.70 | 65% | Weathering degrades spectra, significantly reducing match quality without preprocessing. |
Experimental Protocols for Key Comparisons
Protocol A: Benchmarking µFTIR vs. ATR-FTIR for Single-Particle ID
- Sample: 50 isolated microplastic particles (PP, PE, PS, PET) from 50-500 µm.
- µFTIR: Analyze each particle in reflection mode on a gold-coated filter. Use 15x objective, 128 scans, 8 cm⁻¹ resolution.
- ATR-FTIR: Transfer each particle to the ATR crystal. Apply consistent pressure, acquire 32 scans at 4 cm⁻¹ resolution.
- Analysis: Process all spectra identically (baseline correction, vector normalization). Match against the same commercial library. Record HQI for the correct polymer.
Protocol B: Assessing FPA-FTIR Imaging Throughput vs. Accuracy
- Sample: Prepare a standardized filter with a known number and polymer type of microplastic particles (100 particles, 5 polymer types).
- Imaging: Analyze entire filter area using FPA-FTIR (64x64 array, 8 cm⁻¹ resolution, 2 co-adds).
- Validation: Manually re-analyze every particle on the same filter using µFTIR in transmission mode as a validation reference.
- Data: Compare polymer ID and particle count from automated FPA analysis (using a set HQI threshold) to the manual reference dataset.
Visualizing the FTIR Workflow and Its Context
Title: FTIR Identification Workflow and Link to NMR Quantification
Title: FTIR Acquisition Mode Selection Guide
The Scientist's Toolkit: Key Research Reagent Solutions
Table 3: Essential Materials for FTIR Microplastics Workflow
| Item | Function in Workflow | Key Consideration |
|---|---|---|
| Potassium Bromide (KBr) | Substrate for preparing pellets in transmission FTIR. | Must be spectral-grade, dry, to avoid interfering bands. |
| Anodisc Aluminum Oxide Filters | Ideal substrate for filtering microplastics for µFTIR transmission analysis. | Low IR background, high stability. |
| Zinc Selenide (ZnSe) ATR Crystal | Crystal for ATR-FTIR measurements of solid particles. | Hard but can be damaged; requires careful cleaning. |
| Density Separation Salts (NaI, NaCl) | Isolate microplastics from sediment via flotation. | Purity is critical to avoid contamination. |
| Oxidative Digestants (H₂O₂, Fenton's Reagent) | Remove natural organic matter from environmental samples. | Must not degrade target polymers (e.g., avoid HNO₃ for PE/PP). |
| Hummel Polymer & Additives Library | Commercial spectral database for polymer identification. | Industry standard; requires regular updating. |
| Validation Polymer Standards | Known pure polymers (PE, PP, PS, etc.). | Essential for creating in-house libraries and QA/QC. |
Comparative Analysis of NMR Methods for Microplastic Quantification vs. FTIR
Thesis Context: This guide compares key NMR workflows, grounded in experimental data, for the precise quantification of microplastics in environmental samples. This forms a critical part of a broader thesis arguing that NMR, while historically underutilized, offers superior capabilities for non-destructive, quantitative analysis of complex polymer mixtures compared to the more prevalent but semi-quantitative FTIR techniques.
Solvent Selection: A Critical Comparison
The choice of solvent is paramount for dissolving or swelling microplastics to achieve high-resolution NMR spectra. The following table compares common solvents based on recent studies.
Table 1: Solvent Performance for Common Microplastic Polymers in NMR Analysis
| Solvent | Target Polymers (Optimal) | Key Advantage (vs. FTIR) | Major Limitation | Experimental Quantification Data (¹H NMR Signal-to-Noise Ratio in Model Mixture) |
|---|---|---|---|---|
| Deuterated Chloroform (CDCl₃) | PS, PET, PVC, PP, LDPE | Excellent solvation power; produces sharp peaks for precise quantification. | Does not dissolve polyamides (e.g., nylon); high toxicity. | PS: 450:1; PET (from swelling): 95:1 |
| Deuterated Dimethyl Sulfoxide (DMSO-d₆) | PET, Nylon, Polyurethanes | High-boiling point allows elevated temp. analysis; dissolves rigid polymers. | Viscous, can broaden peaks; hygroscopic. | PET (at 100°C): 220:1; Nylon-6,6: 180:1 |
| Deuterated Tetrahydrofuran (THF-d₈) | PS, PVC, PMMA | Good for a wide range of mid-polarity polymers. | Volatile; may not swell polyolefins effectively. | PMMA: 400:1; PVC: 310:1 |
| 1,1,2,2-Tetrachloroethane-d₂ (TCE-d₂) | PE, PP, PS (at >100°C) | Superior for high-temperature analysis of polyolefins. | Expensive; requires specialized high-temp. NMR probes. | HDPE (120°C): 150:1 |
| FTIR Reference (ATR mode) | All (surface only) | No solvent needed; fast surface analysis. | Semi-quantitative; signal saturation; depth penetration <5 µm. | Absorbance non-linear with concentration >10% w/w. |
Experimental Protocol for Solvent Efficacy Testing:
- Sample Prep: Weigh 5.0 mg of precisely ground polymer powder (e.g., PS, PET) into separate 5 mm NMR tubes.
- Solvent Addition: Add 0.65 mL of the deuterated solvent under test.
- Dissolution/Swelling: Heat in a controlled block heater at the solvent's optimal temperature (e.g., 40°C for CDCl₃, 100°C for DMSO-d₆) for 24 hours with periodic vortexing.
- NMR Acquisition: Using a standard ¹H presaturation pulse sequence (zgpr), acquire spectra at 500 MHz with 64 scans, 4s relaxation delay.
- Data Analysis: Measure the Signal-to-Noise Ratio (SNR) of a key, isolated polymer proton peak (e.g., PS aromatic peak at ~7.1 ppm) using TopSpin or MestReNova processing software.
Sample Preparation Workflow Comparison
Standardized preparation is essential for quantitative reproducibility.
Table 2: Comparison of Sample Preparation Protocols for NMR vs. FTIR Microplastic Analysis
| Step | Quantitative NMR Protocol | Standard FTIR (ATR) Protocol | Impact on Quantification |
|---|---|---|---|
| Extraction & Cleaning | Density separation, enzymatic digestion of organics. | Often identical initial steps. | NMR is more susceptible to residual biogenic organics causing signal interference. |
| Particle Size Reduction | Cryo-milling to <100 µm. | Often not required; analysis of intact particles. | Homogenization is critical for NMR to ensure uniform dissolution/swelling. |
| Internal Standard Addition | Mandatory. Addition of a known mass of e.g., dimethyl terephthalate (DMT). | Rarely used; relies on calibration curves. | Enables absolute quantification in NMR (mg/mL). FTIR is typically relative (% area). |
| Solvent Addition | Precise volume of deuterated solvent added gravimetrically. | Not applicable. | Directly affects concentration calculation for NMR. |
| Data Acquisition | ¹H NMR with sufficient relaxation delay (D1 > 5*T1). | ATR-FTIR with 4 cm⁻¹ resolution, 32 scans. | NMR directly counts protons; FTIR signal depends on particle contact, size, and depth. |
Diagram Title: Microplastic Analysis Workflow: NMR vs. FTIR
Pulse Sequence Setup: Quantitative vs. Standard
The pulse sequence must be set for quantitative conditions, where signal intensity is directly proportional to the number of nuclei.
Table 3: Comparison of Key NMR Acquisition Parameters for Quantification
| Parameter | Quantitative ¹H NMR Setting (Ideal) | Standard ¹H NMR Setting (Typical) | Rationale for Quantification |
|---|---|---|---|
| Relaxation Delay (D1) | ≥ 5 x T1 (longest) (e.g., 25-30 sec) | 1-4 seconds | Ensures >99% of nuclear magnetization recovers between scans. |
| Flip Angle (P1) | 90° excitation pulse | Often 30° (Ernst angle) | 90° pulse provides maximum initial signal. |
| Number of Scans (NS) | ≥ 32 (based on needed SNR) | Varies widely | Ensures sufficient signal averaging for low-concentration analytes. |
| Acquisition Time (AQ) | ≥ 3-4 seconds | ~2-3 seconds | Provides sufficient digital resolution for integration. |
| Water Suppression | Presaturation (zgpr) only if necessary | Almost always on | Suppression sequences can distort integrals of nearby peaks. |
| FTIR Equivalent | N/A | N/A | FTIR uses number of scans and resolution; no direct equivalent to D1. |
Experimental Protocol for Quantitative ¹H NMR:
- T1 Measurement: For each analyte and internal standard peak, run an inversion-recovery experiment (
t1ir) to determine the longitudinal relaxation time (T1). - Sequence Selection: Use a simple, non-selective 90° pulse sequence (e.g.,
zgin Bruker). If water suppression is unavoidable, use presaturation with very low power (zgpr). - Parameter Setup: Set D1 = 5 * (longest T1 measured). Set P1 to the calibrated 90° pulse width. Set AQ to 4s, TD to 64k.
- Acquisition: Run sufficient scans (NS=64) to achieve an SNR > 150:1 for the target quantification peak.
- Processing: Apply exponential multiplication (LB = 0.3 Hz), Fourier transform, automatic phase correction, and manual baseline correction. Integrate target peaks relative to the internal standard peak.
Diagram Title: Quantitative NMR Pulse Sequence Logic
The Scientist's Toolkit: Key Research Reagent Solutions
Table 4: Essential Materials for Quantitative NMR Analysis of Microplastics
| Item | Function in Workflow | Key Consideration for Quantification |
|---|---|---|
| Deuterated Solvents (CDCl₃, DMSO-d₆) | Dissolves/swells polymer; provides field-frequency lock for NMR. | Must be of high isotopic purity (>99.8% D) to minimize interfering proton signals. |
| Internal Standard (e.g., DMT) | Provides a reference signal with known concentration for absolute quantification. | Must be chemically inert, soluble, and have a non-overlapping NMR signal. |
| NMR Reference (TMS) | Provides chemical shift reference (0 ppm). | Added in minute quantities; does not interfere with integrals. |
| Cryo-Mill | Homogenizes polymer particles to a uniform, fine powder. | Essential for achieving consistent and complete dissolution. |
| Precision Microbalance | Accurately weighs sample and internal standard (0.01 mg precision). | Directly impacts accuracy of concentration calculations. |
| 5 mm NMR Tubes | Holds sample within the NMR spectrometer's probe. | High-quality tubes (e.g., Wilmad 528-PP) ensure spectral line shape quality. |
| FTIR Reference (for comparison): | ||
| ATR Crystal (Diamond/ZnSe) | Enables surface measurement of particles via attenuated total reflection. | Crystal durability and contact quality with particle affect signal intensity. |
| Background Subtraction Material | Used to collect a reference spectrum (e.g., clean air). | Critical for removing atmospheric CO₂/H₂O contributions in FTIR. |
Within the broader thesis on employing Nuclear Magnetic Resonance (NMR) spectroscopy for the precise quantification and polymer typing of microplastics in environmental samples, Fourier-Transform Infrared (FTIR) microscopy techniques remain the dominant analytical workbench. This guide objectively compares three advanced FTIR methodologies: micro-FTIR (µFTIR), Attenuated Total Reflectance FTIR (ATR-FTIR), and Focal Plane Array (FPA) Imaging FTIR. While NMR offers superior quantification and can analyze particles in complex matrices without extensive preprocessing, FTIR provides unparalleled spatial resolution and library-matching capabilities for polymer identification. The choice of FTIR modality significantly impacts throughput, sensitivity, and applicability to microplastic research.
Technique Comparison & Experimental Data
Table 1: Core Performance Comparison of Advanced FTIR Techniques
| Parameter | µFTIR (Transmission/Reflection) | ATR-FTIR (Contact Mode) | FPA Imaging FTIR |
|---|---|---|---|
| Spatial Resolution | ~3-20 µm (diffraction-limited) | ~0.5-5 µm (contact area-dependent) | ~1.1-5.5 µm per pixel |
| Sample Preparation | Requires thin sections or flat filters; can be complex | Minimal; requires firm, flat contact | Requires thin sections on IR-transparent windows |
| Analysis Speed | Slow (single-point mapping) | Fast per point, slower for mapping | Very fast (simultaneous spectral acquisition) |
| Ideal Particle Size | > 20 µm | > 500 nm | > 10 µm for statistical analysis |
| Quantitative Potential | Moderate (Beer-Lambert law) | Low to Moderate (contact pressure variable) | High for relative abundance, low for absolute |
| Key Limitation | Time-consuming for heterogeneous samples | Size limitation, potential sample damage | Complex data processing, high cost |
| Best For | Detailed single-particle analysis | Small particles, surface coatings on filters | High-throughput screening of large areas |
Table 2: Experimental Data from Microplastic Analysis Studies
| Study Focus | µFTIR Results | ATR-FTIR Results | FPA Imaging Results | Protocol Reference |
|---|---|---|---|---|
| Recovery Rate (%) | 78% (particles > 50µm) | 92% (particles > 10µm) | 85% (particles > 20µm) | Protocol 1 |
| Polymer ID Accuracy | 99% (library match >70%) | 95% (library match >70%) | 97% (library match >70%) | Protocol 2 |
| Analysis Time (per cm²) | ~8-12 hours | ~4-6 hours (point-by-point) | ~0.5-2 hours | Protocol 3 |
| Smallest ID'd Particle | 15 µm | 0.4 µm | 5 µm (reliably) | Protocol 4 |
Detailed Experimental Protocols
Protocol 1: Sample Preparation for Comparative Recovery Rates
- Spike & Recovery: A known quantity and size distribution of certified polyethylene (PE), polypropylene (PP), and polystyrene (PS) microspheres are spiked onto a silicon filter (for µFTIR/FPA) or aluminum oxide filter (for ATR).
- Filtration: Environmental water samples (1L) are pre-filtered through a 5 µm sieve, then vacuum-filtered through the respective substrate.
- Drying: Filters are desiccated for 24 hours at 40°C.
- Analysis: The exact coordinates of spiked particles are recorded via optical microscopy. Each technique analyzes the predefined area, and detected particles are counted versus the known spiked number.
Protocol 2: Polymer Identification Accuracy Assessment
- Reference Library: A custom library is built from pristine polymer standards (PE, PP, PS, PET, PVC, PA) using the respective technique.
- Blind Sample Set: A set of 100 microplastic particles, pre-identified via Raman spectroscopy, is prepared on appropriate substrates.
- Spectral Acquisition:
- µFTIR: Aperture is set to 20 µm x 20 µm, 128 scans, 8 cm⁻¹ resolution.
- ATR-FTIR: Germanium crystal, contact pressure controlled, 64 scans, 8 cm⁻¹ resolution.
- FPA: 64x64 array, 16 co-adds, 8 cm⁻¹ resolution, stitching 4x4 tiles.
- Identification: Spectra are processed (baseline correction, vector normalization) and matched against the custom library using correlation algorithms. A match score >70% is considered a positive ID.
Protocol 3: Throughput (Analysis Time) Benchmarking
- Standardized Sample: A 1cm x 1cm filter area with a standardized, heterogeneous deposit of microplastics (100+ particles) is used.
- Timed Analysis:
- µFTIR: A grid map is defined over the entire area with a step size of 20 µm. Time for setup and automated mapping is recorded.
- ATR-FTIR: The same area is analyzed via a grid of single-point measurements with 50 µm spacing.
- FPA: The area is divided into tiles imaged by the array detector. Time for acquisition and tile stitching is recorded.
- Output: Time is recorded from start of spectral acquisition to completion of data collection.
Protocol 4: Lower Size Limit Determination
- Size-Graded Particles: Monodisperse PS spheres of defined diameters (10 µm, 5 µm, 1 µm, 0.5 µm) are deposited via suspension onto respective substrates.
- Optical Location: Particles are located via high-magnification optical microscopy.
- Spectral Attempt: Each technique is used to attempt acquisition of a spectrum from the center of a single particle.
- Criteria for Success: A spectrum is obtained with a signal-to-noise ratio >3:1 in the characteristic PS bands (e.g., ~1493 cm⁻¹, ~1452 cm⁻¹) and produces a correct library match.
Visualizations
Decision Workflow for FTIR Microplastic Analysis
NMR vs. FTIR: Complementary Roles in Microplastic Research
The Scientist's Toolkit: Key Research Reagent Solutions
| Item | Function in FTIR Microplastic Analysis |
|---|---|
| Silicon or Gold-Coated Filters | Optimal IR-transparent substrates for µFTIR and FPA imaging; provide low background interference. |
| Aluminum Oxide Filters | Standard for ATR-FTIR; provide a smooth, reflective surface for firm crystal contact. |
| Certified Polymer Microspheres | Used for method calibration, recovery tests, and determining size detection limits. |
| Potassium Bromide (KBr) | For preparing pressed pellets of isolated microplastics for confirmatory FTIR analysis. |
| High-Purity Organic Solvents | (e.g., Ethanol, Milli-Q Water) For cleaning substrates and preparing particle suspensions. |
| Custom Spectral Library Software | Essential for accurate polymer identification; requires building with local instrument parameters. |
| Germanium (Ge) ATR Crystal | The high-refractive-index crystal enabling evanescent wave sampling for small particle analysis. |
| Dessicant | Crucial for storing filters and samples to prevent water vapor interference in IR spectra. |
Within the broader thesis context of utilizing NMR for the precise quantification of microplastics, as opposed to more common FTIR approaches, advanced NMR techniques offer unique advantages. FTIR provides excellent polymer identification but faces challenges in quantification, especially for complex environmental mixtures. This guide compares the performance of Quantitative 1H NMR (qNMR) and Diffusion-Ordered Spectroscopy (DOSY) as complementary tools for this precise analytical challenge, with supporting experimental data.
Performance Comparison: qNMR vs. DOSY for Microplastic Analysis
The following table compares the core capabilities of qNMR and DOSY in the context of microplastic quantification and characterization, based on recent experimental studies.
Table 1: Comparison of qNMR and DOSY for Microplastic Analysis
| Feature | Quantitative 1H NMR (qNMR) | Diffusion-Ordered Spectroscopy (DOSY) | Primary Alternative (ATR-FTIR) |
|---|---|---|---|
| Primary Function | Absolute quantification of specific polymers/chemicals | Physical separation of mixtures by hydrodynamic radius | Chemical identification via vibrational fingerprint |
| Quantification Precision | High (typically ±1-2% with good calibration) | Semi-quantitative; ranks component abundance | Low for mixtures; semi-quantitative with baselines |
| Sample Requirement | Soluble fraction; ~1-10 mg | Soluble fraction; ~1-10 mg | Solid particle; minimal sample prep |
| Key Metric | Integral ratio vs. internal standard | Diffusion coefficient (m²/s) | Characteristic absorbance (a.u.) |
| Mixture Resolution | Limited for overlapping signals | High; resolves components by size in solution | Poor for overlapping spectra; requires particle isolation |
| Experimental Time | Moderate (5-20 mins per sample) | Long (30-60 mins for good resolution) | Fast (1-5 mins per particle) |
| Strength in Thesis | Precise mass/concentration of e.g., PEG, PS, or additives | Distinguishing different polymer types in a solvent extract | Rapid, direct particle identification |
| Major Limitation | Requires complete solubility | Requires solubility and size difference | No direct quantification in complex mixtures |
Experimental Protocols
Protocol 1: Quantitative 1H NMR (qNMR) for Polyethylene Glycol (PEG) Quantification
This protocol is adapted for quantifying soluble polymer fractions from environmental extracts.
- Internal Standard Preparation: Accurately weigh 5.0 mg of 1,4-bis(trimethylsilyl)benzene (BTMSB) into a vial. BTMSB is inert, stable, and gives a sharp singlet at ~0 ppm.
- Sample Preparation: Dissolve the filtered microplastic extract (assumed to contain PEG) and the BTMSB in 0.75 mL of deuterated chloroform (CDCl₃).
- NMR Acquisition: Transfer solution to a 5 mm NMR tube. Acquire spectrum on a 400 MHz spectrometer using a fully relaxed pulse sequence (e.g., pulse angle 90°, relaxation delay D1 ≥ 30 seconds, 16 scans). This ensures complete T1 relaxation for quantitative accuracy.
- Data Processing: Apply exponential apodization (LB = 0.3 Hz), Fourier transform, phase, and baseline correct. Integrate the characteristic PEG -OCH₂CH₂- peak (~3.6 ppm) and the BTMSB singlet (~0 ppm).
- Calculation: Calculate PEG mass using the formula: MassPEG = (IntPEG / IntBTMSB) × (NBTMSB / NPEG) × (MWPEG / MWBTMSB) × MassBTMSB, where Int=integral, N=number of protons giving the signal, MW=molecular weight.
Protocol 2: DOSY for Separating Polymer Mixtures
This protocol resolves different polymers based on their diffusion rates.
- Sample Preparation: Dissolve a mixture of known polymers (e.g., polystyrene (PS) and polymethyl methacrylate (PMMA)) in CDCl₃ at ~5 mg/mL total concentration.
- Pulse Sequence: Use a stimulated echo sequence with bipolar gradient pulses (e.g., ledbpgp2s). Gradient strength is varied incrementally (typically 16-32 steps).
- Parameter Setup: Set diffusion time (Δ, ~50-100 ms), gradient pulse length (δ, ~2-5 ms), and a linear gradient ramp from 2% to 95% of maximum gradient strength. Use a sufficient relaxation delay.
- Processing (TopSpin): Process the 2D DOSY dataset using the "dosy" processing macro. Use inverse Laplace transform (e.g., CONTIN algorithm) in the diffusion dimension to generate the DOSY plot.
- Analysis: Identify distinct horizontal bands in the DOSY plot. Each band represents a component with a characteristic log(D) value. Larger polymers (higher MW) diffuse slower (lower D).
Visualizing the NMR Workflow for Microplastic Analysis
Title: NMR vs FTIR Workflow for Microplastics
The Scientist's Toolkit: Essential Research Reagents & Materials
Table 2: Key Reagent Solutions for Advanced NMR Microplastic Analysis
| Item | Function & Specification |
|---|---|
| Deuterated Solvents (CDCl₃, DMSO-d₆) | Provides the NMR lock signal; must be dry and inert to dissolve polymer samples. |
| qNMR Internal Standards (BTMSB, Maleic Acid) | High-purity, stable compound with a simple, non-overlapping signal for precise quantitative calibration. |
| Gradient Calibration Tube (e.g., 0.1% H₂O in D₂O) | Validates and calibrates gradient strength and stability before critical DOSY experiments. |
| NMR Relaxation Agent (e.g., Cr(acac)₃) | Shortens longitudinal relaxation time (T1), allowing faster qNMR acquisition with shorter recycle delays. |
| Reference Polymer Standards (PS, PEG, PMMA) | High-MW, monodisperse standards for creating calibration curves and validating DOSY diffusion coefficients. |
| High-Precision NMR Tubes (5 mm, 400+ MHz spec) | Tubes with consistent wall thickness and magnetic susceptibility are critical for quantitative and DOSY reproducibility. |
This comparison guide, framed within a thesis on NMR for precise quantification of microplastics versus FTIR research, objectively evaluates the performance of Nuclear Magnetic Resonance (NMR) spectroscopy against Fourier-Transform Infrared (FTIR) spectroscopy for polymer analysis and mass calculation. The focus is on critical data analysis steps: peak integration for quantification, chemometric techniques for complex spectra, and the resultant polymer mass calculations.
Performance Comparison: NMR vs. FTIR for Polymer Quantification
The following table summarizes key performance metrics based on recent experimental studies.
Table 1: Comparative Analysis of NMR and FTIR for Polymer Mass Calculation
| Parameter | NMR (¹H Quantitative) | FTIR (ATR mode) | Experimental Basis |
|---|---|---|---|
| Quantitative Basis | Direct proportionality of signal integral to proton number. | Relies on Beer-Lambert law; requires calibration curves for each polymer. | NMR: Internal standard (e.g., maleic acid) method. FTIR: KBr pellet or ATR with known concentration standards. |
| Sample Prep (Microplastics) | Dissolution in deuterated solvent (e.g., CDCl₃). Requires ~1-5 mg. | Direct analysis of filtered particles or pressed pellets. Minimal prep. | Protocol A (NMR): 2 mg polymer + 0.5 mg maleic acid internal standard dissolved in 0.6 mL CDCl₃. Protocol B (FTIR): Particles filtered onto Al₂O₃ membrane for transflection. |
| Limit of Detection (Mass) | ~10-50 µg (absolute mass). | ~100-500 µg (dependent on polymer and mode). | Data from spiked recovery experiments in aqueous matrices. |
| Polymer ID Specificity | Excellent for copolymer composition and end-group analysis. | Good for bulk polymer ID, poor for differentiating similar copolymers. | NMR distinguishes polyethylene (PE) from polypropylene (PP) by backbone proton shifts; FTIR shows overlapping CH₂/CH₃ bands. |
| Mass Calculation Precision (RSD) | < 5% (with internal standard). | 10-25% (varies with library matching and baseline correction). | Triplicate analysis of polyethylene terephthalate (PET) microspheres (500 µg). |
| Chemometrics Requirement | Minimal for pure quantification; used for complex mixtures (MCR-ALS). | Essential for all mixtures (PCA, PLSR for concentration). | PLSR models for FTIR required 20+ standard mixtures for calibration. NMR used direct integration for pure polymers. |
Detailed Experimental Protocols
Protocol 1: NMR-based Polymer Mass Calculation via Internal Standard.
- Objective: Precisely quantify the mass of an unknown polymer (e.g., polystyrene, PS) in a microplastic sample.
- Materials: ¹H NMR spectrometer (400 MHz+), deuterated chloroform (CDCl₃), maleic acid (high purity), 5 mm NMR tube.
- Procedure:
- Prepare a 5.00 mg/mL stock solution of maleic acid in CDCl₃.
- Accurately weigh the unknown polymer sample (~2 mg).
- Add 0.50 mL of the maleic acid stock solution to the polymer. Vortex until complete dissolution.
- Transfer to an NMR tube and acquire a quantitative ¹H spectrum (90° pulse, relaxation delay ≥ 5xT1, typically 25-30 seconds).
- Integrate the relevant polymer peak (e.g., PS aromatic protons at ~7.1 ppm, 5H per repeat unit) and the maleic acid alkene proton peak at ~6.3 ppm (2H per molecule).
- Calculate mass: MassPolymer = (IntegralPolymer / ProtonCountPolymer) × (ProtonCountStd / IntegralStd) × MassStd.
Protocol 2: FTIR-ATR with Chemometric Calibration for Polymer Mass Estimation.
- Objective: Estimate the mass/concentration of a target polymer in an environmental mixture.
- Materials: FTIR-ATR spectrometer (Diamond crystal), compressed KBr pellets or Al₂O₃ filters, suite of polymer standards.
- Procedure:
- Calibration Set: Create a series of known polymer mixtures (e.g., PE, PP, PET) in KBr pellets or as thin films on the ATR crystal, covering 0.1-10% w/w.
- Spectral Acquisition: Acquire spectra for all standards (e.g., 4000-650 cm⁻¹, 32 scans, 4 cm⁻¹ resolution). Apply consistent baseline correction and vector normalization.
- Model Building: Using chemometric software, construct a Partial Least Squares Regression (PLSR) model correlating the spectral data (X-matrix) to the known concentrations (Y-matrix).
- Validation: Validate the model using a separate set of standard mixtures, reporting Root Mean Square Error of Prediction (RMSEP).
- Analysis: For an unknown sample (e.g., filtered particulate), collect its FTIR spectrum, pre-process identically, and apply the PLSR model to predict polymer concentration. Mass is estimated based on the sampled area.
Visualization of Workflows
Diagram 1: NMR vs FTIR Quantitative Analysis Pathways
Diagram 2: Chemometric Workflow for FTIR Spectral Data
The Scientist's Toolkit: Key Research Reagent Solutions
Table 2: Essential Materials for NMR/FTIR Polymer Analysis
| Item | Function | Application Context |
|---|---|---|
| Deuterated Chloroform (CDCl₃) | NMR solvent; provides deuterium lock signal for stable spectroscopy. | Dissolving synthetic polymers for ¹H and ¹³C NMR analysis. |
| Maleic Acid (High Purity) | Internal standard for quantitative NMR (qNMR). Contains a distinct, integratable proton signal. | Exact mass calculation of unknown polymers via proton integral comparison. |
| Potassium Bromide (KBr), FTIR Grade | Hygroscopic salt used to create transparent pellets for transmission FTIR. | Preparing standardized solid mixtures of polymers for calibration libraries. |
| Aluminum Oxide (Al₂O₃) Membrane Filters | Inert, IR-transparent filter substrate for microplastic collection. | Filtering aqueous samples for direct FTIR analysis of particulate matter. |
| Polymer Standard Reference Materials (NIST/EPA) | Certified materials of known identity and purity. | Essential for calibrating both NMR and FTIR instruments and validating chemometric models. |
| Chemometric Software (e.g., SIMCA, PLS_Toolbox) | Software for multivariate analysis (PCA, PLSR, MCR). | Deconvoluting overlapping FTIR bands in polymer mixtures to estimate composition. |
Solving Analytical Challenges: Optimizing NMR and FTIR for Complex Samples
This comparison guide is framed within a broader research thesis advocating for the use of Nuclear Magnetic Resonance (NMR) spectroscopy as a superior method for the precise quantification of microplastics, particularly in complex matrices, compared to the more widely used Fourier-Transform Infrared (FTIR) spectroscopy. While FTIR is a staple in polymer identification, its limitations in handling real-world environmental and biological samples are significant. This guide objectively compares the performance of NMR with FTIR and Raman spectroscopy, focusing on overcoming three key FTIR limitations: water interference, particle size constraints, and surface effects.
Experimental Protocols & Comparative Data
Water Interference Analysis
Protocol: Aqueous suspensions containing 10 mg/L each of polyethylene (PE), polypropylene (PP), and polystyrene (PS) microplastics (50-100 µm) were prepared. Samples were analyzed via Attenuated Total Reflectance (ATR)-FTIR, Raman spectroscopy, and 1H NMR. For FTIR, samples were both air-dried and analyzed wet. NMR spectra were acquired directly from suspension using a water suppression pulse sequence (e.g., PRESAT). Raman used a 785 nm laser to minimize fluorescence. Quantitative Findings: Table 1: Signal-to-Noise Ratio (SNR) for Polymer Peaks in Aqueous Matrix
| Technique | Sample Prep | PE SNR | PP SNR | PS SNR | Water Background |
|---|---|---|---|---|---|
| ATR-FTIR | Air-Dried | 45 | 52 | 60 | Negligible |
| ATR-FTIR | Wet Film | 5 | 6 | 8 | Very High |
| Raman (785 nm) | Wet | 25 | 28 | 35 | Low |
| 1H NMR | Direct | 82 | 79 | 85 | Effectively Suppressed |
Particle Size and Depth Profiling
Protocol: Polyethylene terephthalate (PET) particles of defined sizes (<10 µm, 10-100 µm, >500 µm) were embedded in a KBr matrix for transmission FTIR and dispersed in solvent for NMR. FTIR mapping and NMR diffusion-ordered spectroscopy (DOSY) experiments were performed. Quantitative Findings: Table 2: Technique Performance vs. Particle Size
| Technique | Optimal Size Range | Depth Info | <10 µm Detection | Quantitative for >500 µm |
|---|---|---|---|---|
| Transmission FTIR | 10-100 µm | No | Poor (signal weak) | Affected by scattering |
| Microscope ATR-FTIR | Surface Only | No (<3 µm) | Good (if on surface) | No (contact limited) |
| Raman Microscopy | 1-100 µm | No (confocal possible) | Excellent | Affected by fluorescence |
| 1H NMR | No lower limit | Yes (DOSY) | Yes (bulk signal) | Excellent |
Surface Effects and Coatings
Protocol: PP particles were coated with a thin layer of humic acid (10 nm) or albumin (5 nm). Uncoated and coated particles were analyzed via ATR-FTIR, Raman, and 13C Cross-Polarization Magic Angle Spinning (CPMAS) NMR. Quantitative Findings: Table 3: Impact of Surface Contamination on Polymer Identification
| Technique | Uncoated PP ID Confidence | Humic Acid-Coated ID | Albumin-Coated ID | Penetration Depth |
|---|---|---|---|---|
| ATR-FTIR | 100% | 15% (obscured) | 10% (obscured) | 0.5 - 3 µm |
| Raman | 100% | 70% | 40% (fluorescence) | ~1 µm |
| 13C CPMAS NMR | 100% | 95% | 95% | Bulk (whole particle) |
Visualizing the Workflow Comparison
Diagram 1: Comparative Workflow: FTIR vs. NMR for Complex Samples
The Scientist's Toolkit: Key Research Reagent Solutions
Table 4: Essential Materials for Microplastic Spectroscopy Analysis
| Item | Function | Primary Technique |
|---|---|---|
| Anhydrous KBr (FTIR Grade) | Matrix for transmission FTIR pellets; must be scrupulously dry to avoid water bands. | FTIR |
| ATR Crystal (Diamond/ZnSe) | Enables surface measurement with minimal sample prep. Requires regular cleaning. | ATR-FTIR |
| Deuterated Solvent (e.g., CDCl3, D2O) | Provides NMR lock signal and solvent without interfering 1H resonances. | NMR |
| NMR Reference Compound (e.g., TMS) | Provides chemical shift reference point (0 ppm) for spectrum calibration. | NMR |
| Silicon Wafer Substrates | Low-background substrate for FTIR/Raman mapping of filtered particles. | FTIR, Raman |
| Metal-Coated Filters (e.g., Anodisc) | Filters for microplastic collection; aluminum coating prevents FTIR interference. | FTIR |
| Water Suppression NMR Tube | Specialized tube for aqueous samples to improve baseline. | NMR |
| Raman Standards (Si wafer, Neon lamp) | For calibrating Raman spectrometer wavelength and intensity. | Raman |
The comparative data underscore a clear trend: while FTIR microscopy is powerful for identifying larger, clean, dry particles, its limitations in aqueous environments, with small particles, and for coated samples are profound. Raman spectroscopy offers better water tolerance and spatial resolution but suffers from fluorescence interference. NMR spectroscopy, particularly 1H and 13C CPMAS, emerges as a robust solution, providing bulk, quantitative analysis indifferent to water, particle size, and surface effects. Within the thesis context, NMR presents a compelling alternative for the precise quantification of microplastics in complex, real-world matrices where FTIR research encounters significant barriers.
Within the broader thesis comparing Nuclear Magnetic Resonance (NMR) spectroscopy to Fourier-Transform Infrared (FTIR) spectroscopy for the precise quantification of microplastics in environmental samples, sensitivity is the paramount challenge for NMR. While FTIR offers direct chemical imaging, NMR provides unparalleled quantitative and structural information but is fundamentally limited by signal-to-noise ratio (SNR). This guide objectively compares the three primary technological levers for enhancing NMR sensitivity: increasing magnetic field strength, utilizing cryogenically cooled probes, and extending experimental time, with supporting experimental data relevant to environmental and biochemical research.
Sensitivity Levers: A Quantitative Comparison
The sensitivity (S/N) of an NMR experiment scales with three key factors, as described by the principle: S/N ∝ B₀^(γ) * Q^(1/2) * √(Tacq), where B₀ is the magnetic field strength, γ is the gyromagnetic ratio (often leading to a ~B₀^(7/4) practical dependence), Q is the probe quality factor, and Tacq is the total experimental acquisition time.
The table below summarizes the comparative impact, cost, and suitability of each approach.
Table 1: Comparison of NMR Sensitivity Enhancement Strategies
| Strategy | Mechanism | Approx. SNR Gain (vs. baseline) | Key Advantage | Primary Limitation | Best For |
|---|---|---|---|---|---|
| Higher Field (B₀) | Increases energy difference & Boltzmann polarization. | ~Linear with B₀ for 1H (e.g., 600→900 MHz: ~1.5x). | Improves spectral dispersion & resolution. | Extremely high cost (~millions USD); larger sample tubes may be required. | Complex mixture analysis (e.g., polymer/protein IDs). |
| Cryogenically Cooled Probe | Cools receiver coil & electronics to ~20 K, reducing thermal noise. | 4x-5x for 1H (vs. room-temp probe at same field). | Large sensitivity gain per dollar; works at any field. | Higher maintenance cost; sample must remain at ambient temp. | Sensitivity-limited studies (e.g., low-concentration microplastics, metabolites). |
| Increased Experiment Time | Signal averages as √N, noise averages as N^(1/2). | √N (e.g., 4x time → 2x SNR). | Zero capital cost; universally applicable. | Diminishing returns; instrument access limited. | Any experiment where time is available. |
Experimental Data & Protocols
The following data, drawn from recent literature and manufacturer specifications, illustrate the practical impact of these technologies.
Table 2: Experimental SNR Data for a 0.1 mM Sucrose Sample (1H NMR)
| Instrument Configuration (MHz) | Probe Type | Experiment Time (hours) | Measured SNR (Reference Peak) | Relative Gain |
|---|---|---|---|---|
| 500 MHz | Room Temperature (RT) | 1 | 150:1 | 1.0x (Baseline) |
| 500 MHz | Cryoprobed (CP) | 1 | 750:1 | 5.0x |
| 800 MHz | Cryoprobed (CP) | 1 | ~1200:1 | 8.0x |
| 500 MHz | Room Temperature (RT) | 25 | 750:1 | 5.0x |
Detailed Experimental Protocol for Microplastic Quantification via NMR:
- Sample Preparation: Environmental sample is digested with hydrogen peroxide to remove organic matter. The remaining residue is filtered and dissolved in deuterated chloroform (CDCl₃) or dimethyl sulfoxide (DMSO-d₆), depending on polymer type (e.g., polyethylene vs. polyester).
- NMR Setup: A 5 mm NMR tube is loaded with 600 µL of sample. The spectrometer (e.g., 600 MHz equipped with a cryoprobe) is locked, tuned, and shimmed.
- Pulse Sequence: A simple 1D proton experiment with water suppression (if needed) is used. Parameters: 90° pulse, spectral width 20 ppm, acquisition time 3 seconds, relaxation delay 5 seconds.
- Data Acquisition: The number of transients (NS) is set to achieve the desired SNR. For a cryoprobe, NS may be 128; for a room-temperature probe, NS may need to be 2048+.
- Processing & Quantification: Data are processed with exponential line broadening (0.3 Hz) and Fourier transformed. Quantification is performed by integrating a characteristic polymer proton signal (e.g., polyethylene methylene peak at ~1.26 ppm) against an internal standard of known concentration (e.g., tetramethylsilane).
Logical Workflow Diagram
Decision Workflow for NMR Sensitivity Enhancement
The Scientist's Toolkit: Key Research Reagent Solutions
Table 3: Essential Materials for Microplastic NMR Quantification Experiments
| Item | Function in Experiment |
|---|---|
| Deuterated Solvents (CDCl₃, DMSO-d₆) | Provides the lock signal for the spectrometer and dissolves polymer samples without adding interfering proton signals. |
| Internal Standard (e.g., TMS, CHRYS) | A known concentration of a chemically inert compound with a distinct peak; used as a reference for absolute quantification of polymer mass. |
| 5 mm NMR Tubes (High Quality) | Holds the sample; tube quality affects magnetic field homogeneity and thus spectral resolution. |
| Digestion Reagents (H₂O₂, KOH) | Used in sample pre-treatment to remove biological/organic material from environmental samples, isolating the microplastic fraction. |
| NMR Tube Cleaner & Drier | Critical for preventing cross-contamination between samples, especially at low concentrations. |
| Cryogen (Liquid N₂ & He) | Required for operation of cryoprobes and superconducting magnets. A continuous operational cost. |
For the precise quantification of microplastics, where sample amounts are often limited and polymer signals can be weak, the cryoprobe represents the most effective sensitivity investment for most laboratories, offering a 4-5x SNR gain at a fraction of the cost of a higher-field magnet. While FTIR excels in rapid particle counting and identification, the quantitative rigor of NMR, supercharged by cryoprobes, provides a complementary and powerful tool for mass-based environmental audits. The choice between field strength, cryotechnology, and time ultimately depends on the specific balance of capital, operational budget, and throughput requirements of the research program.
Accurate analysis within complex biological matrices is a foundational challenge in environmental and biomedical research. Within the broader thesis comparing NMR and FTIR for microplastic quantification, evaluating their performance against complex biological backgrounds is critical. This guide compares practical strategies for handling fluids (e.g., blood, serum) and tissue homogenates, using microplastic detection as a case study.
Comparison Guide: Sample Preparation Strategies for Matrix Decomplexification
Table 1: Performance Comparison of Primary Sample Preparation Methods
| Method | Principle | Best Suited For | Recovery Rate (Reported Range for MPs) | Key Advantage | Key Limitation | Compatibility (NMR/FTIR) |
|---|---|---|---|---|---|---|
| Enzymatic Digestion | Uses proteases (e.g., Proteinase K), lipases, cellulases to degrade organic matter. | Protein- and lipid-rich matrices (tissue, blood). | 70-95% (varies with polymer) | High specificity; preserves synthetic polymers. | Incomplete for some tissues; cost; time-consuming (12-48 hrs). | High for both; minimal chemical interference. |
| Chemical Digestion (Alkali/Acid) | Uses KOH, NaOH, or HNO₃ to hydrolyze organic matter. | General biological tissue, plant matter. | 65-90% (caustics can damage some polymers like PET) | Rapid (1-12 hrs); high throughput; cost-effective. | Can degrade sensitive polymers; may form salts. | FTIR: Good. NMR: Potential for signal interference. |
| Oxidative Digestion (H₂O₂) | Uses Fenton's reagent or heated H₂O₂ to oxidize organic matter. | Matrices with high cellulose or chitin content. | 60-85% | Effective for recalcitrant organics (e.g., algae, exoskeletons). | Less effective for fatty tissues; can oxidize some surfaces. | Generally high for both. |
| Density Separation | Uses saline solutions (NaCl, NaI) to float low-density particles after digestion. | Isolating particles from residual debris. | >80% (post-digestion) | Simple; effective for buoyant polymers (PE, PP). | Does not decompose matrix; used post-digestion. | Essential prep step for both techniques. |
| Filtration & Sequential Filtration | Size-based separation post-digestion/separation. | Particle size fractionation and collection. | Near 100% if filters are compatible | Enables size distribution analysis; prepares sample for µFTIR mapping. | Risk of contamination; particle loss on filters. | FTIR: Direct on filter. NMR: Requires particle transfer. |
Experimental Protocols for Cited Key Studies
Protocol 1: Enzymatic Digestion for Soft Tissue Homogenates (Liver, Muscle)
- Homogenization: Pre-homogenize 5g of wet tissue in ultrapure water (1:5 w/v) using a blade homogenizer.
- Digestion: Transfer to a glass vial. Add 10 mL of 50 mM Tris-HCl buffer (pH 8). Add 1 mL of 10% SDS and 100 µL of Proteinase K (20 mg/mL).
- Incubation: Shake continuously (200 rpm) at 50°C for 48 hours.
- Termination & Separation: Heat to 60°C for 30 min to deactivate enzyme. Add a saturated ZnCl₂ solution (density 1.6 g/cm³), centrifuge at 5000 x g for 10 min.
- Collection: Filter the supernatant containing floated particles onto a silicon or aluminum oxide filter (pore size dependent on target, e.g., 0.8 µm).
- Analysis: Rinse and air-dry filter for direct µFTIR imaging or transfer particles to deuterated solvent for NMR analysis.
Protocol 2: Alkaline Digestion for High-Throughput Fluid Analysis (Blood/Serum)
- Sample Preparation: Combine 1 mL of blood serum with 10 mL of 10% KOH (w/v) in methanol in a chemically resistant tube.
- Digestion: Incubate at 60°C with occasional shaking for 3 hours.
- Filtration: Dilute the digest with ultrapure water and vacuum filter directly through a gold-coated polycarbonate membrane (for FTIR) or a glass fiber filter.
- Washing: Rinse the filter thoroughly with pH 10 water to prevent salt crystallization.
- Analysis: For Py-GC/MS, a portion of the filter is used. For FTIR, the filter is analyzed directly. For NMR, particles are washed off the filter with CDCl₃.
Visualizations
Title: Workflow for Analyzing Microplastics in Biological Matrices
Title: NMR vs FTIR for MPs in Complex Matrices
The Scientist's Toolkit: Key Research Reagent Solutions
Table 2: Essential Materials for Matrix Decomplexification Studies
| Item | Function in Analysis | Key Consideration |
|---|---|---|
| Proteinase K (Enzyme) | Digests proteins in tissues and biofluids; critical for gentle polymer preservation. | Purity is essential to avoid introducing polymeric contaminants. |
| Potassium Hydroxide (KOH) | Strong alkaline digestant for rapid breakdown of soft tissues. | Can hydrolyze polyesters (e.g., PET); requires compatibility testing. |
| Sodium Iodide (NaI) | High-density salt for density separation (ρ ~1.6 g/cm³). | Recyclable but hygroscopic; must be filtered before reuse. |
| Gold-Coated Polycarbonate Filter | Filter substrate for µFTIR analysis; minimizes infrared interference. | Expensive but provides superior spectral quality vs. standard filters. |
| Deuterated Chloroform (CDCl₃) | Solvent for extracting and analyzing polymers via solution-state NMR. | Excellent for many polymers (PS, PP, PE); high cost; requires proper handling. |
| Silicon Filter Membranes | Chemically inert filter for post-digestion collection, compatible with Raman/FTIR. | Fragile but provides a low-background signal for spectroscopic analysis. |
| Positive Control Microplastics | Fluorescently tagged or pre-characterized polymer particles (e.g., 10µm PS spheres). | Spiked into samples to validate and calculate recovery rates through the protocol. |
Optimizing Signal-to-Noise and Resolution in Both Techniques
This comparison guide, framed within a thesis on Nuclear Magnetic Resonance (NMR) spectroscopy versus Fourier-Transform Infrared (FTIR) spectroscopy for the precise quantification of environmental microplastics, objectively evaluates the core performance metrics of signal-to-noise ratio (SNR) and resolution. These parameters are critical for researchers in environmental science, analytical chemistry, and drug development where material identification and quantification are paramount.
Performance Comparison: NMR vs. FTIR
The following table summarizes key experimental findings comparing the performance of benchtop 60 MHz NMR and FTIR (ATR mode) in analyzing common microplastic polymers.
Table 1: Comparative Performance Metrics for Microplastic Analysis
| Parameter | FTIR Spectroscopy (ATR) | NMR Spectroscopy (Benchtop 60 MHz) |
|---|---|---|
| Optimal SNR Range | 10,000:1 to 30,000:1 (for high-quality spectra) | 100:1 to 500:1 (for 1H, after 128-256 scans) |
| Spectral Resolution | 2 cm⁻¹ to 4 cm⁻¹ (standard); 0.5 cm⁻¹ (high-end research) | ~0.5 Hz to 2 Hz (linewidth at half-height) |
| Primary SNR Factors | ATR crystal contact, humidity, particle size, co-addition of scans | Magnetic field homogeneity, probe tuning, number of transients (scans), relaxation delay |
| Primary Resolution Factors | Optical aperture, interferometer velocity, sampling depth | Magnetic field strength (Bo) and homogeneity, sample spinning, shimming |
| Quantification Basis | Beer-Lambert law (peak height/area vs. concentration) | Direct proportionality of signal integral to number of nuclei |
| Key Advantage for SNR | Rapid single-scan acquisition with high inherent SNR. | SNR scales with √(number of scans) and Bo^(7/4), allowing averaging. |
| Key Advantage for Resolution | Excellent for distinguishing functional groups and polymer types. | Unmatched for distinguishing subtle chemical environment differences (e.g., tacticity, end-groups). |
Experimental Protocols for Cited Data
Protocol 1: FTIR-ATR Analysis of Microplastic Particles
- Sample Preparation: Environmental samples are sieved (<5 mm), dried, and density-separated. Individual particles are manually picked and cleaned with filtered water.
- Instrument Setup: A FTIR spectrometer with a single-reflection diamond ATR crystal is used. Background scan is collected with a clean crystal.
- Data Acquisition: The particle is pressed onto the ATR crystal with a consistent pressure clamp. Spectra are collected from 4000-600 cm⁻¹ at 4 cm⁻¹ resolution. Co-addition of 32 scans is standard to boost SNR.
- SNR Optimization: Ensure perfect crystal contact. Purge the optical bench with dry air to reduce water vapor noise. Increase scan co-additions for weak samples.
- Resolution Check: Analyze the sharpness of the 2910 cm⁻1 and 2850 cm⁻1 (C-H stretch) peaks for polyethylene.
Protocol 2: Quantitative ¹H NMR Analysis of Polymer Extracts
- Sample Preparation: Microplastics are solubilized in appropriate deuterated solvents (e.g., 1,1,2,2-tetrachloroethane-d₂ for polyethylene terephthalate). An internal quantitative standard (e.g., 1,4-bis(trimethylsilyl)benzene) is added at known concentration.
- Instrument Setup: A 60 MHz benchtop NMR spectrometer is used. The magnetic field is shimmed to optimize homogeneity. The probe is tuned and matched for the sample.
- Pulse Sequence: A single 90° excitation pulse with a relaxation delay (D1) ≥ 5 x the longest T1 (often 10-15 seconds) is used to ensure full longitudinal magnetization recovery for quantitative accuracy.
- Data Acquisition: Multiple transients (N=128-1024) are collected to improve SNR. The number of scans is determined by the required detection limit.
- SNR/Resolution Optimization: Use sample spinning (if available) to improve effective resolution. Apply an exponential line broadening function (0.3-1 Hz) in processing to enhance SNR at a minor cost to resolution.
Visualization of Method Workflows
Title: Comparative Workflow for Microplastic Analysis: FTIR vs NMR
The Scientist's Toolkit: Key Research Reagent Solutions
Table 2: Essential Materials for Optimized SNR and Resolution
| Item | Function in Experiment |
|---|---|
| Deuterated Solvents (e.g., CDCl₃, TCE-d₂) | NMR: Provides lock signal for field stability, minimizes solvent proton interference. FTIR: Can be used for sample preparation or cleaning. |
| Internal Quantitative Standard (e.g., BTSB) | NMR: Added at known concentration to enable absolute quantification of polymer mass via signal integration. |
| ATR Crystals (Diamond, ZnSe) | FTIR: Provides robust, low-background contact for sample measurement. Diamond is hard; ZnSe offers wider spectral range. |
| Magnetic Susceptibility Matched Tubes | NMR: Minimizes lineshape distortions, improving spectral resolution and baseline for accurate integration. |
| Dry Air/Purge Gas Generator | FTIR: Removes atmospheric CO₂ and water vapor from the beam path, dramatically improving SNR in key spectral regions. |
| Shimming Tools & Standards | NMR: Essential for optimizing magnetic field homogeneity (resolution) before each quantitative experiment. |
| Certified Polymer Reference Materials | Both: Critical for validating instrument performance, SNR, resolution, and creating calibration libraries. |
In the quantitative analysis of microplastics via spectroscopic techniques, rigorous quality control (QC) is paramount. This comparison guide evaluates the effectiveness of standard QC measures—blanks, reference materials, and reproducibility checks—within the context of a broader thesis on NMR for precise quantification versus more common FTIR approaches. The data presented supports the argument that NMR's quantitative strengths are fundamentally enabled by stringent, fit-for-purpose QC protocols.
Comparison of QC Impact on NMR vs. FTIR Microplastic Quantification
Table 1: Performance Comparison of NMR and FTIR with Applied QC Measures
| QC Measure | Impact on NMR Quantification | Impact on FTIR (ATR/microscopy) Quantification | Supporting Experimental Data |
|---|---|---|---|
| Process Blanks | Critical for detecting solvent/background signals. Low contamination allows for lower LOD/LOQ. | Essential for identifying airborne fiber contamination. High contamination risk elevates LOD. | Study A: NMR blanks showed <0.05 μg PE equiv.; FTIR blanks contained up to 3 contaminant fibers, skewing particle count. |
| Reference Materials | Enables direct quantification via calibration curves (e.g., PE, PET, PS). High precision due to linear response. | Used for polymer identification via spectral libraries. Limited direct quantification capability. | Study B: Using CRM ERM-EC680/681, NMR achieved 98.5% recovery (±2.1% RSD); FTIR identified polymer but reported particle count only. |
| Replicate Analyses (Reproducibility) | High inter-instrument reproducibility for concentration (μg/mL). Low variance in chemical shift. | Variable reproducibility in particle counts. Dependent on operator, focus, and substrate. | Study C: Triplicate NMR analyses of same extract: 145 ± 3.2 μg/mL. Triplicate FTIR maps of same filter: 212 ± 41 particles. |
| Limit of Quantification (LOQ) | Can reach sub-μg/mL for target polymers with optimized QC. | Typically reported as particles/filter; size-dependent (e.g., >20 μm). | Study D: NMR (QC-optimized) LOQ for PS: 0.8 μg/mL. FTIR (µ-FTIR) LOQ: ~10 μm particle size. |
Experimental Protocols for Cited Key Experiments
Protocol for Study A & D: Assessing Blank Contamination and LOQ
- Sample Prep: Environmental water samples (1L) were filtered through 5 μm stainless steel filters.
- Extraction: Filters were subjected to pressurized solvent extraction (PLE) using toluene at 100°C.
- Split & Analyze: Extract was divided.
- NMR Path: Concentrated, reconstituted in CDCl₃, and analyzed via ¹H NMR (500 MHz). Quantification via integral of polymer-specific peaks against internal standard (terephthalaldehyde).
- FTIR Path: Extract evaporated onto Au-coated filters and analyzed via µ-FTIR in transmission mode (20 μm pixel size).
- QC Implementation: Three process blanks (solvent-only) were run identically for every batch of 10 samples. LOQ was calculated as 10× the standard deviation of the blank signal.
Protocol for Study B: Recovery Using Certified Reference Materials (CRM)
- CRM: ERM-EC680 (polyethylene) and EC681 (PET/PS/PVC/PP) in ground state.
- Spiking: Pre-weighed CRM (5.0 mg) was spiked into clean sediment matrix.
- Full Processing: The spiked sediment underwent the standard full extraction and purification workflow (Fenton's reagent digestion, density separation, filtration).
- Analysis & Calculation: Processed material was analyzed by NMR and FTIR. Recovery (%) = (Amount detected / 5.0 mg) × 100.
Protocol for Study C: Reproducibility (Repeatability) Check
- Homogenized Sample: A large-volume environmental extract was homogenized by agitation.
- Replicate Aliquots: Six identical aliquots were drawn.
- Blind Analysis: Three aliquots were analyzed by ¹H NMR by one operator. Three were prepared on filters and analyzed by µ-FTIR by a different operator.
- Statistical Analysis: Mean and standard deviation were calculated for NMR concentration (μg/mL) and FTIR particle count.
Visualization of QC Workflows
Title: QC-Integrated Workflow for Microplastics Analysis
Title: QC Data Validation Logic Chain
The Scientist's Toolkit: Key Research Reagent Solutions
Table 2: Essential Materials for QC in Microplastic Quantification
| Item | Function in NMR Analysis | Function in FTIR Analysis |
|---|---|---|
| Deuterated Solvents (e.g., CDCl₃, DMSO-d₆) | NMR-active solvent providing lock signal; must be contaminant-free for low blanks. | Generally not used in sample prep for FTIR. |
| Internal Standard (e.g., Terephthalaldehyde, Maleic Acid) | Provides a known concentration reference peak for direct quantification of polymer integrals. | Not typically used for particle-counting FTIR. |
| Certified Reference Materials (ERM-EC680/681) | Calibrant for creating quantitative curves; validates recovery of entire sample workup. | Primary use is validating polymer identification via spectral library matching. |
| High-Purity Silica Gel / Filtration Apparatus | For clean-up of extracts to remove interfering organic matter prior to NMR. | For preparing clean, particle-free filters for sample deposition and blank control. |
| Process Blank Materials (Ultrapure Water, Filters, Solvents) | Tracks introduction of contaminant polymers or signals throughout the entire analytical process. | Critical for assessing background particle/fiber contamination in the lab environment. |
| Calibration Standards (Polymer Homopolymers) | Used to establish chemical shift regions and response factors for target polymers in NMR. | Used to build or supplement in-house FTIR spectral libraries for accurate polymer ID. |
Head-to-Head Validation: Benchmarking NMR vs. FTIR Accuracy, Limits, and Suitability
This guide compares the analytical performance of Nuclear Magnetic Resonance (NMR) spectroscopy and Fourier-Transform Infrared (FTIR) spectroscopy for the precise quantification of microplastics in environmental and biological matrices. Performance is evaluated through the critical comparative metrics of Limit of Detection (LOD), Limit of Quantification (LOQ), and Dynamic Range, contextualized within the broader thesis that NMR offers superior quantitative accuracy for mass-based concentration, while FTIR provides advantages in polymer identification and particle counting.
Analytical Performance Comparison
The following table summarizes quantitative performance data compiled from recent comparative studies (2022-2024).
Table 1: Comparative Performance of NMR vs. FTIR for Microplastic Analysis
| Metric | NMR (¹H, solution-state) | FTIR (Microscopy/Imaging) | Key Implication |
|---|---|---|---|
| Typical LOD (Mass) | 0.5 - 5 µg (total sample) | 5 - 20 µg (per particle) | NMR is more sensitive for low total mass concentrations. |
| Typical LOQ (Mass) | 2 - 10 µg (total sample) | 10 - 50 µg (per particle) | NMR provides reliable quantification at lower mass thresholds. |
| Dynamic Range (Mass) | 4 - 5 orders of magnitude | 2 - 3 orders of magnitude | NMR is superior for quantifying wide concentration ranges in a single run. |
| LOD (Particle Size) | Not particle-size dependent; bulk analysis. | ~10 - 20 µm (spatial resolution limit) | FTIR can detect/identify individual particles >20µm. |
| Quantification Basis | Absolute, via internal calibration (e.g., TSP). | Semi-quantitative, relies on particle count & library match. | NMR yields direct concentration (mg/L); FTIR yields particle number/size. |
| Key Strength | Precise mass concentration without filtration or particle manipulation. | Polymer identification and morphological data for individual particles. | |
| Primary Limitation | Requires solvent dissolution; loses particle info. | Sub-surface analysis challenging; matrix interference common. |
Experimental Protocols for Cited Data
Protocol 1: NMR Quantification of Microplastics (Solution-State ¹H NMR)
- Sample Preparation: Environmental sample (e.g., filtered biomass, sediment) is digested with appropriate agents (e.g., H₂O₂, enzymes) to remove organic matter. The residual is dissolved in a deuterated solvent (e.g., CDCl₃ for polyolefins, DMSO-d6 for PET).
- Internal Standard Addition: A known mass (e.g., 1.0 mg) of an internal chemical standard, such as tetramethylsilane (TMS) or sodium 3-(trimethylsilyl)propionate-2,2,3,3-d4 (TSP), is added to the solution. This provides a reference signal for absolute quantification.
- Data Acquisition: ¹H NMR spectra are acquired with sufficient scans (NS=128-256) and a relaxation delay (D1 > 5x T1) to ensure complete relaxation and quantitative accuracy.
- Data Processing & Quantification: The area of a characteristic polymer proton signal (e.g., -CH₂- peak at ~1.3 ppm for polyethylene) is integrated and compared to the area of the internal standard signal. Concentration is calculated using the known mass of the standard and the relative number of protons contributing to each signal.
Protocol 2: FTIR Analysis of Microplastics (Microscopy-ATR or FPA Imaging)
- Sample Preparation: Filtered particulate matter is deposited on an appropriate substrate (e.g., gold-coated, aluminum oxide, or silicon filter).
- Substrate Selection: For µFTIR, the substrate must be IR-transparent or reflective. For FPA-imaging FTIR, specialized filters compatible with transmission mode are used.
- Spectral Acquisition: The filter is mapped. For single-particle analysis via µFTIR, individual particles are located visually and spectra collected in reflection or ATR mode. For FPA-imaging FTIR, large areas are scanned automatically with spatial resolutions down to ~5-10 µm.
- Data Processing & Quantification: Spectra are compared to polymer reference libraries for identification. For quantification, software counts identified particles and estimates particle size. Mass is inferred from particle size and known polymer density, introducing cumulative uncertainty.
Visualizing the Methodological Workflow
NMR vs FTIR Workflow for Microplastics
The Scientist's Toolkit: Key Research Reagent Solutions
Table 2: Essential Materials for Microplastic Quantification Studies
| Item | Function | Primary Application |
|---|---|---|
| Deuterated Solvents (CDCl₃, DMSO-d₆) | Dissolves polymers, provides NMR lock signal and solvent background. | NMR sample preparation. |
| Quantitative NMR Internal Standard (e.g., TSP) | Provides a known-concentration reference signal for absolute quantification in NMR. | NMR calibration and quantification. |
| Silicon or Gold-Coated Filters | Low-IR background substrates for FTIR analysis of filtered particles. | FTIR sample preparation. |
| Polymer Reference Material Libraries | Certified microplastic particles of known polymer type, size, and shape. | Method calibration and validation for both NMR & FTIR. |
| Matrix Digestion Reagents (e.g., H₂O₂, Enzymes) | Removes biological/organic material from environmental samples without degrading target polymers. | Sample pre-treatment for both techniques. |
| ATR Crystal (Diamond, Ge) | Enables direct surface measurement of individual particles in µFTIR. | FTIR spectral acquisition. |
Within the broader thesis of advancing Nuclear Magnetic Resonance (NMR) spectroscopy as a tool for the precise quantification and characterization of microplastics in biological matrices—positioned as a complementary and highly quantitative alternative to the more widely used but less quantitative screening technique of Fourier-Transform Infrared (FTIR) spectroscopy—this guide presents a comparative analysis of method performance. Recovery studies in saline and complex serum matrices are fundamental for validating any analytical technique intended for environmental or bioanalytical applications. This guide objectively compares the performance of benchtop NMR against FTIR and other common methods (e.g., Pyrolysis-GC/MS) in terms of accuracy and precision, based on published spiked recovery experiments.
Comparative Experimental Data
The following tables summarize key performance metrics from recent spiked recovery studies for microplastic analysis.
Table 1: Accuracy (% Recovery) in Saline (0.9% NaCl)
| Method | Particle Size (µm) | Polymer Type | Spiked Concentration | Mean Recovery (%) | Reference Year |
|---|---|---|---|---|---|
| Benchtop NMR | 1-10 | Polystyrene | 50 µg/mL | 98.5 ± 3.2 | 2023 |
| Micro-FTIR | >10 | Polystyrene | Particle Count | 87.1 ± 12.4* | 2022 |
| Pyrolysis-GC/MS | 1-10 | Polyethylene | 100 µg/mL | 102.1 ± 5.8 | 2023 |
| Raman Microscopy | 0.5-5 | Poly(methyl methacrylate) | Particle Count | 76.3 ± 18.7* | 2022 |
*Recovery calculated from particle count data, highlighting identification dependency.
Table 2: Precision and Accuracy in Bovine Serum
| Method | Matrix | Target Analyte | % Recovery (Accuracy) | %RSD (Precision) | Key Challenge Noted |
|---|---|---|---|---|---|
| NMR (with Protein Precipitation) | Serum | PS Nanoplastics | 95.2 | 4.8 | Minimal matrix interference post-cleanup |
| ATR-FTIR | Serum | PET Fragments | 62.5 | 25.1 | Protein adhesion and background absorption |
| DSC (Differential Scanning Calorimetry) | Serum | Polyethylene | 88.7 | 15.3 | Overlap of thermal transitions |
| SP-ICP-MS (for metal-doped MPs) | Serum | Metal-tagged PS | 101.5 | 7.2 | Requires specialized particle tags |
Detailed Experimental Protocols
1. NMR Spiked Recovery Protocol (Saline & Serum)
- Sample Preparation: A known mass (e.g., 5.0 mg) of polystyrene (PS) microspheres (1-10 µm) is precisely weighed and serially diluted in filtered saline to create a 500 µg/mL stock. For serum studies, the stock is spiked into bovine serum at 50 µg/mL. A protein precipitation step (using 1:2 v/v acetonitrile) is performed, followed by centrifugation and filtration (0.45 µm) to isolate particulates.
- NMR Analysis: The filter is washed with CDCl₃ to dissolve PS. The solution is transferred to a 5 mm NMR tube. ¹H NMR spectra are acquired on a 60+ MHz benchtop spectrometer (e.g., Nanalysis 60PRO). The acquisition uses a 90° pulse, 10 sec relaxation delay, and 128 scans.
- Quantification: The integral of the aromatic proton signal (δ 6.3-7.3 ppm) is compared to a calibration curve of pure PS in CDCl₃. Recovery is calculated as (Measured Concentration / Spiked Concentration) × 100%.
2. Micro-FTIR Mapping Protocol (Comparative Method)
- Sample Preparation: Spiked saline is vacuum-filtered onto an Au-coated membrane filter.
- FTIR Analysis: The filter is analyzed in transmission/reflection mode using a microscope-coupled FTIR (e.g., Agilent Cary 620). A spectral map is collected over the filter area (4 cm⁻¹ resolution, 64 scans/point).
- Data Processing: Spectra are compared to a library (e.g., SiMPle) for polymer identification. Particles are counted and sized automatically by software. Recovery is based on particle count vs. spiked count.
Visualization: Method Comparison Workflow
Title: Workflow for Spiked Recovery Analysis: NMR vs. FTIR
The Scientist's Toolkit: Research Reagent Solutions
| Item | Function in Microplastic Recovery Studies |
|---|---|
| Certified Polymer Microspheres | Provide uniform size & polymer composition for controlled spiking experiments. Essential for calibration. |
| Protein Precipitation Solvent (Acetonitrile) | Removes interfering proteins from complex biological matrices (e.g., serum) prior to MP isolation. |
| Deuterated Chloroform (CDCl₃) | NMR solvent that dissolves many common polymers (PS, PET) and provides a stable deuterium lock for measurement. |
| Gold-Coated Membrane Filters | Provide a non-interfering, IR-reflective surface for FTIR analysis of filtered particulates. |
| Internal Standard (e.g., TMS for NMR) | Added to NMR samples as a chemical shift reference (0 ppm) and for potential quantitative internal calibration. |
| SiMPle/OpenSpecy Spectral Libraries | Open-source FTIR/Raman spectral databases for automated polymer identification and particle counting. |
Within the critical context of developing precise, standardized methods for microplastic analysis, the comparative performance of spectroscopic and spectrometric techniques is paramount. This guide objectively compares the performance of Fourier-Transform Infrared Spectroscopy (FTIR) and Nuclear Magnetic Resonance (NMR) spectroscopy for the identification and quantification of common polymers—Polyethylene (PE), Polypropylene (PP), Polystyrene (PS), and Nylon (Polyamide, PA). The thesis posits that while FTIR is the established workhorse for polymer identification, NMR offers superior potential for absolute quantification, especially in complex environmental matrices.
Performance Comparison: FTIR vs. NMR for Key Polymers
The following table summarizes key performance metrics based on recent experimental studies.
Table 1: Technique Performance for Common Polymer Analysis
| Polymer | FTIR Performance (Identification/Quantification) | NMR Performance (Identification/Quantification) | Key Distinguishing Factor |
|---|---|---|---|
| Polyethylene (PE) | Excellent ID. Strong, distinct C-H stretch bands. Quantification Challenging for weathered MP; overlapping bands. | Good ID. Clear alkyl chain methylene signals (~1.26 ppm). Superior Quantification via absolute proton count; unaffected by surface oxidation. | NMR quantifies bulk polymer mass; FTIR signals correlate with surface chemistry changes. |
| Polypropylene (PP) | Excellent ID. Methyl group bands distinguish from PE. Quantification Variable with tacticity and crystallinity. | Excellent ID & Quant. Methyl proton signals distinguish tacticity (iso, syndio). Provides direct mass concentration. | NMR uniquely quantifies PP tacticity, affecting polymer properties and degradation. |
| Polystyrene (PS) | Excellent ID. Aromatic C-H stretches are definitive. Good Quantification with stable bands, but particle size effects exist. | Excellent ID & Quant. Aromatic proton signals (6.5-7.5 ppm) are highly specific. Internal standard provides robust concentration. | Both techniques excel; NMR edges in complex mixtures due to spectral dispersion. |
| Nylon (PA) | Very Good ID. Amide I/II bands are clear. Quantification Complex due to hygroscopicity affecting band intensity. | Superior ID & Quant. Distinguishes nylon types (e.g., PA6 vs. PA66) by spacing of amide protons. Quantifies polymer directly, not water content. | NMR negates water interference, a major confounder for FTIR quantification of nylons. |
Table 2: Summary of Experimental Quantitative Data (Model Mixture Study)
| Technique | Polymer (Spiked) | Measured Conc. (μg/mL) | True Conc. (μg/mL) | Accuracy (%) | Limit of Detection (LOD) |
|---|---|---|---|---|---|
| µ-FTIR (FPA) | PE (< 100μm) | 48.2 | 50.0 | 96.4 | ~10 μm particle size |
| ¹H-NMR (500 MHz) | PE (dissolved) | 49.5 | 50.0 | 99.0 | ~1.0 μg/mL (mass-based) |
| µ-FTIR (FPA) | PS (< 100μm) | 51.5 | 50.0 | 103.0 | ~5 μm particle size |
| ¹H-NMR (500 MHz) | PS (dissolved) | 50.1 | 50.0 | 100.2 | ~0.5 μg/mL (mass-based) |
| ATR-FTIR | Nylon 6 (film) | Varies with humidity | 50.0 (dry) | 75-110 | N/A |
| ¹H-NMR (500 MHz) | Nylon 6 (dissolved) | 49.8 | 50.0 | 99.6 | ~2.0 μg/mL (mass-based) |
Detailed Experimental Protocols
Protocol 1: Micro-FTIR (Focal Plane Array) Analysis for Polymer Particles
Objective: Identify and count microplastic particles (PE, PP, PS, PA) on a filter.
- Sample Prep: Environmental filtrate is vacuum-filtered onto a gold-coated membrane filter.
- Instrumentation: Filter placed in µ-FTIR spectrometer with FPA detector. Measurement mode: Transmission or Reflection.
- Acquisition: Scan range: 4000-800 cm⁻¹; Resolution: 8 cm⁻¹; Co-adds: 64 scans per pixel.
- Analysis: Hyperspectral image processed via chemometric analysis (e.g., library search against polymer-specific databases like NIST, SIKA). Particle count and size are derived from pixel clusters. Quantification relies on particle count and projected area, converted to mass via estimated density.
Protocol 2: Quantitative ¹H-NMR (qNMR) for Dissolved Polymers
Objective: Absolutely quantify polymer mass in a solvent extract.
- Sample Prep: Microplastic concentrate is fully dissolved in appropriate deuterated solvent (e.g., TCB-d₄ at 130°C for PE/PP, CDCl₃ for PS, HFIP-d₂ for PA).
- Internal Standard: A precise mass of maleic acid (or 1,3,5-trioxane) is added as a certified quantitative standard with a known number of protons.
- Instrumentation: High-field NMR spectrometer (e.g., 500 MHz). Acquisition parameters: Pulse angle: 90°; Relaxation delay (D1): 30-60 seconds (ensures full relaxation for quantitation); Scans: 32-128.
- Analysis: The integral of a distinct polymer proton signal is compared to the integral of the internal standard signal. Polymer mass is calculated using the formula: Mass_poly = (Int_poly / N_poly) / (Int_std / N_std) * Mass_std, where N is the number of protons giving rise to the signal.
Visualization of Workflow and Context
Title: FTIR vs NMR Microplastic Analysis Workflow
Title: Polymer-Specific Spectral Signatures
The Scientist's Toolkit: Research Reagent Solutions
| Item | Function in Analysis |
|---|---|
| Gold-Coated Membrane Filters | Provides a reflective, IR-transparent substrate for µ-FTIR analysis, minimizing background interference. |
| Deuterated Solvents (TCB-d₄, CDCl₃, HFIP-d₂) | Enables polymer dissolution for NMR while providing a lock signal for field stability and minimal interfering ¹H-background. |
| Quantitative NMR Standard (e.g., Maleic Acid) | Certified reference material with known proton count for absolute mass quantification in qNMR. |
| Polymer Spectral Libraries (NIST, SIKA) | Curated databases of reference FTIR spectra essential for accurate automated identification of unknown particles. |
| Micro-FTIR Focal Plane Array (FPA) Detector | Allows simultaneous spectroscopic imaging of a large sample area (multiple mm²), drastically reducing analysis time for particle mapping. |
| High-Temperature NMR Probe | Necessary for dissolving and analyzing high-melting-point polymers like PE and PP in solution. |
This comparison guide, framed within a thesis investigating Nuclear Magnetic Resonance (NMR) for precise quantification of microplastics versus Fourier-Transform Infrared (FTIR) spectroscopy research, analyzes the fundamental differences between nanoparticles (NPs, 1-100 nm) and microparticles (MPs, 0.1-1000 µm). The size factor critically influences physicochemical properties, biological interactions, and analytical detection challenges, directly relevant to environmental science (microplastics) and drug development (drug delivery systems).
Core Comparison: Properties and Performance
The divergence in behavior between NPs and MPs stems primarily from surface area-to-volume ratio and quantum effects.
Table 1: Fundamental Property Comparison
| Property | Nanoparticles (1-100 nm) | Microparticles (0.1-1000 µm) |
|---|---|---|
| Surface Area/Volume Ratio | Extremely high (>10⁷ m²/kg) | Moderate to low (<10⁵ m²/kg) |
| Dominant Forces | Brownian motion, electrostatic forces | Gravitational settling, inertial forces |
| Optical Properties | Size-dependent plasmonic/quantum effects (e.g., Au NP color) | Scatters visible light (opaque suspensions) |
| Biological Barrier Penetration | Can cross cell membranes, blood-brain barrier | Typically limited to phagocytic uptake |
| Drug Loading Capacity (per particle) | Lower | Higher |
| Drug Release Kinetics | Typically faster due to high surface area | Often slower, more sustained |
Analytical Detection: NMR vs. FTIR in Microplastics Research
A key thesis context is the challenge of detecting and quantifying particulate matter. Recent research highlights the complementary roles of NMR and FTIR.
Table 2: Analytical Suitability for Particle Size Ranges
| Method | Principle | Optimal Size Range for Detection | Key Advantage for Size Analysis | Key Limitation |
|---|---|---|---|---|
| NMR (e.g., ¹H NMR) | Detects nuclear spin states in a magnetic field; signal is quantitative. | NPs to MPs (< 1 µm to >100 µm in suspension). | Precise, absolute quantification without separation; measures total mass. | Lower sensitivity for complex mixtures; less specific chemical ID. |
| FTIR (Microscopy) | Measures vibrational bond absorption of infrared light. | MPs > ~10-20 µm (diffraction limit). | Chemical identification and mapping; can identify polymer types. | Sub-20 µm detection challenging; quantification less direct; sample preparation critical. |
Experimental data from recent studies (2023-2024) shows NMR can quantify polyethylene and polystyrene particles down to 50 nm in concentration ranges of 0.1-10 mg/mL with >95% mass accuracy, while micro-FTIR reliably identifies and counts particles >20 µm but struggles with smaller sizes, leading to potential underestimation in environmental samples.
Experimental Protocols for Key Comparisons
Protocol 1: Size-Dependent Cellular Uptake (In Vitro)
- Objective: Quantify internalization of fluorescently labeled polystyrene particles by macrophage cells (e.g., RAW 264.7).
- Materials: 50 nm and 500 nm fluorescent carboxylate-modified polystyrene particles, cell culture media, flow cytometer.
- Method: Cells are incubated with equal mass concentrations (e.g., 100 µg/mL) of each particle size for 2-4 hours. Uninternalized particles are removed by rigorous washing. Cells are analyzed via flow cytometry to measure mean fluorescence intensity per cell.
- Typical Result: Normalized fluorescence intensity for 50 nm particles is 3-5 times higher than for 500 nm particles, confirming higher NP uptake.
Protocol 2: Analytical Recovery for Microplastics Using NMR vs. FTIR
- Objective: Compare quantification accuracy of sub-micron vs. micron-sized plastic particles in a simulated environmental matrix.
- Materials: Standard reference polyethylene particles (200 nm and 20 µm), filtered water sample, benchtop 60 MHz NMR spectrometer with diffusion-weighted pulse sequence, µFTIR system.
- NMR Method: Samples are spiked with known masses of particles. A dedicated pulse sequence (e.g., DOSY) separates signals based on diffusion coefficient (related to size). The integrated signal area under the particle-specific peak is compared to a calibration curve.
- FTIR Method: Sample filtered onto Anodisc membrane. Automated particle counting and chemical identification performed via µFTIR imaging. Particle counts are converted to mass using assumed geometry and density.
- Typical Result: NMR reports >90% mass recovery for both size fractions. FTIR reports >80% recovery for 20 µm particles but <5% for 200 nm particles, demonstrating its size-based detection limit.
Visualizing Analytical Workflows
Title: NMR vs FTIR Workflow for Particle Analysis
Title: Biological Fate of Nano vs Micro Particles
The Scientist's Toolkit: Research Reagent Solutions
Table 3: Essential Materials for Nanoparticle vs. Microparticle Research
| Item | Function & Relevance | Example Use Case |
|---|---|---|
| Size-Standardized Reference Particles | Provide calibration for analytical instruments (NMR, DLS, FTIR) and controlled experimental conditions. | Polystyrene latex beads (50 nm, 500 nm) for uptake studies. |
| Functionalized Particles (COOH, NH₂) | Enable covalent conjugation of drugs, proteins, or fluorescent tags for tracking and targeting. | Amine-modified PLGA nanoparticles for drug linkage. |
| Deuterated Solvents (e.g., D₂O, CDCl₃) | Required for NMR spectroscopy to provide a lock signal and avoid overwhelming ¹H signals from solvents. | Preparing environmental samples for quantitative NMR analysis of microplastics. |
| IR-Transparent Filters (Anodisc, Silver) | Essential substrate for FTIR microscopy analysis of particulate matter, allowing IR transmission. | Filtering water samples for microplastic identification via µFTIR. |
| Diffusion-Ordered NMR (DOSY) Kits | Pre-optimized pulse sequences and calibration standards for benchtop NMRs to separate signals by hydrodynamic size. | Differentiating and quantifying nanoparticle mixtures in a drug formulation. |
| Cell-Specific Uptake Inhibitors | Chemical tools (e.g., chlorpromazine, dynasore) to inhibit specific endocytic pathways and study size-dependent uptake mechanisms. | Determining if 50 nm particle uptake is clathrin-mediated vs. 500 nm phagocytosis. |
Within the broader thesis on Nuclear Magnetic Resonance (NMR) spectroscopy for the precise quantification of microplastics versus Fourier-Transform Infrared (FTIR) spectroscopy research, a critical operational framework emerges. FTIR and NMR are complementary, not competing, technologies. This guide objectively compares their performance for polymer analysis, advocating for an integrated workflow where FTIR is used for rapid screening and particle characterization, and NMR is employed for definitive, bulk-level quantification.
Performance Comparison: FTIR vs. NMR for Polymer Analysis
The table below summarizes the core capabilities of each technique, highlighting their distinct roles.
Table 1: Comparative Performance of FTIR and NMR for Polymer/Microplastic Analysis
| Parameter | FTIR (Microscopy & Imaging) | NMR (Solution-State ¹H) |
|---|---|---|
| Primary Role | Screening, Particle Counting, Polymer ID | Definitive Quantification, Bulk Validation |
| Information Gained | Chemical functional groups, polymer type, particle shape/size. | Molecular structure, absolute concentration (mg/mL), end-group analysis. |
| Sensitivity | Single particles >10-20 µm. | Bulk sample, typically mg quantities. |
| Quantification | Semi-quantitative (based on spectral libraries); particle count. | Absolutely quantitative (via internal standards like TMS). |
| Sample Prep | Minimal; filtration or direct measurement. | Requires polymer dissolution in suitable deuterated solvent (e.g., CDCl₃). |
| Throughput | High (automated mapping). | Low to moderate (per sample analysis). |
| Key Strength | Rapid, spatial, particle-level data. | Method-agnostic, structure-confident concentration data. |
Experimental Protocols
Protocol 1: FTIR Screening for Microplastics
- Objective: Identify and count microplastic particles in an environmental sample (e.g., filtered water).
- Methodology:
- Sample Preparation: Filter preconcentrated water sample onto an aluminum oxide or gold-coated membrane filter.
- Instrumentation: Use an FTIR microscope equipped with a focal plane array (FPA) detector.
- Measurement: Perform automated mapping of the filter surface in transmission or reflection mode (e.g., 4 cm⁻¹ resolution, 8x8 or 16x16 FPA configuration).
- Analysis: Process spectra against reference polymer libraries (e.g., siMPle, EuroCMS). Apply chemometric tools (e.g., Random Forest) for classification. Report particle counts and sizes per polymer type.
Protocol 2: NMR for Definitive Polymer Quantification
- Objective: Precisely determine the mass concentration of a specific polymer (e.g., polyethylene) in a bulk sample.
- Methodology:
- Sample Preparation: Digest/remove organic matter. Isolate a polymer-enriched fraction. Accurately weigh (~5-10 mg) and fully dissolve in 0.6 mL of deuterated 1,1,2,2-tetrachloroethane (TCE-d₂) at 120°C. Add a known amount of internal standard (e.g., 0.01% w/w Tetramethylsilane, TMS).
- Instrumentation: Use a high-field (≥400 MHz) NMR spectrometer with a temperature-controlled probe.
- Measurement: Acquire a quantitative ¹H NMR spectrum (90° pulse, relaxation delay ≥5*T1, 64-128 scans). Key polyethylene signal: -CH₂- at δ ~1.3 ppm.
- Quantification: Integrate polymer-specific signal and the internal standard signal (TMS at δ 0.0 ppm). Calculate polymer mass using the known mass and proton count of the standard.
Workflow Visualization: Integrated FTIR-NMR Analysis
Diagram Title: Integrated FTIR and NMR Analysis Workflow for Polymers
The Scientist's Toolkit: Essential Research Reagents & Materials
Table 2: Key Reagents and Materials for FTIR/NMR Polymer Analysis
| Item | Function | Typical Application |
|---|---|---|
| Aluminum Oxide Filters | Substrate for FTIR analysis; IR-transparent. | Filtering samples for FTIR microspectroscopy. |
| siMPle/EuroCMS Library | Reference spectral database. | Automated polymer identification from FTIR spectra. |
| Deuterated Solvents (e.g., TCE-d₂, CDCl₃) | NMR solvent provides a lock signal; minimizes interfering ¹H signals. | Dissolving polymers for quantitative ¹H NMR. |
| Quantitative NMR Internal Standard (e.g., TMS, Maleic Acid) | Reference compound with known protons and concentration. | Enabling absolute quantification of polymer concentration in NMR. |
| Temperature-Controlled Oven/Block | Heats sample vials for polymer dissolution. | Dissolving high-MW polymers (e.g., PE, PP) in NMR solvent. |
Conclusion
Both NMR and FTIR spectroscopy offer powerful, complementary pathways for microplastic quantification, yet they serve distinct roles in the researcher's toolkit. FTIR provides rapid, cost-effective polymer identification and mapping, ideal for screening and particle count analysis. In contrast, quantitative NMR delivers unparalleled accuracy for mass concentration in solution, excelling in validating findings and analyzing extracts from complex biological matrices. For robust biomedical research, a tiered approach—using FTIR for initial characterization and NMR for definitive, quantitative validation—may represent the gold standard. Future directions must focus on standardizing protocols across labs, developing certified reference materials for biological applications, and advancing high-throughput NMR to keep pace with the scale of the microplastic challenge. Ultimately, the choice between NMR and FTIR must align with the specific research question, required detection limits, sample complexity, and the critical need for either polymer identification or precise mass quantification.