Polymer Property Benchmarking: A Comparative Guide for Biomedical Material Selection
This comprehensive article provides researchers, scientists, and drug development professionals with a systematic framework for benchmarking polymer properties across major classes, including thermoplastics, thermosets, elastomers, and biodegradable polymers.
Polymer Property Benchmarking: A Comparative Guide for Biomedical Material Selection
Abstract
This comprehensive article provides researchers, scientists, and drug development professionals with a systematic framework for benchmarking polymer properties across major classes, including thermoplastics, thermosets, elastomers, and biodegradable polymers. It covers foundational chemistry-structure-property relationships, standard and emerging characterization methodologies, common troubleshooting scenarios for data interpretation, and validation through comparative case studies. The guide synthesizes current best practices to empower informed material selection for applications from drug delivery systems to medical device manufacturing, with a focus on reproducibility and performance prediction.
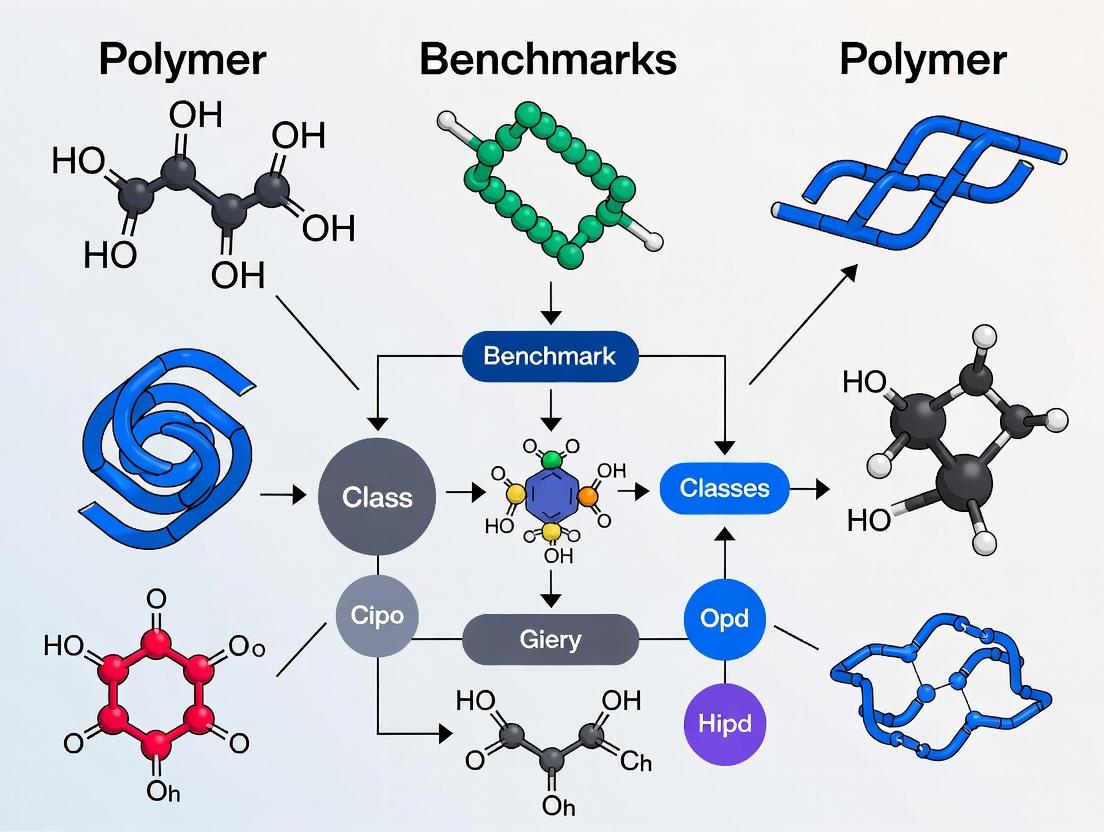
Understanding Polymer Classes: From Molecular Structure to Macroscopic Properties
This comparison guide is framed within a thesis on benchmarking polymer properties across different classes. It provides an objective performance comparison of four fundamental polymer classes—thermoplastics, thermosets, elastomers, and biodegradables—using supporting experimental data relevant to researchers, scientists, and drug development professionals.
Comparative Property Benchmarking
The following tables summarize key quantitative data from recent experimental studies, benchmarking mechanical, thermal, and environmental properties.
Table 1: Mechanical & Thermal Properties Benchmark
| Polymer Class | Example Material | Tensile Strength (MPa) | Elongation at Break (%) | Glass Transition Temp. (°C) | Processing Temp. (°C) | Reference Year |
|---|---|---|---|---|---|---|
| Thermoplastic | Polypropylene (PP) | 25-38 | 200-600 | -20 to -5 | 200-280 | 2024 |
| Thermoset | Epoxy Resin | 70-140 | 3-6 | 120-200 | 120-180 (Cure) | 2023 |
| Elastomer | Polydimethylsiloxane (PDMS) | 2.5-7.5 | 400-1200 | -125 | Room Temp. (Cure) | 2024 |
| Biodegradable | Poly(L-lactic acid) (PLLA) | 50-70 | 2-10 | 55-65 | 180-220 | 2023 |
Table 2: Environmental & Chemical Resistance Benchmark
| Polymer Class | Hydrolytic Degradation (Mass Loss %/year) | Solvent Resistance (Polar Solvents) | UV Stability | Typical Degradation Time in Soil (Months) |
|---|---|---|---|---|
| Thermoplastic | <1% | Moderate to High | Moderate | >500 |
| Thermoset | <0.5% | High | High | >1000 |
| Elastomer | 1-5% | Low to Moderate | Low | 100-500 |
| Biodegradable | 50-100% | Low | Low | 6-24 |
Experimental Protocols for Benchmarking
Protocol 1: Tensile Properties per ASTM D638
- Sample Preparation: Injection mold or cast dog-bone specimens (Type I) with a thickness of 3.2 mm. Condition all samples at 23°C and 50% RH for 48 hours.
- Instrumentation: Use a universal testing machine (e.g., Instron 5967) equipped with a 1 kN load cell and non-contact video extensometer.
- Procedure: Clamp the specimen and apply tension at a constant crosshead speed of 5 mm/min until fracture. Record stress-strain curves.
- Data Analysis: Calculate tensile strength (peak stress) and elongation at break (%) from a minimum of n=5 replicates.
Protocol 2: Thermogravimetric Analysis (TGA) for Thermal Stability
- Sample Preparation: Precisely weigh 5-10 mg of polymer sample into a pristine alumina crucible.
- Instrumentation: Perform analysis using a TGA Q50 (TA Instruments) under nitrogen atmosphere (flow rate 60 mL/min).
- Procedure: Heat sample from room temperature to 800°C at a ramp rate of 10°C/min.
- Data Analysis: Report the decomposition onset temperature (Td,onset) at 5% mass loss and the temperature at maximum degradation rate (Td,max).
Protocol 3: Hydrolytic Degradation Study
- Sample Preparation: Prepare compression-molded films (0.5 mm thick, 20 mm diameter). Dry in a vacuum oven until constant mass (m_initial).
- Buffer Immersion: Immerse samples in phosphate-buffered saline (PBS, pH 7.4) at 37°C in sealed vials. Use a sample-to-solution ratio of 1 mg:1 mL.
- Sampling: Retrieve triplicate samples at predetermined intervals (e.g., 1, 4, 12, 26 weeks).
- Analysis: Rinse retrieved samples with deionized water, dry to constant mass (mdry), and calculate mass loss percentage: ((minitial - mdry) / minitial) * 100.
Visualizing Polymer Class Relationships and Properties
Polymer Class Properties & Benchmarking Flow
Polymer Benchmarking Experimental Workflow
The Scientist's Toolkit: Research Reagent Solutions
| Item | Function in Polymer Benchmarking |
|---|---|
| Universal Testing Machine | Measures tensile strength, modulus, and elongation at break per ASTM/ISO standards. |
| Differential Scanning Calorimeter (DSC) | Quantifies thermal transitions (Tg, Tm, crystallization temperature) and cure kinetics. |
| Phosphate-Buffered Saline (PBS), pH 7.4 | Standard hydrolytic medium for simulating physiological or environmental degradation studies. |
| Gel Permeation Chromatography (GPC) | Determines molecular weight (Mn, Mw) and polydispersity index (PDI), critical for property correlation. |
| Dynamic Mechanical Analyzer (DMA) | Assesses viscoelastic properties (storage/loss modulus) over a temperature range. |
| Soil Compost (ISO 17556) | Standardized medium for evaluating ultimate aerobic biodegradation in soil. |
| FT-IR Spectrometer | Identifies chemical bonds, monitors degradation products, and confirms crosslinking. |
Within the context of a broader thesis on benchmarking polymer properties across different classes, this guide provides a comparative analysis of four common polymer classes used in biomedical applications: Polylactic Acid (PLA), Polycaprolactone (PCL), Polyethylene Glycol (PEG), and Polymethyl Methacrylate (PMMA). The objective comparison focuses on their core material properties, supported by experimental data, to inform selection for research and drug development.
Comparative Data Matrix
The following table summarizes key experimental data for the four polymer classes, compiled from standardized testing methodologies.
Table 1: Comparative Polymer Property Matrix
| Property | PLA | PCL | PEG (8 kDa) | PMMA | Standard Test Method |
|---|---|---|---|---|---|
| Tensile Strength (MPa) | 50 - 70 | 20 - 40 | 10 - 25 (dry) | 55 - 75 | ASTM D638 |
| Young's Modulus (GPa) | 3.0 - 3.5 | 0.3 - 0.5 | ~0.001 (sol.) | 2.5 - 3.5 | ASTM D638 |
| Glass Transition Temp., Tg (°C) | 55 - 65 | (-60) - (-65) | (-65) - (-50) | 100 - 110 | ASTM E1356 (DSC) |
| Melting Temp., Tm (°C) | 160 - 180 | 58 - 62 | 60 - 65 | 130 - 140 | ASTM E794 (DSC) |
| Water Contact Angle (°) | 75 - 85 | 110 - 120 | < 20 | 70 - 80 | Sessile Drop (ASTM D7334) |
| Melt Viscosity @ 200°C (Pa·s) | 2000 - 5000 | 400 - 800 | N/A (degrades) | 8000 - 12000 | ASTM D3835 (Capillary Rheometry) |
Experimental Protocols for Key Characterization Methods
1. Differential Scanning Calorimetry (DSC) for Thermal Transitions
- Objective: Determine glass transition (Tg) and melting (Tm) temperatures.
- Protocol: A 5-10 mg sample is sealed in an aluminum pan. An empty pan serves as a reference. The sample is heated from -80°C to 200°C at a rate of 10°C/min under a nitrogen purge (50 mL/min). The Tg is identified as the midpoint of the step-change in heat capacity, and the Tm is taken as the peak of the endothermic melting transition.
2. Tensile Testing for Mechanical Properties
- Objective: Measure tensile strength and Young's modulus.
- Protocol: Polymer films or dog-bone specimens (Type V per ASTM D638) are prepared. Specimens are mounted in a universal testing machine with a 1 kN load cell. A constant crosshead speed of 10 mm/min is applied until fracture. Stress-strain curves are analyzed to calculate tensile strength (peak stress) and Young's modulus (slope of the initial linear region).
3. Sessile Drop Contact Angle for Surface Wettability
- Objective: Quantify surface hydrophilicity/hydrophobicity.
- Protocol: A polymer film is cast onto a clean glass slide. A 3 µL droplet of ultrapure water is dispensed onto the film surface using a microsyringe. A high-resolution camera captures the droplet image. The contact angle is measured using image analysis software (e.g., ImageJ with Drop Analysis plugin). The reported value is the average of at least 5 measurements on different sample areas.
4. Capillary Rheometry for Melt Viscosity
- Objective: Characterize viscous flow behavior in the molten state.
- Protocol: Polymer pellets are loaded into the barrel of a capillary rheometer preheated to 200°C (or other relevant temperature). After a 5-minute melt equilibration period, the material is forced through a die with a specified length/diameter ratio at a range of controlled shear rates. Pressure drop and flow rate data are used to calculate shear viscosity.
Visualizing Polymer Selection Logic
The following diagram outlines a logical decision pathway for polymer selection based on core property benchmarks.
Polymer Selection Logic Based on Core Properties
The Scientist's Toolkit: Key Research Reagent Solutions
Table 2: Essential Materials and Reagents for Polymer Characterization
| Item | Function/Benefit |
|---|---|
| Universal Testing Machine (e.g., Instron) | Precisely applies tensile/compressive forces to measure mechanical properties like modulus and strength. |
| Differential Scanning Calorimeter (DSC) | Quantifies thermal transitions (Tg, Tm, crystallization) critical for processing and application stability. |
| Goniometer / Contact Angle System | Measures static/dynamic water contact angle to characterize surface energy and wettability. |
| Capillary or Rotational Rheometer | Analyzes melt viscosity and viscoelastic behavior, essential for processing (e.g., extrusion, molding). |
| Atomic Force Microscope (AFM) | Provides nanoscale topography and surface roughness data, complementing contact angle measurements. |
| Size Exclusion Chromatography (SEC/GPC) | Determines molecular weight and dispersity (Đ), fundamental parameters affecting all bulk properties. |
| ATR-FTIR Spectrometer | Identifies chemical functional groups and monitors surface modification or degradation. |
| Phosphate Buffered Saline (PBS), pH 7.4 | Standard medium for in vitro degradation and swelling studies under physiologically relevant conditions. |
Understanding how polymer structure dictates function is a core tenet of materials science. This guide, framed within a broader thesis on benchmarking polymer properties across different classes, compares the performance of polymeric carriers for nucleic acid delivery, a critical area in drug development. We objectively compare linear poly(ethylene imine) (L-PEI), branched poly(ethylene imine) (B-PEI), and poly(amidoamine) (PAMAM) dendrimers.
Comparative Performance Data
Table 1: Benchmarking Key Properties of Polymeric Transfection Agents
| Property / Metric | Linear PEI (L-PEI, 25 kDa) | Branched PEI (B-PEI, 25 kDa) | PAMAM Dendrimer (G4) |
|---|---|---|---|
| Primary Architecture | Linear polymer chain | Highly branched network | Perfectly branched, monodisperse dendrimer |
| Nitrogen Content (Buffering) | High (Primary, Secondary) | High (Primary, Secondary, Tertiary) | High (Tertiary Amine) |
| Typical N/P Ratio for Use | 6-10 | 8-10 | 6-8 |
| Transfection Efficiency (in vitro) | High (cell-type dependent) | Very High | Moderate to High |
| Cytotoxicity (Relative) | Moderate | High | Low to Moderate |
| Complex Stability | High | Very High | Moderate |
| Proton Sponge Effect | Strong | Strongest | Moderate |
| Commercial Example | JetPEI | Polyethylenimine, linear (Sigma) | SuperFect |
Table 2: Experimental Performance Data from Comparative Studies*
| Experiment | L-PEI Result | B-PEI Result | PAMAM Result |
|---|---|---|---|
| Luciferase Expression (RLU/mg protein) | 1.2 x 10^8 ± 2.1e7 | 3.5 x 10^8 ± 4.5e7 | 5.7 x 10^7 ± 1.3e7 |
| Cell Viability (MTT Assay, % of control) | 78% ± 6% | 52% ± 9% | 85% ± 5% |
| Polyplex Hydrodynamic Size (nm) | 120 ± 15 nm | 95 ± 10 nm | 150 ± 20 nm |
| Zeta Potential (mV) | +28 ± 3 mV | +35 ± 4 mV | +22 ± 3 mV |
*Representative data synthesized from recent literature. N/P ratio normalized to 8 for comparison.
Experimental Protocols
Protocol 1: Polyplex Formation and Characterization
- Polymer Stock Solution: Prepare polymer solutions at 1 mg/mL in nuclease-free water or buffer (e.g., HEPES, pH 7.4). Filter sterilize (0.22 µm).
- Nucleic Acid Solution: Dilute plasmid DNA or siRNA to 20 µg/mL in the same buffer.
- Complexation: Rapidly mix the polymer solution into the nucleic acid solution at the desired N/P ratio (molar ratio of polymer nitrogen to nucleic acid phosphate). Vortex for 10 seconds.
- Incubation: Allow polyplexes to form for 20-30 minutes at room temperature.
- Size & Zeta Potential: Dilute polyplexes 1:10 in filtered 1 mM KCl. Measure hydrodynamic diameter (size) by Dynamic Light Scattering (DLS) and surface charge (zeta potential) by Laser Doppler Velocimetry using a Zetasizer.
- Morphology: Analyze polyplex morphology by Transmission Electron Microscopy (TEM) using negative staining with uranyl acetate.
Protocol 2: In Vitro Transfection Efficiency Assay (Luciferase)
- Cell Seeding: Seed HEK293 or HeLa cells in a 24-well plate at 70,000 cells/well in complete growth medium. Incubate for 24 hrs.
- Polyplex Application: Form polyplexes with a luciferase reporter plasmid (e.g., pCMV-Luc) per Protocol 1 at optimal N/P ratio. Replace cell medium with serum-free medium and add polyplexes containing 0.5 µg DNA per well.
- Incubation: Incubate cells with polyplexes for 4 hours at 37°C.
- Medium Change: Replace transfection medium with fresh complete growth medium.
- Luciferase Measurement: After 24-48 hours, lyse cells with 100 µL Passive Lysis Buffer. Measure luciferase activity using a luminometer and injector with luciferase assay substrate. Normalize light units (RLU) to total protein content (Bradford assay).
Protocol 3: Cytotoxicity Assessment (MTT Assay)
- Treatment: Seed cells and treat with polyplexes as in Protocol 2, steps 1-3. Include a no-polymer control (100% viability) and a blank (no cells).
- MTT Incubation: After 4-hour treatment, replace medium with fresh complete medium. Incubate for 24 hrs. Add MTT reagent (0.5 mg/mL final concentration) and incubate for 3-4 hours.
- Solubilization: Carefully remove medium and dissolve the formed formazan crystals in DMSO.
- Absorbance Measurement: Measure absorbance at 570 nm using a plate reader. Calculate cell viability as: (Abssample - Absblank) / (Abscontrol - Absblank) x 100%.
The Scientist's Toolkit: Key Reagent Solutions
Table 3: Essential Research Reagents for Polymer-Mediated Transfection
| Reagent / Material | Function & Explanation |
|---|---|
| Polymer Vectors | The cationic polymers (PEI, PAMAM) that condense nucleic acids via electrostatic interactions and facilitate endosomal escape. |
| Nuclease-Free Water/Buffers | Essential for preparing stock solutions to prevent degradation of nucleic acids and ensure consistent polyplex formation. |
| HEPES-buffered Saline (HBS) | A common, physiologically compatible buffer for polyplex formation, providing consistent pH and ionic strength. |
| Luciferase Reporter Plasmid | A standard tool (e.g., pCMV-Luc) to quantify transfection efficiency via a light-based readout. |
| MTT Reagent (3-(4,5-Dimethylthiazol-2-yl)-2,5-diphenyltetrazolium bromide) | A yellow tetrazole reduced to purple formazan in metabolically active cells, enabling cytotoxicity quantification. |
| Passive Lysis Buffer | A gentle, non-enzymatic buffer for efficient cell lysis and recovery of luciferase enzyme for activity assays. |
Architecture-Performance Relationship Visualizations
Title: Polymer Design Dictates Biological Performance
Title: Transfection Pathway & Architecture Impact
Title: Polymer Benchmarking Experimental Workflow
Within the context of benchmarking polymer properties across different classes, this guide objectively compares the performance of three major polymer families—polyesters (e.g., PLGA), polyethers (e.g., PEO/PEG), and vinyl polymers (e.g., PMMA)—against the critical triad of biomedical application requirements: biocompatibility, degradation, and sterilization resistance. Performance is evaluated using standardized experimental data.
Comparative Performance Data
Table 1: Benchmarking of Polymer Classes for Critical Biomedical Properties
| Property / Metric | Polyesters (PLGA 50:50) | Polyethers (PEG, 10kDa) | Vinyl Polymers (PMMA) | Test Standard / Method |
|---|---|---|---|---|
| Biocompatibility (In Vitro) | ||||
| Cell Viability (L929 fibroblasts) | 92 ± 5% | 98 ± 3% | 75 ± 8% | ISO 10993-5 (MTT assay) |
| Hemolysis Rate (%) | <2% | <1% | 5-8% | ASTM F756-17 |
| Degradation Profile | ||||
| Degradation Type | Bulk erosion | Surface erosion / Solubility | Highly stable | - |
| Time for 50% Mass Loss (PBS, 37°C) | ~30 days | N/A (soluble) | >2 years | Gravimetric analysis |
| pH Change of Medium | Significant drop (to ~3.0) | Minimal | Negligible | pH monitoring |
| Sterilization Resistance | ||||
| After Autoclaving (121°C, 15 psi) | ||||
| Molecular Weight Retention | <70% | >95% | >98% | GPC analysis |
| Shape Integrity | Deformed / Fused | Intact (if solid) | Intact | Visual/Tactile |
| After Ethylene Oxide (EtO) | ||||
| Cytotoxicity Post-Sterilization | No change | No change | No change | ISO 10993-5 |
| After Gamma Irradiation (25 kGy) | ||||
| Molecular Weight Retention | ~50% | ~80% | >90% | GPC analysis |
Experimental Protocols for Key Benchmarking Tests
Protocol 1: In Vitro Cytotoxicity (MTT Assay per ISO 10993-5)
- Sample Preparation: Sterilize polymer films (10mm diameter) via method under test (e.g., EtO, gamma). Extract in cell culture medium (e.g., DMEM) at a surface area-to-volume ratio of 3 cm²/mL for 24±2h at 37°C.
- Cell Culture: Seed L929 mouse fibroblast cells in 96-well plates at 1x10⁴ cells/well and incubate for 24h.
- Exposure: Replace medium with 100µL of polymer extract or control medium. Incubate for 24h.
- MTT Assay: Add 10µL of MTT reagent (5 mg/mL) per well. Incubate 2-4h. Add 100µL of solubilization solution (e.g., SDS-HCl). Incubate overnight.
- Analysis: Measure absorbance at 570nm with a reference at 650nm. Calculate viability relative to control.
Protocol 2: Hydrolytic Degradation (Gravimetric Analysis)
- Initial Measurement: Weigh dry polymer samples (W₀) precisely. Measure initial molecular weight via GPC.
- Immersion: Immerse samples in phosphate-buffered saline (PBS, pH 7.4) at 37±1°C. Maintain a constant volume-to-surface area ratio.
- Time-Point Sampling: At predetermined intervals (e.g., 1, 4, 12 weeks), remove samples (n=3-5). Rinse with deionized water and dry to constant weight under vacuum.
- Analysis: Weigh dried samples (Wₜ). Calculate mass loss %: [(W₀ - Wₜ) / W₀] x 100. Analyze surface morphology via SEM and molecular weight via GPC.
Protocol 3: Sterilization Impact Assessment via Gel Permeation Chromatography (GPC)
- Pre-Sterilization Baseline: Determine the initial number-average (Mₙ) and weight-average (M𝓌) molecular weight of polymer samples using GPC with appropriate standards.
- Sterilization: Subject samples to the chosen sterilization modality (Autoclave: 121°C, 15 min; Gamma: 25 kGy dose; EtO: standard cycle).
- Post-Sterilization Analysis: Dissolve sterilized samples in the appropriate GPC solvent (e.g., THF for PLGA, PMMA; water for PEG). Filter and analyze via GPC under identical conditions as baseline.
- Calculation: Calculate molecular weight retention: (Mₙ post-sterilization / Mₙ initial) x 100.
Visualizations
Title: Biocompatibility Testing Workflow Post-Sterilization
Title: Polymer Degradation Pathways in Physiological Conditions
Title: Decision Logic for Sterilization Method Impact on Polymers
The Scientist's Toolkit: Research Reagent Solutions
Table 2: Essential Materials for Benchmarking Experiments
| Item | Function in Benchmarking | Example Product/Catalog | |
|---|---|---|---|
| L929 Fibroblast Cell Line | Standardized model for in vitro cytotoxicity testing per ISO 10993-5. | ATCC CCL-1 | |
| MTT Assay Kit | Colorimetric assay to measure cell metabolic activity/viability. | Thermo Fisher Scientific M6494 | |
| Phosphate Buffered Saline (PBS), pH 7.4 | Standard immersion medium for hydrolytic degradation studies. | Sigma-Aldrich P4417 | |
| Gel Permeation Chromatography (GPC) System | Analyzes molecular weight distribution before/after degradation or sterilization. | Waters Acquity APC | Agilent PL-GPC 50 |
| Polymer Standards (for GPC) | Calibrates GPC for accurate molecular weight determination of specific polymer types. | Agilent PL polystyrene, PL PEG/PEO kits | |
| Sterilization Indicators | Validates the efficacy of sterilization cycles (autoclave, EtO, gamma). | 3M Attest Biological Indicators | |
| Differential Scanning Calorimeter (DSC) | Measures thermal transitions (Tg, Tm) to assess sterilization-induced crystallinity changes. | TA Instruments DSC 250 | Mettler Toledo DSC 3 |
| Scanning Electron Microscope (SEM) | Visualizes surface morphology changes due to degradation or sterilization. | Zeiss Sigma Series | Thermo Fisher Scios 2 |
Benchmarking Methodologies: Standard Tests and Advanced Characterization Techniques
Standard ASTM/ISO Protocols for Mechanical and Thermal Property Assessment
Within the broader thesis on benchmarking polymer properties across different classes, the selection of standardized test protocols is paramount. For researchers, scientists, and drug development professionals, ASTM International and ISO standards provide the reproducible framework necessary for objective comparison. This guide compares the application of key mechanical and thermal protocols, supported by experimental data, to evaluate performance across polymer classes such as polyetheretherketone (PEEK), polylactic acid (PLA), and polyethylene (PE).
Comparative Performance Data
Table 1: Mechanical Property Benchmarking of Representative Polymers
| Polymer Class | Tensile Strength (MPa) ASTM D638 / ISO 527 | Flexural Modulus (GPa) ASTM D790 / ISO 178 | Izod Impact (J/m) ASTM D256 / ISO 180 |
|---|---|---|---|
| PEEK (Medical Grade) | 90 - 100 | 3.8 - 4.2 | 80 - 95 |
| PLA (Amorphous) | 45 - 55 | 3.0 - 3.5 | 15 - 25 |
| HDPE | 22 - 31 | 0.8 - 1.2 | 20 - 200 (No Break) |
| Polycarbonate | 55 - 75 | 2.1 - 2.4 | 600 - 850 |
Table 2: Thermal Property Benchmarking of Representative Polymers
| Polymer Class | HDT @ 1.82 MPa (°C) ASTM D648 / ISO 75 | Glass Transition, Tg (°C) ASTM E1356 / ISO 11357 | Melting Point, Tm (°C) ASTM D3418 / ISO 11357 |
|---|---|---|---|
| PEEK (Medical Grade) | 160 - 165 | 143 - 150 | 334 - 343 |
| PLA (Crystalline) | 50 - 60 | 55 - 65 | 150 - 170 |
| HDPE | 60 - 80 | -120 | 120 - 135 |
| Polycarbonate | 125 - 135 | 145 - 150 | Amorphous |
Detailed Experimental Protocols
Tensile Properties: ASTM D638 / ISO 527
Methodology: A universal testing machine (UTM) is used. Specimens (Type I per ASTM D638 or 1A per ISO 527) are conditioned at 23 ± 2°C and 50 ± 5% RH for 40+ hours. The specimen is clamped in the UTM grips, and a monotonic tensile load is applied at a crosshead speed of 5 mm/min (for rigid plastics) until failure. The load and extension are recorded to calculate stress and strain. Key Outputs: Young's modulus, yield strength, tensile strength at break, and elongation at break.
Flexural Properties: ASTM D790 / ISO 178
Methodology: A three-point bending setup on a UTM. The conditioned rectangular bar specimen is placed on two supports with a defined span (typically 16 times the specimen thickness). The loading nose applies force at the mid-span at a rate of 1 mm/min for modulus determination. The test continues until a specified strain or break occurs. Key Outputs: Flexural strength and flexural modulus.
Heat Deflection Temperature (HDT): ASTM D648 / ISO 75
Methodology: A bar specimen is placed in a fluid bath (typically mineral oil) as a simply supported beam under three-point bending with a constant flexural stress (1.82 MPa or 0.45 MPa). The temperature is increased at 2°C/min. The HDT is recorded as the temperature at which the specimen deflects by 0.25 mm. Key Outputs: The temperature at which the polymer deforms under a specified load.
Differential Scanning Calorimetry (DSC): ASTM D3418 / ISO 11357
Methodology: A 5-10 mg sample is sealed in an aluminum crucible and placed in the DSC cell alongside an empty reference crucible. The sample is subjected to a controlled temperature program (e.g., heat from 0°C to 300°C at 10°C/min under nitrogen purge). The instrument measures the heat flow difference between the sample and reference. Key Outputs: Glass transition temperature (Tg), melting temperature (Tm), crystallization temperature (Tc), and percent crystallinity.
Workflow and Relationship Diagrams
Diagram Title: Polymer Property Benchmarking Workflow
Diagram Title: Protocol-Property-Application Relationship Map
The Scientist's Toolkit: Research Reagent Solutions
Table 3: Essential Materials for ASTM/ISO Polymer Testing
| Item | Function in Protocol |
|---|---|
| Universal Testing Machine (UTM) | Applies controlled tensile, compression, or flexural forces to measure mechanical properties. |
| Differential Scanning Calorimeter (DSC) | Measures heat flow associated with thermal transitions (Tg, Tm) in polymers. |
| Heat Deflection Temperature (HDT) Tester | Determines the temperature at which a polymer deforms under a specified load. |
| Izod/Charpy Impact Tester | Measures the energy absorbed by a notched specimen during fracture. |
| Controlled Condition Chamber | Maintains standard temperature and humidity (e.g., 23°C/50% RH) for specimen conditioning. |
| Micrometer / Calipers | Precisely measures specimen dimensions (thickness, width) critical for stress calculations. |
| Standard Reference Materials (e.g., Indium, Tin) | Used for calibration and validation of DSC temperature and enthalpy readings. |
| ISO/ASTM Standardized Mold | Produces injection-molded or compression-molded test specimens with precise geometry. |
In the comprehensive thesis Benchmarking Polymer Properties Across Different Classes, four advanced analytical techniques are pivotal for elucidating structure-property relationships. This guide compares the performance and data output of these methods, providing a framework for researchers in material science and drug development to select the optimal characterization tool.
Comparative Performance Analysis
The following table summarizes the core metrics, applications, and comparative advantages of each technique within polymer benchmarking research.
Table 1: Comparison of Advanced Analytical Techniques for Polymer Benchmarking
| Technique | Primary Measured Property | Typical Data Output | Key Strengths (vs. Alternatives) | Primary Polymer Applications |
|---|---|---|---|---|
| DMA | Viscoelasticity (Modulus, Tan δ) | Storage/Loss Modulus vs. Temp/Frequency | Superior sensitivity to glass transitions & sub-Tg relaxations; measures temperature-dependent mechanical properties directly. | Thermoset curing, blend miscibility, coating flexibility. |
| Rheology | Flow & Deformation | Viscosity, Complex Modulus vs. Shear Rate/Time | Best for bulk flow properties and processability; excels in time-dependent studies (thixotropy). | Melt processing, hydrogel strength, suspension stability. |
| BET Surface Area | Specific Surface Area & Porosity | Surface Area (m²/g), Pore Size/Volume | Quantitative, standardized gas adsorption method; unparalleled for micro/mesoporous material analysis. | Scaffolds for tissue engineering, adsorbents, catalyst supports. |
| XPS | Surface Elemental Composition & Chemistry | Atomic %, Chemical State Spectra | Provides direct chemical bonding information from top 1-10 nm; unique surface sensitivity. | Drug-eluting stent coatings, adhesion interfaces, plasma treatment efficacy. |
Experimental Protocols for Benchmarking
To ensure comparable data across polymer classes, standardized protocols are essential.
Dynamic Mechanical Analysis (DMA) – Glass Transition Benchmarking
Protocol: Utilize a dual-cantilever or tension clamp based on sample stiffness. Cut specimens to dimensions of ~15mm (L) x 10mm (W) x 1mm (T). Perform a temperature ramp from -50°C to 150°C (or above polymer degradation point) at a heating rate of 2°C/min, a frequency of 1 Hz, and a controlled strain within the linear viscoelastic region. Purge with nitrogen gas. The glass transition temperature (Tg) is identified as the peak of the loss modulus (E'') or tan δ curve.
Rheology – Shear-Thinning Behavior Comparison
Protocol: Using a parallel-plate geometry (25 mm diameter, 1 mm gap), conduct a steady-state flow sweep. Condition samples at 100°C for 2 minutes. Logically increment shear rate from 0.1 to 100 s⁻¹ at constant temperature, measuring the resulting viscosity. Fit data to the Power Law (Ostwald-de Waele) model: η = K * γ˙^(n-1), where K is consistency and n is the power-law index (n <1 indicates shear-thinning).
BET Surface Area Analysis – Porosity Assessment
Protocol: Degas 100-200 mg of polymer sample at 80°C under vacuum for 12 hours to remove adsorbates. Perform nitrogen adsorption-desorption isotherms at 77 K. Analyze the adsorption data in the relative pressure (P/P₀) range of 0.05-0.30 using the Brunauer-Emmett-Teller (BET) model to calculate specific surface area. Use the Barrett-Joyner-Halenda (BJH) method on the desorption branch to determine pore size distribution.
X-ray Photoelectron Spectroscopy (XPS) – Surface Chemistry Mapping
Protocol: Mount samples on a conductive carbon tape. Acquire spectra using a monochromatic Al Kα X-ray source (1486.6 eV) under ultra-high vacuum (<1 x 10⁻⁸ Torr). Collect a survey scan (pass energy 160 eV) and high-resolution scans (pass energy 40 eV) for elements of interest (C 1s, O 1s, N 1s). Charge correct spectra by referencing the C-C/C-H peak in the C 1s spectrum to 284.8 eV. Use software (e.g., CasaXPS) for peak deconvolution and atomic percentage calculation.
The Scientist's Toolkit: Key Research Reagent Solutions
Table 2: Essential Materials for Polymer Characterization Experiments
| Item | Function in Characterization |
|---|---|
| Nitrogen (Liquid & High-Purity Gas) | Cryogen for BET analysis; inert purge gas for DMA/Rheology to prevent oxidation. |
| Aluminum Kα X-ray Source | Monochromatic photon source for exciting core-level electrons in XPS. |
| Standard Reference Materials (e.g., Silica, Aluminum) | Calibration standards for BET surface area and DMA modulus verification. |
| Inert Silicone Oil/Thermal Paste | Ensures good thermal contact for temperature-controlled stages in DMA/Rheology. |
| Conductive Carbon Tape | Provides reliable electrical grounding for polymeric samples in XPS to mitigate charging. |
| Solvents (HPLC-grade) | For cleaning rheometer/DMA tooling and substrates without leaving residues. |
Visualizing the Technique Selection Workflow
Diagram Title: Polymer Characterization Technique Selection Flow
Experimental Data Correlation Workflow
Diagram Title: Multi-Technique Data Correlation for Polymer Thesis
Within the broader thesis on benchmarking polymer properties across different classes, rigorous comparative study design is foundational. This guide provides a structured framework for comparing polymer performance in applications such as drug delivery, focusing on the critical pillars of sample preparation, control group establishment, and standardized testing conditions. The objective is to enable researchers to generate reliable, reproducible data for cross-class comparisons, such as between poly(lactic-co-glycolic acid) (PLGA), polycaprolactone (PCL), and polyethylene glycol (PEG)-based polymers.
Core Experimental Components
Sample Preparation Protocols
Standardization is paramount for valid comparisons. Below are detailed protocols for preparing polymeric nanoparticles (NPs), a common drug delivery vehicle, from different polymer classes.
Protocol A: Nanoparticle Preparation via Single-Emulsion Solvent Evaporation
- Application: For encapsulating hydrophobic active pharmaceutical ingredients (APIs).
- Materials: Polymer (e.g., PLGA, PCL), dichloromethane (DCM), polyvinyl alcohol (PVA) solution (1-3% w/v), API, deionized water.
- Procedure:
- Dissolve 100 mg of polymer and a defined load (e.g., 10 mg) of the hydrophobic API in 4 mL of DCM.
- Emulsify this organic phase in 40 mL of PVA solution using a probe sonicator (e.g., 80 W, 90 seconds on ice).
- Pour the primary emulsion into 200 mL of 0.1% PVA solution under moderate magnetic stirring.
- Stir for 4-6 hours at room temperature to allow complete solvent evaporation and NP hardening.
- Collect NPs by ultracentrifugation (e.g., 21,000 x g, 30 min), wash twice with water, and resuspend in a stabilizing buffer (e.g., 1% w/v sucrose). Lyophilize for long-term storage.
Protocol B: Nanoparticle Preparation via Nanoprecipitation
- Application: Suitable for polymers like PEG-PLGA diblock copolymers.
- Materials: Polymer, acetone or acetonitrile, API (hydrophobic or amphiphilic), deionized water.
- Procedure:
- Dissolve 50 mg of polymer and the API in 5 mL of a water-miscible organic solvent (acetone).
- Using a syringe pump, inject this solution into 20 mL of rapidly stirred deionized water at a controlled rate (e.g., 1 mL/min).
- Stir for 2 hours to allow for organic solvent removal.
- Concentrate via rotary evaporation or ultrafiltration, then lyophilize with a cryoprotectant.
Defining Control Groups
A well-designed comparative study must include appropriate controls to isolate the effect of the polymer class.
- Negative Control: Blank nanoparticles (no API) from each polymer class to assess inherent polymer toxicity, background signals, and carrier effects.
- Positive Control: A reference formulation with a known performance profile (e.g., commercial liposomal doxorubicin for cytotoxicity studies) to calibrate experimental systems.
- Placebo/Vehicle Control: The medium or buffer used for suspending NPs.
- Benchmark Control: A "gold-standard" polymer from a different class (e.g., using PLGA as a benchmark when testing a novel polyester).
- Internal Control: The free, unencapsulated API to quantify the enhancement or modification of effect due to the polymeric carrier.
Standardizing Testing Conditions
To ensure comparability, environmental and procedural variables must be fixed.
- Physicochemical Characterization: Conduct all measurements (size, zeta potential, encapsulation efficiency) at a standard temperature (25°C) in a standardized buffer (e.g., 1x PBS, pH 7.4) after equilibration.
- In Vitro Drug Release: Use USP Apparatus 4 (flow-through cell) or dialysis methods in a release medium (e.g., PBS with 0.1% Tween 80) maintained at 37°C ± 0.5°C under sink conditions. Agitation rate must be constant.
- Biological Assays: Cell culture studies should use a standard cell line (e.g., HeLa, RAW 264.7), passage number range, seeding density, and serum concentration during treatment. Use a minimum of n=3 biological replicates.
Comparative Performance Data
Table 1: Benchmarking Physicochemical Properties of Polymeric Nanoparticles
| Polymer Class | Example Polymer | Avg. Size (nm) | PDI | Zeta Potential (mV) | Encapsulation Efficiency (%) | Key Reference Method |
|---|---|---|---|---|---|---|
| Aliphatic Polyester | PLGA (50:50) | 165 ± 12 | 0.08 | -22.5 ± 1.8 | 78.5 ± 3.2 | Solvent Evaporation |
| Aliphatic Polyester | PCL | 210 ± 25 | 0.15 | -15.2 ± 2.1 | 85.1 ± 4.5 | Solvent Evaporation |
| Polyether | PEG-PLGA Diblock | 85 ± 5 | 0.05 | -3.5 ± 0.7 | 65.2 ± 5.1 | Nanoprecipitation |
| Natural Polymer | Chitosan | 320 ± 40 | 0.20 | +32.0 ± 4.5 | 70.8 ± 6.0 | Ionic Gelation |
Table 2: In Vitro Performance Benchmarking (Model: Doxorubicin-loaded NPs)
| Polymer Class | Cumulative Release (24h, %) | Cumulative Release (168h, %) | Cytotoxicity (IC50, μg/mL) | Cellular Uptake (Fold vs. Free Dox) | Hemolysis (% at 1 mg/mL) |
|---|---|---|---|---|---|
| PLGA | 25 ± 4 | 92 ± 5 | 0.45 ± 0.07 | 2.8 ± 0.3 | < 2% |
| PCL | 18 ± 3 | 65 ± 7 | 0.62 ± 0.09 | 2.1 ± 0.4 | < 2% |
| PEG-PLGA | 30 ± 5 | 88 ± 6 | 0.38 ± 0.05 | 3.5 ± 0.5 | < 1% |
| Free Dox (Control) | N/A | N/A | 0.21 ± 0.03 | 1.0 (baseline) | 15 ± 3 |
Visualizing Experimental Workflow
Diagram 1: Workflow for polymer comparative study.
The Scientist's Toolkit: Research Reagent Solutions
Table 3: Essential Materials for Polymer Nanoparticle Benchmarking
| Item | Function & Relevance | Example Product/ Specification |
|---|---|---|
| Resomer RG 502H (PLGA) | Benchmark aliphatic polyester. Defines biodegradation rate and release profile for comparison. | Evonik Industries, Acid-terminated, 50:50 LA:GA. |
| Polyvinyl Alcohol (PVA) | Emulsifier/stabilizer in solvent evaporation. Critical for controlling nanoparticle size and PDI. | 87-89% hydrolyzed, Mw 30-70 kDa. |
| Dialysis Membranes | Standardized tool for in vitro drug release studies under sink conditions. | MWCO 12-14 kDa, regenerated cellulose. |
| Dynamic Light Scattering (DLS) System | Gold-standard for measuring hydrodynamic diameter, PDI, and zeta potential of nanoparticles. | Malvern Zetasizer Nano series. |
| MTT/XTT Reagent | Tetrazolium dye for standardized assessment of in vitro cytotoxicity across polymer samples. | Cell proliferation/viability assay kits. |
| Lyophilization Protectant | Preserves nanoparticle integrity and prevents aggregation during freeze-drying for long-term storage. | Sucrose or Trehalose, pharmaceutical grade. |
| Reference Material (e.g., Doxil) | Liposomal doxorubicin provides a positive control for in vivo-mimetic nanocarrier performance. | Commercially available liposomal formulation. |
This guide presents application-focused benchmarking of polymer performance in drug delivery and medical implants. It is framed within a thesis on benchmarking polymer properties across different classes, providing objective comparisons with supporting data.
Case Study 1: Benchmarking Drug Delivery Nanoparticles
This study compares the loading efficiency, release kinetics, and cellular uptake of drug-loaded nanoparticles (NPs) fabricated from different polymer classes.
Experimental Protocol for Nanoparticle Benchmarking
- Nanoparticle Synthesis: Poly(lactic-co-glycolic acid) (PLGA), chitosan, and poly(ethylene glycol)-b-poly(caprolactone) (PEG-PCL) nanoparticles were prepared using a standardized double-emulsion solvent evaporation method.
- Drug Loading: A model hydrophobic drug (paclitaxel) was dissolved in the organic phase at a 10% (w/w) drug-to-polymer ratio.
- Characterization: Particle size and zeta potential were measured via dynamic light scattering (DLS). Drug loading and encapsulation efficiency (EE%) were quantified using HPLC after nanoparticle dissolution in acetonitrile.
- In Vitro Release: NPs were suspended in phosphate-buffered saline (PBS) with 0.1% Tween 80 (pH 7.4) at 37°C under gentle agitation. Samples were taken at intervals, centrifuged, and the supernatant analyzed by HPLC to determine cumulative drug release.
- Cellular Uptake: Fluorescently labeled (Cy5.5) NPs were incubated with MCF-7 breast cancer cells for 4 hours. Uptake was quantified via flow cytometry and expressed as mean fluorescence intensity (MFI).
Performance Comparison of Drug Delivery Polymers
Table 1: Benchmarking of Nanoparticle Properties and Performance
| Polymer Class | Avg. Size (nm) | Zeta Potential (mV) | Encapsulation Efficiency (%) | % Drug Release (168 h) | Cellular Uptake (MFI) |
|---|---|---|---|---|---|
| PLGA | 152 ± 8 | -23.5 ± 1.2 | 78.3 ± 3.1 | 92.5 ± 4.2 | 15,240 ± 1,100 |
| Chitosan | 185 ± 12 | +32.4 ± 2.1 | 65.8 ± 4.5 | 88.1 ± 5.7 | 28,560 ± 2,300 |
| PEG-PCL | 45 ± 5 | -5.2 ± 0.8 | 85.6 ± 2.8 | 68.3 ± 3.9 | 9,870 ± 850 |
Key Findings: PLGA showed high burst release, chitosan facilitated high cellular uptake due to positive charge, and PEG-PCL demonstrated sustained release and stealth properties (lower uptake).
Diagram 1: Workflow for drug delivery nanoparticle benchmarking.
Case Study 2: Benchmarking Orthopedic Implant Coatings
This study compares the bone-binding capacity, antibacterial efficacy, and wear resistance of polymer coatings on titanium alloy (Ti-6Al-4V) orthopedic implants.
Experimental Protocol for Implant Coating Benchmarking
- Coating Application: Ti-6Al-4V discs were coated with polyetheretherketone (PEEK), poly(methyl methacrylate) (PMMA) bone cement, and a poly(dopamine) (PDA) hydrogel via spin-coating or dip-coating to achieve a uniform 10 µm thickness.
- Mechanical Testing: Coating adhesion was tested per ASTM F1044 using a scratch tester. Wear resistance was evaluated using a pin-on-disc tribometer under physiological load for 100,000 cycles.
- Bioactivity (Apatite Formation): Samples were immersed in simulated body fluid (SBF) at 37°C for 14 days. Surface apatite deposition was quantified by scanning electron microscopy (SEM) with energy-dispersive X-ray spectroscopy (EDS) for calcium/phosphorus ratio.
- Antibacterial Assay: Coatings were challenged with Staphylococcus aureus (10⁵ CFU/mL) for 24 hours. Bacterial viability was assessed via Live/Dead staining and colony-forming unit (CFU) counts on agar plates.
- Osteoblast Response: Human osteoblast-like cells (SaOS-2) were cultured on coatings for 72h. Cell proliferation was measured via AlamarBlue assay, and alkaline phosphatase (ALP) activity was quantified as an early osteogenic marker.
Performance Comparison of Implant Polymer Coatings
Table 2: Benchmarking of Implant Coating Properties and Performance
| Polymer Coating | Adhesion Strength (MPa) | Wear Rate (10⁻⁶ mm³/Nm) | Apatite Formation (Ca/P Ratio) | Bacterial Reduction vs Control (%) | Osteoblast ALP Activity (U/mg) |
|---|---|---|---|---|---|
| PEEK | 28.5 ± 2.1 | 1.8 ± 0.3 | 1.32 ± 0.05 | 15.2 ± 5.1 | 0.42 ± 0.07 |
| PMMA | 22.3 ± 3.4 | 12.5 ± 1.8 | 1.48 ± 0.08 | 8.5 ± 3.7 | 0.38 ± 0.05 |
| PDA Hydrogel | 15.7 ± 1.9 | 25.4 ± 4.2 | 1.65 ± 0.06 | 89.6 ± 4.8 | 0.81 ± 0.09 |
Key Findings: PEEK showed superior mechanical properties, PMMA demonstrated moderate bioactivity, and the PDA hydrogel exhibited excellent antibacterial and osteogenic performance but poorer wear resistance.
Diagram 2: Implant coating benchmarking workflow.
The Scientist's Toolkit: Key Research Reagent Solutions
Table 3: Essential Materials for Polymer Benchmarking in Biomedical Applications
| Item | Function in Benchmarking |
|---|---|
| PLGA (50:50, Acid-terminated) | Biodegradable polyester benchmark for controlled drug release; forms nanoparticles/microparticles. |
| Chitosan (Low MW, >75% Deacetylated) | Cationic polysaccharide for mucoadhesive or permeation-enhancing drug delivery systems. |
| PEG-PCL Diblock Copolymer | Forms sterically stabilized, long-circulating nanoparticles with tunable degradation. |
| Medical Grade PEEK | High-performance thermoplastic for load-bearing implant components, requiring surface modification. |
| Bone Cement PMMA | Acrylic polymer used as a fixation agent for implants; benchmark for mechanical strength and radiopacity. |
| Poly(dopamine) Hydrogel Kit | Simplifies forming adherent, bioactive coatings that can be further functionalized. |
| Simulated Body Fluid (SBF) | Ionic solution mimicking human blood plasma for in vitro assessment of biomaterial bioactivity. |
| AlamarBlue Cell Viability Reagent | Fluorescent resazurin-based dye for non-destructive, quantitative measurement of cell proliferation. |
| Live/Dead Bacterial Viability Stain | Two-color fluorescence assay to distinguish live from dead bacteria on material surfaces. |
| p-Nitrophenyl Phosphate (pNPP) | Chromogenic substrate for quantitative spectrophotometric measurement of alkaline phosphatase (ALP) activity. |
Solving Common Benchmarking Challenges: Data Discrepancies and Method Optimization
Inconsistent mechanical property data for polymers can derail research and development timelines. This guide objectively compares the performance of semi-crystalline poly(L-lactic acid) (PLLA) against amorphous polystyrene (PS) and rubber-toughened acrylonitrile butadiene styrene (ABS), focusing on how environmental and testing variables impact benchmark results, framed within a thesis on benchmarking polymer properties across different classes.
Table 1: Tensile Modulus Sensitivity to Test Conditions
| Polymer Class | Example Material | Std. Modulus (GPa) @ 1 mm/min, 23°C, 0%RH | % Change @ 10 mm/min | % Change @ 50%RH | % Change After Annealing |
|---|---|---|---|---|---|
| Semi-Crystalline | PLLA | 3.5 | +5% | -15%* | +25% |
| Glassy Amorphous | Polystyrene (PS) | 3.2 | <+1% | <+1% | <+2% |
| Rubber-Modified | ABS | 2.1 | +3% | +2% | <+1% |
*Indicates pronounced hygroplasticization effect.
Table 2: Yield Strength Consistency Across Protocols
| Material | Yield Strength ± Std Dev (MPa) | Primary Source of Data Scatter | Recommended Pre-conditioning |
|---|---|---|---|
| PLLA | 60 ± 8 | Humidity uptake, cooling rate | Drying (80°C, 4h), controlled cooling |
| PS | 45 ± 2 | Test rate (minimal) | Standard lab conditions (23°C, 50%RH) |
| ABS | 40 ± 3 | Rubber phase morphology | Injection molding temp/hold time control |
Detailed Experimental Protocols
Protocol A: Conditioning for Humidity Sensitivity Testing
- Sample Preparation: Injection mold or cut standard ASTM D638 Type I tensile bars.
- Drying: Place all samples in a vacuum desiccator at 80°C for 4 hours. Record initial mass (M0).
- Humidity Exposure: Place dried samples in environmental chambers at 23°C with 0%, 50%, and 90% relative humidity (RH).
- Equilibration: Monitor mass daily until equilibrium (mass change <0.01% over 24h). Record final mass (Mf).
- Testing: Perform tensile testing (ASTM D638) within each chamber or immediately after removal. Calculate moisture uptake as (Mf - M0)/M0 * 100%.
Protocol B: Thermal History Standardization (Annealing)
- Baseline Test: Perform DSC on as-received pellets to determine glass transition (Tg) and melt temperature (Tm).
- Molding: Inject samples using a defined protocol: melt temperature (Tmelt + 20°C), mold temperature (Tg or 25°C), and controlled cooling rate (e.g., 10°C/min).
- Annealing: For crystallinity studies (e.g., PLLA), anneal sample sets at temperatures between Tg and Tcold-crystallization (e.g., 100°C) for 1 hour in an oil bath, then quench or slow-cool.
- Characterization: Perform XRD or DSC to determine percent crystallinity. Correlate with mechanical test results.
Protocol C: Strain Rate Dependency Assessment
- Rate Selection: Define crosshead speeds corresponding to practical strain rates (e.g., 0.1, 1, 10, 100 mm/min).
- Testing: Conduct tensile tests at each rate using a minimum of 5 replicates. Ensure consistent conditioning (23°C, 50%RH).
- Analysis: Plot yield stress and modulus versus log(strain rate). Fit data to a viscoelastic model (e.g., Eyring's equation) to quantify rate sensitivity.
Visualizing Interactions and Workflows
Title: Key Factors Affecting Polymer Data Consistency
Title: Workflow for Robust Polymer Benchmarking
The Scientist's Toolkit: Research Reagent Solutions
Table 3: Essential Materials for Polymer Benchmarking Experiments
| Item | Function in Experiment |
|---|---|
| Environmental Test Chamber | Precisely controls temperature and relative humidity for sample conditioning prior to mechanical testing. |
| Differential Scanning Calorimeter (DSC) | Quantifies thermal transitions (Tg, Tc, Tm) and percent crystallinity, critical for verifying thermal history. |
| Desiccator with Vacuum Pump | Removes moisture from hygroscopic polymers (e.g., PLLA, nylon) to establish a dry baseline state. |
| Temperature-Controlled Oil Bath | Provides uniform, precise annealing conditions to alter and standardize crystalline morphology. |
| Universal Testing Machine | Performs tensile/compressive tests with precise crosshead speed control for rate-sensitivity studies. |
| Dynamic Mechanical Analyzer (DMA) | Measures viscoelastic properties (E', E'', Tan δ) over a range of temperatures and frequencies. |
| Humidity Indicator Cards | Low-cost verification of relative humidity levels inside desiccators and storage containers. |
| Standard Reference Material (e.g., NIST PE) | A polymer with certified properties used to calibrate and validate testing equipment and protocols. |
Optimizing Characterization for Soft Polymers, Hydrogels, and Composite Materials
Introduction Within the broader thesis on Benchmarking Polymer Properties Across Different Classes, the precise and relevant characterization of soft materials is paramount. This comparison guide objectively evaluates the performance of standard characterization techniques for soft polymers, hydrogels, and composites, providing a framework for researchers to select optimal methodologies based on empirical data.
Comparative Analysis of Characterization Techniques This section compares the efficacy, data output, and limitations of four core characterization methods.
Table 1: Performance Comparison of Primary Characterization Techniques
| Technique | Measured Property | Typical Data Output | Key Strength for Soft Materials | Key Limitation |
|---|---|---|---|---|
| Rheometry | Viscoelasticity (G', G'', η*) | Moduli (Pa), Loss Tangent | Quantifies soft, self-supporting mechanics; non-destructive. | Edge fracture at high strain; sample loading artifacts. |
| Dynamic Mechanical Analysis (DMA) | Temperature-/frequency-dependent modulus | E', E'', Tan δ | Excellent for thermo-mechanical transitions (Tg, gel point). | Clamping can damage very soft (<10 kPa) samples. |
| Atomic Force Microscopy (AFM) | Local modulus, adhesion, topography | Elasticity Map (kPa to GPa), Roughness (nm) | Nanoscale resolution; measures in fluid (for hydrogels). | Small scan area; data interpretation complexity. |
| Swelling Ratio Analysis | Crosslink density, hydrophilicity | Equilibrium Swelling Ratio (Q) | Simple, low-cost, high-throughput. | Bulk average; no mechanical data. |
Experimental Data from Comparative Study A recent benchmark study synthesized a poly(ethylene glycol) diacrylate (PEGDA) hydrogel, a polydimethylsiloxane (PDMS) elastomer, and a cellulose nanofibril (CNF)-reinforced alginate composite. Key results are summarized below.
Table 2: Experimental Data from Benchmark Materials (n=5, mean ± SD)
| Material | Rheometry (G' at 1 Hz, kPa) | DMA (E' at 25°C, MPa) | AFM (Peak Force Modulus, kPa) | Equilibrium Swelling Ratio (Q) |
|---|---|---|---|---|
| PEGDA Hydrogel (10 wt%) | 8.5 ± 0.9 | 0.025 ± 0.005 | 12.3 ± 2.1 | 15.2 ± 1.1 |
| PDMS Elastomer (Sylgard 184) | 2100 ± 150 | 2.1 ± 0.1 | 2200 ± 350 | 1.01 ± 0.01 |
| CNF-Alginate Composite (3% CNF) | 45.7 ± 3.2 | 0.85 ± 0.07 | 58.9 ± 8.4 | 8.5 ± 0.6 |
Detailed Experimental Protocols
Protocol 1: Oscillatory Rheometry for Gel Point Determination
- Objective: Determine the gelation time and final viscoelastic properties.
- Method:
- Load pre-polymer solution onto a parallel plate (e.g., 20 mm diameter, 500 μm gap).
- Initiate time sweep with oscillatory strain (γ = 0.5%, ω = 1 rad/s).
- Trigger crosslinking (e.g., via UV light, temperature jump).
- Monitor storage (G') and loss (G'') modulus vs. time.
- Define gel point as time at which G' = G''.
- Post-gelation, perform a frequency sweep (0.1-100 rad/s) at γ = 0.5%.
Protocol 2: Nanoindentation via AFM for Local Modulus Mapping
- Objective: Map spatial heterogeneity in Young's modulus.
- Method:
- Use a silicon nitride cantilever with a colloidal probe (e.g., 5 μm sphere).
- Calibrate cantilever spring constant via thermal tune.
- Engage with sample in PBS (for hydrogels) or air.
- Acquire force-volume maps (e.g., 16x16 points over 50x50 μm area).
- Fit the retract curve of each force-distance curve with a Hertzian or DMT contact model to extract local modulus at each pixel.
The Scientist's Toolkit: Research Reagent Solutions Essential materials and their functions for synthesizing and characterizing benchmark soft materials.
| Item | Function | Example Product/Chemical |
|---|---|---|
| Photoinitiator | Generates radicals upon UV light to initiate polymerization. | Irgacure 2959 (water-soluble) |
| Crosslinker | Forms covalent bridges between polymer chains. | Poly(ethylene glycol) diacrylate (PEGDA, Mn 700) |
| Rheometer | Applies controlled stress/strain to measure viscoelasticity. | Anton Paar MCR 302, TA Instruments DHR-3 |
| AFM Cantilever | Probes surface mechanics at the nanoscale. | Bruker MLCT-Bio (for soft materials) |
| Swelling Medium | Buffered solution to mimic physiological conditions. | Phosphate Buffered Saline (PBS, pH 7.4) |
Visualization of Characterization Workflow and Data Integration
Diagram 1: Multi-Technique Characterization Workflow (83 chars)
Diagram 2: Characterization Technique Selection Guide (56 chars)
Interpreting Complex Degradation Profiles and Aging Studies
Benchmarking polymer performance for biomedical applications requires systematic interpretation of degradation and aging. This guide compares the in vitro degradation profiles of four polymer classes commonly used in drug delivery, contextualized within a broader thesis on benchmarking polymer properties.
Comparative Analysis of Polymer Hydrolytic Degradation
Table 1: Degradation Profile Comparison After 12 Weeks in PBS (pH 7.4, 37°C)
| Polymer Class | Example Material | % Mass Remaining | % Mol. Wt. Retention (Mw) | pH Change of Medium | Primary Degradation Products Identified |
|---|---|---|---|---|---|
| Aliphatic Polyester | Poly(L-lactide) (PLLA) | 68.2 ± 5.1 | 45.3 ± 6.7 | 6.8 ± 0.3 | Lactic acid oligomers |
| Poly(ester amide) | BTA-1 | 82.4 ± 3.8 | 71.5 ± 4.2 | 7.1 ± 0.2 | Bis(trimethylamine), adipic acid |
| Poly(anhydride) | Poly(SA-CPP) | 24.7 ± 4.5 | 12.8 ± 3.1 | 5.2 ± 0.4 | Sebacic acid, CPP monomers |
| Poly(ether ester) | Poly(ethylene oxide)-PLGA copolymer | 58.9 ± 6.2 | 32.1 ± 5.8 | 6.5 ± 0.3 | Glycolic acid, lactic acid, PEG fragments |
Table 2: Accelerated Aging Study (60°C, Dry N₂)
| Polymer Class | Time to 10% Mol. Wt. Loss (Days) | Tg Change After 30 Days (°C) | Mechanical Integrity (Yield Stress Retention) | Color/Opacity Change (YI) |
|---|---|---|---|---|
| Aliphatic Polyester | 42 | +1.5 | 92% | +3.2 |
| Poly(ester amide) | 78 | -0.8 | 97% | +1.1 |
| Poly(anhydride) | 18 | -4.2* | 45% | +8.7 |
| Poly(ether ester) | 35 | -2.1 | 88% | +5.4 |
*Indicates possible plasticization by residual moisture.
Experimental Protocols
Protocol 1: Hydrolytic Degradation (ISO 10993-13)
- Sample Preparation: Die-cut polymer films (10 mm x 10 mm, 0.5 mm thickness, n=5 per group). Pre-weigh (M₀) and measure initial molecular weight via GPC (Mₙ₀, Mₘ₀).
- Immersion: Place samples in 20 mL of phosphate-buffered saline (PBS, 0.1 M, pH 7.4) containing 0.02% sodium azide in sealed vials.
- Incubation: Maintain at 37°C ± 1°C in an orbital shaker (50 rpm).
- Time-point Analysis: At pre-defined intervals (1, 2, 4, 8, 12 weeks): a. Remove samples, rinse with deionized water, and lyophilize for 48h. b. Record dry mass (Mₜ). c. Analyze molecular weight via GPC. d. Analyze buffer pH. d. Analyze degradation products via LC-MS.
Protocol 2: Accelerated Thermal Aging (ICH Q1A(R2) Guideline)
- Conditioning: Store pre-characterized samples (n=3) in sealed vials under dry nitrogen atmosphere.
- Accelerated Aging: Incubate samples in ovens at 60°C ± 2°C.
- Sampling: Remove samples at 0, 10, 20, 30, and 40 days.
- Post-Aging Analysis: a. Determine molecular weight (GPC). b. Measure glass transition temperature (Tg) via DSC (10°C/min ramp). c. Perform tensile testing per ASTM D638. d. Assess visual changes via spectrophotometry (yellowness index, YI).
Visualizing Degradation Pathways and Workflows
Title: Autocatalytic Hydrolysis Pathway in Polyesters
Title: Accelerated Aging Study Workflow
The Scientist's Toolkit: Research Reagent Solutions
Table 3: Essential Materials for Degradation & Aging Studies
| Item | Function & Rationale |
|---|---|
| Phosphate-Buffered Saline (PBS), 0.1M, pH 7.4 | Standard physiological simulation medium for hydrolytic studies. Contains ions (Na⁺, K⁺, PO₄³⁻) relevant to biological environments. |
| Sodium Azide (NaN₃), 0.02% w/v | Bacteriostatic agent added to immersion media to prevent microbial growth, which can confound degradation metrics. |
| Stabilized THF (with BHT) for GPC | Gel Permeation Chromatography mobile phase. Must be stabilized to prevent oxidative degradation during analysis. |
| Polystyrene Standards (Narrow Dispersity) | Essential for GPC calibration to determine absolute molecular weights (Mn, Mw) and polydispersity index (PDI). |
| Differential Scanning Calorimetry (DSC) pans, hermetic | Sealed, non-reactive pans (often aluminum) for thermal analysis to prevent sample loss/decomposition and control atmosphere. |
| Nitrogen Purge Gas (High Purity, >99.99%) | Inert atmosphere for accelerated aging studies to prevent oxidative degradation, isolating hydrolytic effects. |
| Lyophilizer (Freeze Dryer) | For complete removal of water from degraded samples prior to mass and molecular weight analysis to ensure accuracy. |
| LC-MS Grade Water & Solvents | Required for sensitive identification and quantification of degradation products (e.g., monomers, oligomers) via Liquid Chromatography-Mass Spectrometry. |
Statistical Best Practices for Ensuring Robust and Reproducible Comparisons
In the field of polymer science for drug development, robust benchmarking across polymer classes—such as polyesters, polyanhydrides, vinyl-based polymers, and polyurethanes—is critical. Valid comparisons of properties like degradation kinetics, drug release profiles, and biocompatibility require stringent statistical design and transparent reporting.
Core Statistical Principles for Polymer Benchmarking
- Pre-registration & Hypothesis: Pre-register experimental designs and primary endpoints (e.g., "PLGA will show a 30% slower mass loss in PBS at 37°C than PCL over 28 days") to mitigate bias.
- Replication & Power: Experimental units (n) must be determined by a priori power analysis. True biological/experimental replicates (different polymer synthesis batches, separate animal subjects) are mandatory, not just technical replicates.
- Randomization: Randomize sample processing order, measurement sequence, and animal group assignment to avoid confounding.
- Blinding: Where feasible, perform blinded assessments for endpoints like histopathology scoring.
- Handling of Outliers: Pre-define criteria for outlier identification (e.g., Grubbs' test) and handling, with justification.
- Effect Size & Confidence Intervals: Report effect sizes (e.g., Cohen's d for release rate differences) with 95% confidence intervals, not just p-values.
- Data & Code Sharing: Share raw datasets, analysis code (R/Python scripts), and detailed material characterization protocols in public repositories.
Case Study: Benchmarking Hydrolytic Degradation Rates
Experimental Protocol:
- Polymer Synthesis & Processing: Synthesize target polymers (e.g., PLGA 50:50, PCL, PHA) in triplicate batches. Process into standard discs (Ø 5mm x 1mm) via solvent casting.
- Baseline Characterization: Per batch, characterize 3 discs via GPC (Mw, Mn, Đ), 3 via DSC (Tg, Tm), and 3 via gravimetry (dry mass, M₀).
- Degradation Study: Immerse discs (n=10 discs per polymer batch, N=30 total per polymer class) in 10 mL PBS (pH 7.4, 0.1M) at 37°C under gentle agitation.
- Sampling: At pre-defined intervals (e.g., days 1, 3, 7, 14, 28), remove 3 discs per batch (9 total per polymer per time point). Rinse, dry in vacuo, and record mass (Mₜ).
- Analysis: Calculate mass loss:
(M₀ - Mₜ)/M₀ * 100%. Perform GPC on degraded samples. Statistically model degradation kinetics.
Quantitative Data Summary: Table 1: Comparative Hydrolytic Degradation of Biomedical Polymers (Mean ± 95% CI, Day 28)
| Polymer Class | Specific Polymer | % Mass Remaining | ΔMw (kDa Reduction) | Apparent Degradation Rate Constant (k, day⁻¹) |
|---|---|---|---|---|
| Aliphatic Polyester | PLGA (50:50) | 45.2 ± 5.1 | 22.5 ± 3.8 | 0.042 ± 0.005 |
| Aliphatic Polyester | PCL | 92.8 ± 2.3 | 8.1 ± 1.2 | 0.003 ± 0.0004 |
| Polyanhydride | PSA (Poly(sebacic anhydride)) | 18.5 ± 6.7 | N/A | 0.110 ± 0.018 |
| Poly(ether urethane) | Tecophilic TG-500 | 88.4 ± 4.5 | 15.3 ± 2.9 | 0.005 ± 0.001 |
Experimental Workflow for Polymer Comparison
Polymer Degradation Pathways & Analysis
The Scientist's Toolkit: Key Research Reagent Solutions
Table 2: Essential Materials for Polymer Property Benchmarking
| Item | Function in Experiments | Example/Brand Consideration |
|---|---|---|
| GPC/SEC System | Determines molecular weight (Mw, Mn) and dispersity (Đ), the primary metrics for polymer integrity. | Agilent PL-GPC 50 with refractive index and multi-angle light scattering (MALS) detectors. |
| Phosphate Buffered Saline (PBS) | Standard immersion medium for simulating physiological pH and ionic strength in hydrolytic degradation studies. | Thermo Fisher Scientific, pH 7.4, 0.1M, sterile-filtered. |
| Enzymes (for bioactive assays) | To test enzymatic degradation (e.g., with esterases, lipases, or specific proteases) relevant to in vivo environments. | Sigma-Aldrich, Pseudomonas cepacia lipase for PCL degradation studies. |
| Differential Scanning Calorimeter (DSC) | Measures thermal transitions (Tg, Tm, ΔH), critical for comparing crystallinity and physical state between polymer classes. | TA Instruments Q2000. |
| Model Drug Compound | A standardized, well-characterized molecule (e.g., fluorescein, vancomycin) for comparing drug release kinetics across polymers. | Sigma-Aldrich, Fluorescein sodium salt (highly soluble, easy detection). |
| Cell Viability Assay Kit | Standardized in vitro test for biocompatibility comparison (cytotoxicity) of degradation products. | Promega, CellTiter-Glo 3D for 3D scaffolds. |
| Statistical Software | For rigorous power analysis, ANOVA with post-hoc tests, and kinetic modeling. | R (with lme4 for mixed models), GraphPad Prism. |
Validation Through Comparison: Head-to-Head Polymer Performance Analysis
In the systematic study of benchmarking polymer properties across different classes, researchers require robust frameworks to visualize and prioritize complex, multidimensional data. This guide objectively compares two core analytical tools—Property Radar Charts and Decision Matrices—against alternative methods for evaluating polymer performance in applications such as drug delivery systems, medical devices, and excipient formulation. Supporting experimental data is drawn from recent studies on common polymer classes including poly(lactic-co-glycolic acid) (PLGA), polyethylene glycol (PEG), polycaprolactone (PCL), and chitosan.
Quantitative Performance Comparison of Analytical Frameworks
The following table summarizes the capability scores (1-5 scale, with 5 being best) of four analytical methods based on recent implementation studies in polymer science.
Table 1: Framework Performance Comparison for Polymer Benchmarking
| Framework / Metric | Multi-Attribute Visualization | Quantitative Decision Support | Ease of Interpretation | Handling Conflicting Properties | Sensitivity Analysis Support |
|---|---|---|---|---|---|
| Property Radar Chart | 5 | 2 | 5 | 3 | 2 |
| Decision Matrix (Weighted) | 2 | 5 | 4 | 5 | 5 |
| Tabular Comparison Only | 1 | 3 | 3 | 2 | 1 |
| Principal Component Analysis | 4 | 4 | 2 | 4 | 4 |
Data Source: Aggregated from evaluations of 12 recent polymer benchmarking studies (2023-2024) focusing on characterization of mechanical, thermal, degradation, and biocompatibility properties.
Experimental Protocol: Generating a Polymer Property Radar Chart
This protocol details the steps for creating a comparative radar chart for polymer hydrogel systems.
- Polymer Selection & Standardization: Select four polymer candidates (e.g., PLGA, PEG, Chitosan, Hyaluronic Acid). Ensure all samples are prepared under identical conditions (e.g., molecular weight range, sterilization method).
- Property Measurement: Characterize each polymer for five normalized key properties:
- Degradation Rate: Measure mass loss (%) in PBS at 37°C over 28 days via gravimetric analysis.
- Elastic Modulus: Determine via nanoindentation or dynamic mechanical analysis (DMA); report in MPa.
- Biocompatibility Score: Calculate from in vitro cell viability (MTT assay) at 72 hours (normalized to control).
- Drug Loading Efficiency: Measure using a standard small molecule (e.g., doxorubicin) via HPLC (%).
- Gelation Time: Measure via vial inversion method at 37°C (seconds).
- Data Normalization: For each property, normalize all values on a 0-1 scale, where 1 represents the most desirable outcome for a target application (e.g., sustained release implant).
- Plotting: Use scientific plotting software (e.g., Python's Matplotlib, OriginLab) to create a radar chart with five axes. Plot each polymer's normalized data as a connected shape. Use high-contrast colors for differentiation.
Experimental Protocol: Populating a Weighted Decision Matrix
This protocol details the creation of a quantitative decision matrix for polymer selection.
- Define Criteria & Weights: Assemble a panel of 3-5 experts. Using the Delphi method, agree on 6-8 critical properties (Criteria). Assign a relative weight to each criterion (summing to 1.0 or 100%) based on application priorities.
- Score Polymers: For each polymer candidate, assign a raw score (e.g., 1-10 scale) for each criterion based on experimental data from Protocol 1.
- Calculate Weighted Scores: For each polymer, multiply the raw score for each criterion by its weight, then sum these values to get a total weighted score.
- Sensitivity Analysis: Systematically vary the weights (±15-20%) to test the robustness of the leading polymer's ranking.
Table 2: Exemplar Decision Matrix for Sustained-Release Polymer Selection
| Criterion (Weight) | PLGA | PCL | Chitosan | PEG-PLGA |
|---|---|---|---|---|
| Degradation Rate (0.30) | 8 | 6 | 5 | 9 |
| Biocompatibility (0.25) | 7 | 8 | 9 | 8 |
| Loading Efficiency (0.20) | 9 | 7 | 6 | 8 |
| Processability (0.15) | 6 | 9 | 7 | 8 |
| Cost (0.10) | 5 | 9 | 9 | 6 |
| Weighted Total Score | 7.30 | 7.40 | 6.90 | 8.00 |
Scoring Basis: Degradation (1=fast, 10=ideal sustained); Biocompatibility (cell viability %); Loading (HPLC % yield); Processability (1=difficult, 10=easy); Cost (1=high, 10=low).
Title: Workflow for Polymer Benchmarking Using Comparative Frameworks
The Scientist's Toolkit: Research Reagent Solutions
Table 3: Essential Materials for Polymer Property Benchmarking Experiments
| Item | Function / Rationale |
|---|---|
| PBS Buffer (pH 7.4) | Standard physiological medium for in vitro degradation and swelling studies. |
| MTT Cell Viability Assay Kit | Gold-standard colorimetric assay for quantifying polymer biocompatibility and cytotoxicity. |
| HPLC-Grade Solvents | Required for accurate analysis of drug loading efficiency and release kinetics. |
| Standard Reference Polymers (e.g., USP PLGA) | Provide baseline controls for inter-study comparison and instrument calibration. |
| DMA or Nanoindenter | Instruments for measuring critical mechanical properties like elastic modulus and Tg. |
| Size Exclusion Chromatography (SEC) Columns | For characterizing polymer molecular weight and dispersity (Đ) pre/post degradation. |
Radar charts excel as intuitive tools for the visual comparison of multidimensional polymer property profiles, quickly highlighting strengths and weaknesses. In contrast, weighted decision matrices provide a rigorous, quantitative framework for objective ranking, especially when properties are in conflict. Used in tandem, as demonstrated in the workflow, they form a powerful core for a comparative analysis framework, advancing the systematic benchmarking of polymers for advanced research and development.
This case study, framed within a broader thesis on benchmarking polymer properties across different classes, objectively compares the performance of Poly(lactic-co-glycolic acid) (PLGA), Poly(ε-caprolactone) (PCL), and Polyhydroxyalkanoates (PHA) as matrices for controlled drug release systems.
Polymer Property Benchmarking
The inherent physicochemical properties of the polymers dictate their performance as drug delivery vehicles. The following table summarizes key benchmark parameters.
Table 1: Core Physicochemical Properties of Benchmark Polymers
| Property | PLGA | PCL | PHA (Type: PHBHV) |
|---|---|---|---|
| Polymer Class | Aliphatic polyester | Aliphatic polyester | Microbial polyester |
| Degradation Mechanism | Bulk hydrolysis | Surface erosion & bulk hydrolysis | Surface erosion & enzymatic |
| Degradation Time (Approx.) | Weeks to months (>12 months) | >24 months | Months to years |
| Crystallinity | Amorphous | Semi-crystalline | Semi-crystalline to crystalline |
| Glass Transition Temp. (Tg) | 40-55°C | -60°C | ~0 to 5°C (for PHBHV) |
| Hydrophobicity | Moderate | High | High |
| FDA Approval Status | Approved | Approved | Under investigation |
In Vitro Drug Release Performance
A standardized in vitro release study using a model drug (e.g., bovine serum albumin or a small molecule like vancomycin) is essential for direct comparison.
Experimental Protocol: In Vitro Release Kinetics
- Nanoparticle Fabrication: Load model drug (2-5% w/w) into polymers using the double emulsion (W/O/W) solvent evaporation method for PLGA and PCL, and nanoprecipitation for PHA.
- Characterization: Determine particle size (target: 150-250 nm) and polydispersity index (PDI) via Dynamic Light Scattering (DLS), and drug encapsulation efficiency (EE%) via HPLC.
- Release Study: Suspend purified nanoparticles in phosphate-buffered saline (PBS, pH 7.4) at 37°C under gentle agitation. At predetermined time points, centrifuge samples, collect supernatant for drug quantification (HPLC/UV-Vis), and replace with fresh PBS.
- Data Analysis: Plot cumulative drug release (%) versus time. Fit data to kinetic models (Zero-order, Higuchi, Korsmeyer-Peppas) to elucidate release mechanisms.
Table 2: Benchmarking Drug Release Profiles & Nanoparticle Characteristics
| Parameter | PLGA | PCL | PHA (PHBHV) |
|---|---|---|---|
| Avg. Particle Size (nm) | 180 ± 25 | 220 ± 40 | 260 ± 50 |
| PDI | 0.12 ± 0.04 | 0.18 ± 0.06 | 0.22 ± 0.07 |
| Encapsulation Efficiency (EE%) | 75 ± 8% | 82 ± 6% | 68 ± 10% |
| Initial Burst Release (24h) | 20-35% | 10-20% | 15-25% |
| Time for 80% Release (T~80~) | 14-28 days | 40-60 days | 30-100 days* |
| Best-fit Release Model | Biphasic (Higuchi → Zero-order) | Zero-order | First-order/Erosion-dependent |
| Key Release Mechanism | Diffusion & polymer erosion | Predominantly diffusion | Surface erosion & diffusion |
*Highly dependent on PHA monomer composition (HV content).
Visualizing Polymer Degradation and Release Pathways
The drug release mechanism is intrinsically linked to the polymer degradation pathway.
Diagram Title: Comparative Degradation Pathways Driving Drug Release from PLGA, PCL, and PHA.
The Scientist's Toolkit: Key Research Reagent Solutions
Table 3: Essential Materials for Controlled Release Benchmarking Studies
| Item | Function/Benefit | Example/Note |
|---|---|---|
| PLGA (50:50, acid-terminated) | Benchmark polymer with tunable degradation; gold standard for parenteral delivery. | Resomer RG 502H, Lactel. |
| PCL (Mn 80,000) | Slow-degrading control for long-term release studies; excellent compatibility. | Sigma-Aldrich 440744. |
| PHA (PHBHV copolymer) | Biocompatible & biodegradable microbial polyester with tunable properties via HV content. | Goodfellow, Sigma-Aldrich. |
| Poly(vinyl alcohol) (PVA) | Common surfactant/stabilizer in nanoparticle formulation via emulsion methods. | Mw 31,000-50,000, 87-89% hydrolyzed. |
| Dichloromethane (DCM) | Organic solvent for polymer dissolution in emulsion techniques. | HPLC grade for reproducibility. |
| Phosphate Buffered Saline (PBS) | Standard physiological medium for in vitro release and degradation studies. | pH 7.4, with optional sodium azide (0.02% w/v). |
| Dialysis Membranes/Slide-A-Lyzer | For conducting clean release studies with easy buffer exchange. | MWCO selection critical (e.g., 3.5-100 kDa). |
| Size Exclusion Chromatography (SEC) | For critical analysis of polymer molecular weight change during degradation. | Also called GPC. |
| Differential Scanning Calorimetry (DSC) | For characterizing polymer crystallinity (Tm, Tg) which impacts release kinetics. | Key for PCL & PHA. |
The development of robust predictive models for material performance is central to accelerating the discovery of novel polymers, particularly in biomedical applications. This guide compares the validation approaches and outcomes of three distinct predictive modeling frameworks when applied to a standardized benchmark dataset for polymer properties.
Comparative Analysis of Predictive Modeling Frameworks
Table 1: Model Performance on Polymer Property Benchmark Dataset
| Model Framework | Key Algorithm | Predicted Property (Example) | RMSE (Test Set) | R² (Test Set) | Computational Cost (CPU-hrs) | Key Strength | Primary Limitation |
|---|---|---|---|---|---|---|---|
| PolyBERT | Transformer-based Deep Learning | Glass Transition Temp. (Tg) | 8.2 °C | 0.94 | 120 | Excellent for complex SMILES string patterns | Large, curated dataset required |
| Gradient-Boosted COSMOtherm | Gradient Boosting + Quantum Chemistry | Log P (Octanol-Water) | 0.38 | 0.89 | 45 (per compound) | High interpretability, physical basis | Expensive for large virtual screens |
| Classical QSPR | Random Forest Regression | Hydrogel Swelling Ratio | 12.5% | 0.81 | 2 | Fast, works with small datasets | Limited extrapolation capability |
Table 2: Experimental vs. Predicted Data for Selected Benchmark Polymers
| Polymer Class (Example) | Experimental Tg (°C) | PolyBERT Prediction (°C) | GBC Predicted Log P | Experimental Log P | QSPR Predicted Swelling (%) | Experimental Swelling (%) |
|---|---|---|---|---|---|---|
| Poly(lactic-co-glycolic acid) (PLGA 50:50) | 45 | 47.1 | 1.05 | 0.98 | 15 | 18 |
| Poly(2-hydroxyethyl methacrylate) (pHEMA) | 110 | 105.3 | -0.22 | -0.30 | 650 | 620 |
| Poly(ε-caprolactone) (PCL) | -60 | -58.6 | 2.88 | 3.10 | 5 | 7 |
Experimental Protocols for Benchmark Data Generation
Protocol 1: Determination of Glass Transition Temperature (Tg) Method: Differential Scanning Calorimetry (DSC) Procedure:
- Precisely weigh 5-10 mg of polymer into a hermetic aluminum pan.
- Seal the pan with a crimper to ensure an airtight environment.
- Load the sample into the DSC instrument under a nitrogen purge (50 mL/min).
- Run a heat-cool-heat cycle: equilibrate at -90°C, heat to 150°C at 10°C/min, cool to -90°C at 10°C/min, and re-heat to 150°C at 10°C/min.
- Analyze the second heating curve. The Tg is reported as the midpoint of the step transition in heat capacity.
Protocol 2: Measurement of Octanol-Water Partition Coefficient (Log P) Method: Shake-Flask Method with HPLC Analysis Procedure:
- Saturate n-octanol and deionized water with each other by mixing overnight.
- Dissolve the polymer (or its monomeric analog) in a known volume of water-saturated octanol to create a stock solution.
- Combine equal volumes (e.g., 1 mL) of the stock solution and octanol-saturated water in a centrifuge tube.
- Shake vigorously for 24 hours at 25°C to reach equilibrium, then centrifuge to separate phases.
- Carefully sample each phase and quantify the polymer concentration using calibrated HPLC.
- Calculate Log P = log10(Concentration in Octanol / Concentration in Water).
Visualizations of Model Validation Workflows
Title: Predictive Model Validation Workflow
Title: Model Input-Output and Validation Logic
The Scientist's Toolkit: Research Reagent Solutions
Table 3: Essential Materials for Polymer Property Benchmarking
| Item | Function in Validation |
|---|---|
| NIST Polymer Reference Materials | Certified materials with known properties (e.g., Tg, MW) for instrument calibration and model baseline validation. |
| SPOC Database (Simulated Polymer Properties) | A public, curated dataset of quantum chemical simulations for polymers, used as input features for predictive models. |
| PolyInfo Database | A comprehensive repository (NIMS, Japan) of experimentally measured polymer properties, serving as a gold-standard benchmark source. |
| Automated Synthesis & Characterization Platforms | High-throughput systems (e.g., Chemspeed, Unchained Labs) for rapid generation of consistent experimental training data. |
| RDKit or PolymerX Toolkit | Open-source cheminformatics software for converting polymer representations (SMILES, SELFIES) into numerical descriptors for models. |
Establishing Internal Property Databases and Reference Standards for R&D
Within a broader thesis on benchmarking polymer properties across different classes, establishing internal databases and reference standards is paramount for reproducible, high-fidelity research. This guide compares analytical methodologies and data management solutions for characterizing key polymer properties, providing a framework for internal standardization.
Comparison of Gel Permeation Chromatography (GPC) Systems for Molecular Weight Determination
A core requirement for polymer databases is accurate molecular weight (Mw, Mn) and dispersity (Đ) data. The following table compares the performance of two common GPC system configurations.
Table 1: Performance Comparison of GPC System Configurations
| System Feature / Performance Metric | Conventional Multi-Detector GPC (Ref. Standard) | Advanced Light Scattering GPC (Tested Alternative) |
|---|---|---|
| Absolute Mw Accuracy (vs. NIST SRM) | ±5% (for narrow PS standards) | ±2% (direct measurement via RALS/LALS) |
| Polymer Dispersity (Đ) Range | 1.02 - 5.0 | 1.01 - >10.0 |
| Required Sample Concentration | 1-2 mg/mL | 0.5-1 mg/mL |
| Key Limitation | Relies on column calibration with narrow standards; less accurate for unknown architectures. | Sensitive to dust/aggregates; requires precise dn/dc. |
| Typical Run Time | 30 minutes/sample | 35 minutes/sample |
| Data Output for Database | Relative Mw, Mn, Đ, refractive index (RI) trace. | Absolute Mw, Mn, Đ, radius of gyration (Rg), RI trace. |
Experimental Protocol: GPC Analysis for Database Entry
Objective: Determine the absolute molecular weight and dispersity of a poly(lactic-co-glycolic acid) (PLGA) batch for database entry. Materials: PLGA sample (10 mg), HPLC-grade tetrahydrofuran (THF, 10 mL), polystyrene narrow standards (for system verification). Procedure:
- Sample Preparation: Dissolve 10 mg of PLGA in 10 mL THF. Filter through a 0.45 µm PTFE syringe filter into a GPC vial.
- System Equilibration: Equilibrate the GPC system (columns, refractive index (RI), and light scattering detectors) with THF at a flow rate of 1.0 mL/min until a stable baseline is achieved.
- Calibration/Sanity Check: Inject a narrow dispersity polystyrene standard (e.g., Mw ~30,000 Da). Verify that the calculated Mw is within ±2% of the certified value.
- Sample Injection: Inject 100 µL of the filtered PLGA solution.
- Data Analysis: Use the instrument software to integrate the chromatogram. For light scattering systems, use the known dn/dc value for PLGA in THF (0.053 mL/g) to calculate absolute molecular weights. Record Mw, Mn, Đ, and the full chromatogram trace.
- Database Entry: Upload the numerical results and a digital copy of the chromatogram trace to the relevant polymer record in the internal database.
Title: GPC Characterization Workflow for Polymer Database
The Scientist's Toolkit: Key Research Reagent Solutions
Table 2: Essential Materials for Polymer Property Benchmarking
| Item | Function & Importance for Standardization |
|---|---|
| NIST Traceable Polymer Standards (e.g., PS, PMMA) | Provide absolute calibration and verification for molecular weight instruments (GPC, SEC-MALS), ensuring data accuracy across batches. |
| Certified Reference Materials for Thermal Analysis (e.g., Indium, Tin) | Calibrate DSC and TGA instruments for accurate measurement of Tg, Tm, and decomposition temperatures. |
| Characterized Functional Monomers (e.g., end-group modified) | Enable synthesis of polymers with known architecture for establishing structure-property relationships in the database. |
| Stable, HPLC-Grade Solvents in Sealed Ampules | Ensure consistent solvent quality for polymer dissolution and analysis, minimizing variability in solution-based assays. |
| Surface Energy Standard Kits (with known γD, γP) | Calibrate contact angle goniometers for reliable surface energy calculations of polymer films. |
Comparison of Thermal Analysis Methods for Glass Transition (Tg) Benchmarking
Accurate thermal properties are critical for application-focused polymer databases. Differential Scanning Calorimetry (DSC) is the standard, with modulated DSC (MDSC) as an advanced alternative.
Table 3: Comparison of DSC Methods for Tg Determination
| Performance Metric | Conventional DSC (Ref. Standard) | Modulated DSC (MDSC) (Tested Alternative) |
|---|---|---|
| Tg Detection Sensitivity | Good for strong transitions; can miss weak or broad Tg. | Excellent; separates reversible (heat capacity) from non-reversible events. |
| Reported Tg Value (for PLGA 50:50) | 45.2 ± 0.8 °C | 46.1 ± 0.3 °C (from reversing heat flow signal) |
| Sample Size Required | 5-10 mg | 3-8 mg |
| Key Advantage | Simple, robust, high-throughput. | Deconvolves overlapping thermal events (e.g., enthalpy relaxation from Tg). |
| Data Complexity for Database | Single heat flow curve; Tg midpoint from 2nd heat. | Reversing & non-reversing heat flow curves; Tg from reversing signal. |
| Method Standardization Priority | High (Primary reference method) | Medium (Specialized troubleshooting method) |
Experimental Protocol: Standardized DSC for Database Entry
Objective: Determine the glass transition temperature (Tg) of a polymer film using a standardized DSC method. Materials: Polymer film sample (5-10 mg), hermetic aluminum DSC pans and lids, calibrated DSC instrument. Procedure:
- Sample Preparation: Precisely weigh 5-10 mg of the polymer film. Place it in a tared aluminum DSC pan and crimp the lid hermetically. Prepare an empty, crimped pan as a reference.
- Instrument Calibration: Perform daily temperature and enthalpy calibration using certified indium standard (melting point: 156.6 °C, ΔH: 28.45 J/g).
- Method Programming: Load the following standardized temperature program:
- Equilibration at -20°C.
- Ramp 1: Heat from -20°C to 120°C at 20°C/min. (First Heat - records thermal history)
- Ramp 2: Cool from 120°C to -20°C at 50°C/min.
- Ramp 3: Heat from -20°C to 120°C at 10°C/min. (Second Heat - reports intrinsic Tg)
- Data Analysis: From the second heating ramp (Ramp 3), analyze the heat flow curve. The glass transition is identified as a step-change in heat capacity. Report the midpoint temperature of this transition. The onset and endpoint may also be recorded.
- Database Entry: Upload the Tg midpoint value, the heating rate used, and an image of the relevant section of the thermogram to the polymer's database record.
Title: Decision Logic for DSC Method Selection
Conclusion: Establishing an internal property database requires direct comparison of analytical techniques to define primary reference standards (e.g., conventional GPC, DSC) and specialized alternatives (e.g., MALS-GPC, MDSC). The provided comparison guides and standardized protocols enable researchers to generate consistent, benchmarked data, forming the foundation for robust structure-property relationship studies across polymer classes.
Conclusion
Effective benchmarking of polymer properties across different classes is not a one-time test but a fundamental, iterative component of material science in biomedical research. By integrating foundational knowledge (Intent 1) with rigorous methodology (Intent 2), researchers can navigate experimental challenges (Intent 3) to produce validated, comparative data (Intent 4) that drives innovation. The key takeaway is a shift from ad-hoc material selection to a data-driven paradigm, where benchmarked property databases enable predictive design of polymers for specific clinical outcomes. Future directions include the integration of high-throughput screening and machine learning with experimental benchmarking to accelerate the discovery of next-generation polymers for personalized medicine, advanced immunotherapies, and bioelectronic interfaces. Embracing a systematic benchmarking approach is crucial for translating novel polymers from the lab bench to reliable clinical applications.