Optimizing Waterborne Polyurethane (WPU) Formulations: A Comprehensive Design of Experiments (DoE) Guide for Pharmaceutical Researchers
This article provides a complete roadmap for applying Design of Experiments (DoE) to optimize Waterborne Polyurethane (WPU) formulations for drug delivery.
Optimizing Waterborne Polyurethane (WPU) Formulations: A Comprehensive Design of Experiments (DoE) Guide for Pharmaceutical Researchers
Abstract
This article provides a complete roadmap for applying Design of Experiments (DoE) to optimize Waterborne Polyurethane (WPU) formulations for drug delivery. It covers foundational principles, step-by-step methodology for designing and executing studies, strategies for troubleshooting and refining models, and robust validation techniques. Aimed at researchers and formulation scientists, this guide bridges statistical design with practical polymer science to efficiently develop WPUs with targeted properties for biomedical applications.
Why DoE? Laying the Groundwork for Efficient WPU Formulation Design
1. Introduction Waterborne Polyurethanes (WPUs) are aqueous colloidal dispersions of polyurethane particles, gaining prominence as biodegradable, biocompatible, and tunable carriers for drug delivery. Their formulation and optimization are complex, multivariate processes ideally suited for systematic investigation via Design of Experiments (DoE). This document provides application notes and protocols for characterizing WPU-based nanocarriers, framed within a DoE methodology to optimize Critical Quality Attributes (CQAs) that dictate therapeutic efficacy and safety.
2. Key Properties and Linked CQAs The performance of WPU drug carriers is governed by interdependent physicochemical and biological properties, defined as CQAs. The table below summarizes these key CQAs, their target ranges, and analytical methods.
Table 1: Critical Quality Attributes (CQAs) of WPU Drug Carriers
| CQA Category | Specific Attribute | Typical Target Range | Impact on Performance | Standard Analytical Method | ||||
|---|---|---|---|---|---|---|---|---|
| Physicochemical | Particle Size (Z-Avg. Diameter) | 50 – 300 nm | Biodistribution, Cellular Uptake, Stability | Dynamic Light Scattering (DLS) | ||||
| Physicochemical | Polydispersity Index (PDI) | < 0.3 | Uniformity of Drug Loading & Release | Dynamic Light Scattering (DLS) | ||||
| Physicochemical | Zeta Potential | ±20 | mV to | ±40 | mV | Colloidal Stability, Mucoadhesion | Electrophoretic Light Scattering | |
| Physicochemical | Drug Loading Capacity (DLC) | > 5% w/w | Dosage Efficiency, Carrier Burden | UV-Vis Spectrophotometry / HPLC | ||||
| Physicochemical | Encapsulation Efficiency (EE) | > 80% | Process Efficiency, Cost | UV-Vis Spectrophotometry / HPLC | ||||
| Performance | In Vitro Drug Release Profile | Sustained over 24-72 hrs | Pharmacokinetics, Dosing Interval | Dialysis / USP Dissolution Apparatus | ||||
| Performance | In Vitro Cytotoxicity (Cell Viability) | > 80% at therapeutic dose | Biocompatibility, Safety | MTT / AlamarBlue Assay | ||||
| Stability | Colloidal Stability (Size & PDI) | Change < 10% over 30 days at 4°C & 25°C | Shelf-life, Storage Conditions | DLS (Time-point monitoring) |
3. Detailed Experimental Protocols
Protocol 3.1: Preparation of Drug-Loaded WPU Nanoparticles (Double Emulsion Solvent Evaporation)
- Objective: To formulate WPU nanoparticles encapsulating a hydrophilic drug (e.g., Doxorubicin HCl) or a hydrophobic drug (e.g., Paclitaxel).
- Materials: See The Scientist's Toolkit (Section 5).
- Method:
- Aqueous Phase Prep: Dissolve WPU resin (e.g., 200 mg) in 10 mL of deionized water under magnetic stirring (600 rpm) for 1 hour. Filter through a 0.45 µm filter.
- Drug Phase Prep (Hydrophobic Drug): Dissolve the hydrophobic drug (e.g., 10 mg Paclitaxel) in 2 mL of dichloromethane (DCM).
- Primary Emulsion: Add the drug-DCM solution dropwise to 5 mL of the WPU aqueous solution. Immediately sonicate (probe sonicator, 40% amplitude, 30 s pulse on, 10 s off, 2 min total) in an ice bath to form a primary water-in-oil (W/O) or oil-in-water (O/W) emulsion.
- Secondary Emulsion: Pour the primary emulsion into 50 mL of a 0.5% (w/v) polyvinyl alcohol (PVA) stabilizer solution under high-speed homogenization (15,000 rpm, 5 min).
- Solvent Evaporation: Stir the final double emulsion at room temperature, 600 rpm, for 6-12 hours to evaporate the organic solvent completely.
- Purification: Centrifuge the nanoparticle suspension at 20,000 x g for 30 min. Wash the pellet with DI water and re-centrifuge. Repeat twice.
- Redispersion: Redisperse the final nanoparticle pellet in 10 mL of DI water or PBS (pH 7.4). Store at 4°C.
Protocol 3.2: Characterization of Particle Size, PDI, and Zeta Potential
- Objective: To determine the hydrodynamic diameter, size distribution, and surface charge of WPU nanoparticles.
- Method (DLS & ELS):
- Sample Preparation: Dilute the purified WPU nanoparticle dispersion 1:50 (v/v) in filtered (0.22 µm) DI water or 1 mM KCl for zeta potential.
- Instrument Calibration: Calibrate the instrument using a standard latex particle (e.g., 100 nm).
- Measurement: Load 1 mL of diluted sample into a disposable folded capillary cell (zeta potential) or a quartz cuvette (size). Equilibrate to 25°C.
- Data Acquisition: Perform DLS measurement at a backscatter angle (e.g., 173°). Run 10-15 sub-runs per measurement. For zeta potential, perform at least 100 runs.
- Analysis: Report the Z-average diameter (d.nm), PDI (unitless), and zeta potential (mV) as mean ± standard deviation of triplicate samples.
Protocol 3.3: Determination of Drug Loading and Encapsulation Efficiency
- Objective: To quantify the amount of drug successfully incorporated into WPU nanoparticles.
- Method (Indirect Method via UV-Vis):
- Free Drug Separation: Purify the drug-loaded nanoparticles as per Protocol 3.1, Step 6. Collect the combined supernatants from the washes.
- Free Drug Quantification: Dilute the supernatant appropriately. Measure the absorbance of the free drug at its λmax using a UV-Vis spectrophotometer against a standard calibration curve.
- Calculation:
- Encapsulation Efficiency (EE %) = [(Total Drug Added – Free Drug in Supernatant) / Total Drug Added] x 100
- Drug Loading Capacity (DLC %) = [(Total Drug Added – Free Drug in Supernatant) / Weight of Nanoparticles Recovered] x 100
- (Weight of Nanoparticles Recovered is determined by lyophilizing a known volume of the purified nanoparticle dispersion).
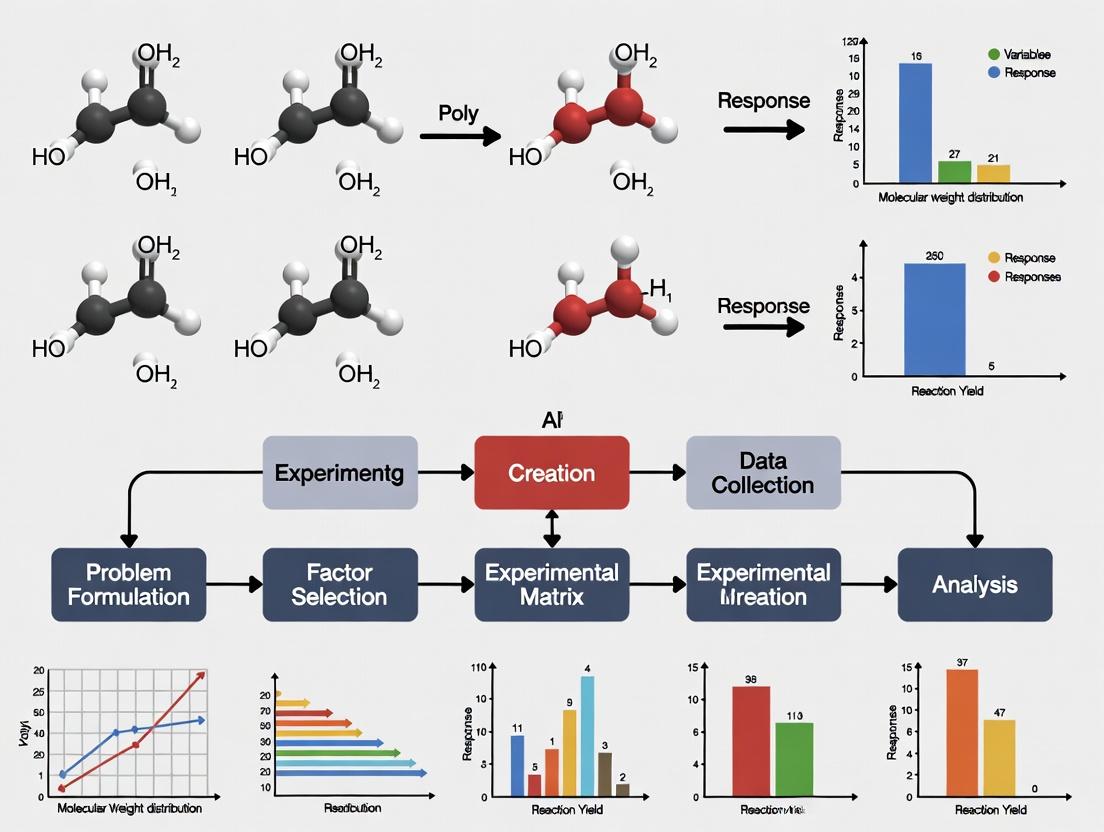
4. Visualizations
Diagram 1: DoE-Driven WPU Formulation Optimization Pathway
Diagram 2: Primary Drug Release Mechanisms from WPU Carriers
5. The Scientist's Toolkit: Essential Research Reagents & Materials
Table 2: Key Research Reagent Solutions for WPU Formulation & Analysis
| Material / Reagent | Function / Role | Example Product / Specification |
|---|---|---|
| WPU Dispersion (Resin) | Core biodegradable polymer; determines mechanical properties, degradation rate, and compatibility. | e.g., Tecophilic (lubrizol), non-ionic/aliphatic, 30-40% solids content. |
| Model Hydrophobic Drug | Active Pharmaceutical Ingredient (API) for proof-of-concept loading/release studies. | Paclitaxel, Docetaxel, Curcumin (≥95% purity). |
| Model Hydrophilic Drug | API for studying encapsulation of water-soluble compounds. | Doxorubicin Hydrochloride, Fluorescein Isothiocyanate (FITC)-Dextran. |
| Organic Solvent | Dissolves hydrophobic drugs/polymers for emulsion formation. | Dichloromethane (DCM), Ethyl Acetate (HPLC grade). |
| Aqueous Stabilizer | Surfactant that stabilizes the oil-water interface during emulsification, controlling particle size. | Polyvinyl Alcohol (PVA, Mw 13,000-23,000, 87-89% hydrolyzed). |
| Dialysis Membrane | Permits controlled diffusion for in vitro drug release studies. | Regenerated cellulose, MWCO 12-14 kDa. |
| Cell Viability Assay Kit | Quantifies in vitro cytotoxicity/biocompatibility of formulations. | MTT Assay Kit (e.g., Sigma-Aldrich TOX1). |
| Particle Size/Zeta Std. | Calibrates and validates DLS/ELS instrument performance. | Polystyrene Latex Nanosphere Standard, 100 nm ± 5 nm. |
The Pitfalls of One-Factor-at-a-Time (OFAT) Testing in Complex Polymer Systems
Application Notes
Within the context of Waterborne Polyurethane (WPU) formulation optimization research, the systematic approach of Design of Experiments (DoE) is critical for understanding complex, non-linear systems. One-Factor-at-a-Time (OFAT) experimentation, while intuitive, presents significant pitfalls that hinder efficiency and scientific insight. These notes detail the limitations of OFAT and advocate for a DoE-based framework.
Key Pitfalls of OFAT in WPU Development:
- Failure to Detect Interactions: WPU properties (e.g., tensile strength, particle size, chemical resistance) result from synergistic or antagonistic interactions between formulation factors (e.g., NCO:OH ratio, DMPA content, chain extender type) and process parameters. OFAT cannot quantify these interactions, leading to incomplete models and suboptimal formulations.
- Inefficiency and Resource Intensity: Exploring a multi-factor space with OFAT requires an exponentially larger number of experiments compared to a factorial DoE, wasting time, materials, and analytical resources.
- Risk of False Optima: By fixing other factors while varying one, OFAT can easily miss the true global optimum, converging on a local optimum that appears best only under the constrained conditions of the test series.
- Poor Scalability and Robustness: Formulations developed via OFAT are often not robust to minor variations in raw materials or process conditions, as the experimental domain has not been systematically mapped.
Table 1: Comparative Experimental Efficiency - OFAT vs. Fractional Factorial DoE for a 5-Factor WPU Study
| Factor | Levels | OFAT Experiments Required* | 2-Level Fractional Factorial (Resolution V) Experiments |
|---|---|---|---|
| Polyol Type (A) | 2 | ||
| NCO:OH Ratio (B) | 3 | ||
| DMPA Content (C) | 3 | 31 | 16 |
| Chain Extender (D) | 2 | ||
| Stirring Rate (E) | 3 | ||
| Interaction Information | None | All main effects & two-factor interactions |
*OFAT calculation: Hold 4 factors constant, vary the 5th through its levels. Sum for all factors.
Protocols
Protocol 1: Demonstrating Factor Interaction Using a Simple 2-Factor DoE Objective: To empirically demonstrate the presence of a significant interaction between DMPA content (A) and NCO:OH ratio (B) on WPU emulsion particle size. Materials: See "Scientist's Toolkit." Method:
- Design: Set up a 2² full factorial DoE with a center point (5 total runs). Levels: A (DMPA): 4.0% and 6.0% by mass; B (NCO:OH): 1.2 and 1.5.
- Synthesis: For each run, synthesize WPU via prepolymer method.
- Charge polyol, DMPA (at specified level), and catalyst to a dry flask under N₂.
- Heat to 80°C. Add disocyanate (calculated for target NCO:OH ratio) dropwise.
- Maintain at 80°C until theoretical NCO% is reached (titration).
- Cool to 40°C, neutralize with TEA.
- Disperse in water under high shear (fixed stirring rate/time).
- Chain extend with EDA.
- Analysis: Measure z-average particle size for each batch via Dynamic Light Scattering (DLS). Perform in triplicate.
- Modeling: Input data into statistical software. Fit a linear model with terms for A, B, and the AB interaction.
Protocol 2: Comparative Optimization via OFAT vs. Response Surface Methodology (RSM) Objective: To compare the path and outcome of optimizing for tensile strength using OFAT and RSM. Materials: As above. Method – OFAT Arm:
- Establish a baseline formulation (e.g., A=5.0%, B=1.35, Polyol=Polyether).
- Vary DMPA (A) from 4.0% to 6.0% in 0.5% increments, holding B and Polyol constant. Synthesize, cast films, and test tensile strength (ASTM D412).
- Identify the "best" A level from Step 2.
- Using this "best" A, vary NCO:OH (B) from 1.2 to 1.5 in 0.1 increments. Synthesize and test.
- Report the final "optimized" combination. Method – RSM Arm:
- Design a Central Composite Design (CCD) around the baseline, varying A and B over the same ranges as OFAT (~9-13 runs).
- Execute all runs in randomized order.
- Measure tensile strength for all.
- Fit a quadratic model (including A², B², AB terms).
- Use model optimization to find the factor combination predicting maximum tensile strength, verifying with a confirmation run.
Visualizations
Diagram Title: OFAT vs DoE Workflow & Outcomes Comparison
Diagram Title: DoE Reveals Critical Factor Interaction
The Scientist's Toolkit
Table 2: Key Research Reagent Solutions for WPU Formulation DoE Studies
| Item | Function & Relevance to DoE |
|---|---|
| Polyol Variants (Polyether, Polyester, Mixed) | Primary backbone component. Systematic variation is a key categorical factor affecting flexibility, hydrolysis resistance, and compatibility. |
| Aliphatic Diisocyanate (e.g., IPDI, H12MDI) | Provides urethane linkages. NCO:OH ratio is a primary continuous factor controlling crosslink density and final properties. |
| Internal Dispersion Agent (e.g., DMPA, DMEA) | Provides ionic centers for water dispersion. Content is a critical factor influencing particle size, viscosity, and film properties. |
| Neutralizing Agent (Triethylamine - TEA) | Neutralizes carboxylic acids from DMPA to form salts for dispersion. Stoichiometry relative to DMPA is often a fixed or minor variable. |
| Chain Extenders (Diamines: EDA, DETA; Diols: BDO) | Extends polymer chains; amines used in water. Type and amount are key factors influencing hard segment content and morphology. |
| DoE & Statistical Analysis Software (JMP, Minitab, Design-Expert) | Essential for generating efficient experimental designs, randomizing runs, analyzing results, and building predictive models. |
| High-Shear Dispersion Homogenizer | Critical for consistent emulsification. Speed and time may be process factors in a DoE to ensure robust, scalable dispersion. |
Within Waterborne Polyurethane (WPU) formulation optimization research, the systematic application of Design of Experiments (DoE) is paramount. This protocol outlines the core principles of DoE—factors, levels, responses, and interactions—providing a structured framework for efficient experimentation. This approach enables researchers to elucidate complex formulation-property relationships with minimal experimental runs, accelerating the development of WPU for targeted drug delivery applications.
Fundamental Concepts & Data Presentation
Key DoE Terminology Table
| Term | Definition | Example in WPU Formulation |
|---|---|---|
| Factor (X) | An independent, controllable variable. | Polyol type, Isocyanate (NCO):OH ratio, Chain extender amount. |
| Level | The specific setting or value of a factor. | NCO:OH Ratio: 1.0, 1.2, 1.4. |
| Response (Y) | A measured, dependent output variable. | Particle size (nm), Zeta potential (mV), Tensile strength (MPa). |
| Interaction | When the effect of one factor depends on the level of another. | The effect of surfactant type on particle size may depend on the stirring rate. |
| Replicate | Repeated experimental runs under identical conditions. | Performing the same formulation run three times to estimate pure error. |
| Randomization | The random order of conducting experimental runs. | Helps mitigate the effects of uncontrolled variables (e.g., ambient humidity). |
Quantitative Impact of Interactions: A Simulated Data Table
Table: Simulated Effects of Two Factors (Surfactant % and Stir Rate) on WPU Particle Size, Demonstrating Interaction
| Run Order | Surfactant (%) | Stir Rate (rpm) | Particle Size (nm) |
|---|---|---|---|
| 1 | 0.5 | 500 | 210 |
| 2 | 2.0 | 500 | 110 |
| 3 | 0.5 | 1500 | 85 |
| 4 | 2.0 | 1500 | 155 |
| Main Effect (Surf) | -85 nm (at 500 rpm) | +45 nm (at 1500 rpm) | Interaction Present |
| Main Effect (Stir) | -125 nm (at 0.5%) | +45 nm (at 2.0%) | Effect depends on partner level |
Experimental Protocols
Protocol: Screening Design for Identifying Critical WPU Formulation Factors
Objective: To identify which of 5-7 formulation factors significantly affect critical quality attributes (CQAs) using a Fractional Factorial or Plackett-Burman design.
Materials: (See Scientist's Toolkit) Procedure:
- Define Objective & CQAs: Select 2-3 primary responses (e.g., Particle Size, Polydispersity Index (PDI), Gel Fraction).
- Select Factors & Ranges: Choose 5-7 likely influential factors (e.g., NCO:OH ratio, DMPA content, triethylamine (TEA) amount, reaction temperature, acetone content). Define a low (-1) and high (+1) level for each based on pre-formulation studies.
- Design Matrix: Use statistical software (e.g., JMP, Minitab, Design-Expert) to generate a 12-run Plackett-Burman design matrix. This design assumes interactions are negligible for screening.
- Randomization: Randomize the run order provided by the software to minimize bias.
- Experimental Execution: a. Prepare WPU pre-polymer per standard synthesis protocol. b. For each randomized run, adjust the selected factors to their designated levels. c. Proceed with dispersion, chain extension, and solvent removal as required. d. Measure all defined responses for each batch.
- Statistical Analysis: Input response data into the software. Perform analysis of variance (ANOVA) to identify factors with statistically significant (p-value < 0.05) main effects on each response. Generate Pareto charts of effects.
Protocol: Response Surface Methodology (RSM) for Optimization
Objective: To model the nonlinear relationship between 2-3 critical factors (identified in Protocol 2.1) and responses, and find the optimal formulation region.
Procedure:
- Select Critical Factors: Choose 2-3 key factors from screening (e.g., NCO:OH Ratio (X1), DMPA Content (X2)).
- Design Selection: Employ a Central Composite Design (CCD) with 5 levels per factor (typically -α, -1, 0, +1, +α). A 2-factor CCD requires ~13 runs (including center point replicates).
- Execution: Perform synthesis and characterization runs as per the CCD matrix in randomized order.
- Model Fitting & Analysis: Fit a second-order polynomial model (e.g.,
Y = β0 + β1X1 + β2X2 + β12X1X2 + β11X1² + β22X2²) to each response. Assess model adequacy via ANOVA (R², adjusted R², lack-of-fit test). - Visualization & Optimization: Generate 2D contour plots and 3D response surface plots for each critical response. Use numerical optimization (desirability function) to find factor levels that jointly satisfy all CQA targets (e.g., minimize particle size while maximizing zeta potential magnitude).
The Scientist's Toolkit: Research Reagent Solutions
| Item | Function in WPU Formulation for Drug Delivery |
|---|---|
| Aliphatic Diisocyanate (e.g., IPDI) | Provides the NCO component; aliphatic offers better biocompatibility/light stability than aromatic. |
| Polycarbonate Diol | Polyol soft segment; imparts hydrolytic stability and mechanical strength to the polymer. |
| Dimethylolpropionic Acid (DMPA) | Ionic center (internal emulsifier) for water dispersion; critical for controlling particle size/stability. |
| Triethylamine (TEA) | Neutralizes DMPA carboxylic acid groups to form salts, enabling aqueous dispersion. |
| Ethylenediamine (EDA) | Chain extender; reacts with NCO to increase molecular weight and urea linkages, affecting toughness. |
| Acetone (or MEK) | Solvent to control viscosity during pre-polymer synthesis before dispersion in water. |
| Model Drug (e.g., Dexamethasone) | A bioactive compound to study encapsulation efficiency and release kinetics from the WPU matrix. |
| Dynamic Light Scattering (DLS) Instrument | For measuring nanoparticle hydrodynamic diameter (size) and size distribution (PDI). |
| Zeta Potential Analyzer | Measures surface charge of dispersed particles, predicting colloidal stability. |
Visualizations
DoE Workflow for WPU Formulation
Interaction Effect on WPU Particle Size
Screening Designs (e.g., Plackett-Burman) for Identifying Key Formulation Variables
This application note details the integration of screening designs, specifically Plackett-Burman (PB) designs, within a Design of Experiments (DoE) framework for optimizing Waterborne Polyurethane (WPU) formulations. The primary objective is to efficiently identify the critical formulation variables from a large set of potential candidates prior to undertaking more resource-intensive optimization studies.
The Role of Screening in a DoE Thesis for WPU Optimization
Within a comprehensive DoE thesis for WPU research, screening represents the first critical phase. Initial formulations involve numerous variables (e.g., monomers, chain extenders, catalysts, solvents, process parameters) whose individual and interactive effects are unknown. A PB design provides a statistically sound, fractional-factorial approach to evaluate n-1 variables in just n experimental runs, where n is a multiple of 4 (e.g., 8, 12, 20). This efficiency allows researchers to sift through variables and isolate the "vital few" (e.g., isocyanate ratio, polyol molecular weight, DMPA content) that significantly influence key responses (e.g., tensile strength, particle size, hydrolytic stability) from the "trivial many."
The table below summarizes a hypothetical 12-run PB design screening 11 formulation and process variables for a WPU intended as a drug-eluting film coating.
Table 1: Plackett-Burman Design Matrix (12 Runs) and Simulated Response Data
| Run | NCO:OH Ratio (X₁) | Polyol MW (X₂) | DMPA % (X₃) | Catalyst (X₄) | Chain Extender (X₅) | Stirring Rate (X₆) | Temp (°C) (X₇) | Solvent % (X₈) | Neutralizer (X₉) | Prep Time (X₁₀) | Post-additive (X₁₁) | Avg. Particle Size (nm) (Y₁) | Tensile Modulus (MPa) (Y₂) |
|---|---|---|---|---|---|---|---|---|---|---|---|---|---|
| 1 | + (1.5) | - (1000) | + (6) | - (None) | + (EDA) | + (800) | - (70) | + (10) | - (TEA) | + (60) | - (None) | 112 | 45 |
| 2 | - (1.3) | + (2000) | + (6) | + (DBTDL) | - (BDO) | + (800) | + (85) | - (5) | + (NaOH) | - (30) | + (Silane) | 158 | 12 |
| 3 | - | + | - (3) | + | + | - (400) | + | + | - | + | + | 95 | 38 |
| 4 | + | + | - | - | + | + | - | + | + | - | - | 130 | 50 |
| 5 | + | - | + | + | - | + | + | - | + | + | - | 145 | 15 |
| 6 | - | + | + | + | + | - | - | - | - | - | + | 165 | 10 |
| 7 | + | - | + | - | + | + | - | - | + | + | + | 98 | 42 |
| 8 | + | + | - | + | - | - | + | + | - | + | + | 120 | 35 |
| 9 | - | - | - | + | + | + | + | - | + | - | - | 180 | 8 |
| 10 | - | - | + | - | - | - | - | + | + | + | + | 105 | 48 |
| 11 | + | + | + | - | - | - | + | + | + | - | - | 118 | 40 |
| 12 | - | - | - | - | - | - | - | - | - | - | - | 195 | 5 |
Note: "+" denotes high level, "-" denotes low level. Actual level values are example placeholders. Data is simulated for illustrative purposes.
Table 2: Pareto Analysis of Standardized Effects (for Particle Size, Y₁)
| Variable | Name | Effect Estimate | Standardized Effect (t-value) | p-value (approx.) | Significant? (α=0.1) |
|---|---|---|---|---|---|
| X₁ | NCO:OH Ratio | -45.2 | -6.12 | 0.001 | Yes |
| X₃ | DMPA % | -38.7 | -5.24 | 0.003 | Yes |
| X₈ | Solvent % | -25.3 | -3.42 | 0.015 | Yes |
| X₂ | Polyol MW | 20.8 | 2.81 | 0.038 | Yes |
| X₇ | Temperature | 12.5 | 1.69 | 0.150 | No |
| X₁₁ | Post-additive | -10.1 | -1.37 | 0.226 | No |
| X₅ | Chain Extender | 8.4 | 1.14 | 0.305 | No |
| X₉ | Neutralizer | 7.2 | 0.97 | 0.376 | No |
| X₄ | Catalyst | -5.8 | -0.78 | 0.469 | No |
| X₆ | Stirring Rate | 4.3 | 0.58 | 0.585 | No |
| X₁₀ | Prep Time | 3.1 | 0.42 | 0.692 | No |
Experimental Protocol: Executing a Plackett-Burman Screening Study for WPU Synthesis
Objective: To identify the formulation variables with the most significant effect on the particle size and mechanical properties of a novel WPU.
I. Pre-Experimental Planning
- Define Objective: Clearly state the goal (e.g., "Identify key drivers of particle size reduction").
- Select Factors and Levels: Choose
kfactors to screen (e.g., 11). Define a realistic high (+) and low (-) level for each based on preliminary knowledge. Ensure the difference between levels is large enough to potentially elicit a measurable effect. - Choose a PB Design: Select a design with
nruns (e.g., 12, 20, 24) that accommodates yourkfactors. For 11 factors, a 12-run design is appropriate. Generate the randomized run order using statistical software (e.g., JMP, Minitab, Design-Expert).
II. Materials and Synthesis (Per Run)
- Setup: Label reaction vessels according to the randomized run order.
- Charge: Under a nitrogen atmosphere, charge the specified amounts of polyol (at the designated MW) and isocyanate (calculated based on the exact NCO:OH ratio for the run) into a dry, clean reactor with mechanical stirring.
- Reaction: Heat to the precise temperature level (±1°C) for the run. Add the catalyst (if specified at the '+' level) at this stage.
- Neutralization/Dispersion: After the prepolymer is formed (confirmed by NCO titration), cool to ~40°C. Add the precise weight of dimethylolpropionic acid (DMPA) dissolved in the specified amount of solvent (N-methyl-2-pyrrolidone). Follow with the exact stoichiometric amount of neutralizer (TEA or NaOH) as per the design. Stir vigorously for 20 minutes.
- Chain Extension: Add the designated chain extender (ethylenediamine or 1,4-butanediol) dissolved in deionized water over 2 minutes while stirring at the specified rate (e.g., 400 or 800 RPM).
- Finishing: Stir for an additional 60 minutes. Add any post-additive (e.g., silane coupling agent) if required by the run sheet. Filter the dispersion through a 200-mesh screen.
III. Characterization & Data Collection
- Particle Size: Measure the z-average particle diameter of each dispersion (diluted 1:1000 with DI water) via dynamic light scattering (DLS). Perform triplicate measurements per sample. Record as
Y₁. - Film Casting & Mechanical Testing: Cast films on Teflon plates, dry at ambient temperature for 7 days, then under vacuum at 40°C for 24 hours. Punch dog-bone specimens and test tensile properties per ASTM D638 using a universal testing machine. Record tensile modulus as
Y₂.
IV. Data Analysis
- Model Fitting: For each response (
Y₁,Y₂), fit a linear model:Y = β₀ + ΣβᵢXᵢ, whereβᵢis the estimated effect of factori. - Effect Calculation: Use statistical software to compute the standardized effect (t-statistic) and associated p-value for each factor.
- Significance Identification: Construct a Pareto chart of standardized effects. Factors exceeding the statistical significance threshold (e.g., p < 0.10) are considered active.
- Interpretation: Document the active factors and the direction of their effect (e.g., increasing DMPA % decreases particle size). These factors are carried forward into subsequent Response Surface Methodology (RSM) optimization studies.
Visualization: Workflow and Decision Pathway
Title: Plackett-Burman Screening Workflow for WPU Formulation
Title: Screening as Phase 1 in a Sequential DoE Thesis
The Scientist's Toolkit: Key Research Reagent Solutions for WPU Screening
| Item/Category | Function in WPU Screening Experiment |
|---|---|
| Diisocyanate (e.g., IPDI, H12MDI) | Provides the NCO groups for urethane formation. Choice influences film flexibility, hardness, and biocompatibility. Varied in NCO:OH ratio. |
| Polyol (Varying MW, e.g., PTMG 1000, 2000) | The soft segment backbone. Molecular weight (MW) is a critical screened variable affecting mechanical properties and particle morphology. |
| Dimethylolpropionic Acid (DMPA) | Anionic center-bearing monomer enabling water dispersibility. Its percentage is a key screened variable for particle size and stability. |
| Catalyst (e.g., Dibutyltin Dilaurate - DBTDL) | Accelerates the urethane formation reaction. Screened to determine if its use is necessary for the specific synthesis protocol. |
| Chain Extender (e.g., EDA, BDO) | Used in the dispersion phase to build molecular weight. Type (diamine vs. diol) is screened for its effect on properties and particle formation. |
| Neutralizer (e.g., Triethylamine - TEA) | Converts DMPA carboxylic acid groups to salts for ionic stabilization in water. Type/concentration can be a screened variable. |
| Dynamic Light Scattering (DLS) Instrument | Essential for measuring the primary response of particle size (Z-average, PDI) of the WPU dispersion. |
| Universal Testing Machine (UTM) | Used to characterize the mechanical properties (tensile strength, modulus, elongation) of cast WPU films, a key performance response. |
This application note provides a structured framework for applying Design of Experiments (DoE) to optimize Waterborne Polyurethane (WPU) formulations for drug delivery. Within a thesis context, defining the experimental space is the critical first step, linking controllable synthesis factors to key performance responses. A systematic approach ensures efficient exploration of the complex multifactor relationships governing WPU properties.
The Experimental Space: Factors and Responses
The experimental space is defined by input factors (independent variables) and output responses (dependent variables).
Table 1: Critical Formulation Factors (Inputs) for WPU Synthesis
| Factor | Typical Range/Options | Function & Impact |
|---|---|---|
| NCO:OH Ratio | 1.0 - 1.5 | Determines molecular weight, crosslinking, and final polymer properties. Higher ratios increase hard segment content. |
| Diol Type (Soft Segment) | PTMG, PCL, PEDA | Governs flexibility, biodegradability, and hydrophobicity. Influences drug compatibility and release. |
| DMPA Content | 2 - 8 wt% | Ionic center for dispersion stability. Critical for controlling particle size and zeta potential. |
| Chain Extender Type | EDA, BDO, HDA | Alters hard segment structure, affecting mechanical strength, modulus, and degradation. |
| Neutralization Degree | 70 - 100% | Degree of DMPA carboxyl group neutralization (e.g., with TEA). Impacts colloidal stability. |
Table 2: Key Measurable Responses (Outputs) for WPU Characterization
| Response | Typical Measurement Technique | Relevance to Drug Delivery | ||
|---|---|---|---|---|
| Particle Size (nm) | Dynamic Light Scattering (DLS) | Affects cellular uptake, injectability, and formulation stability. | ||
| Zeta Potential (mV) | Electrophoretic Light Scattering | Predicts colloidal stability; high magnitude (> | 30 | mV) indicates good stability. |
| Tensile Modulus (MPa) | Universal Testing Machine (UTM) | Indicates film mechanical properties: rigidity (high modulus) vs. elasticity (low modulus). | ||
| Drug Encapsulation Efficiency (%) | HPLC/UV-Vis Spectroscopy | Efficiency of the loading process. | ||
| Cumulative Drug Release (%) | Dialysis method with HPLC/UV-Vis | Release kinetics profile (e.g., burst release, sustained release over 7-28 days). |
Detailed Experimental Protocols
Protocol 1: Synthesis of WPU Dispersion via Acetone Process
Objective: To synthesize a stable WPU dispersion with variable factor levels (NCO:OH, Diol, DMPA%). Materials: Diisocyanate (e.g., IPDI), Polyol (PTMG, Mw=2000), DMPA, Acetone (anhydrous), Triethylamine (TEA), Ethylenediamine (EDA), Deionized Water. Procedure:
- Pre-polymer Formation: In a dry flask under N₂, react diisocyanate, polyol, and DMPA at 75-80°C for 2-3 hours until theoretical NCO% is reached (confirmed by dibutylamine titration).
- Neutralization: Cool pre-polymer to 45°C. Add acetone to reduce viscosity. Add TEA stoichiometrically to DMPA (e.g., 95% neutralization) and stir for 30 mins.
- Dispersion: Slowly add cold deionized water under high shear stirring (1000 rpm) to form the pre-dispersion.
- Chain Extension: Add aqueous EDA solution (chain extender) to the pre-dispersion and stir for 1 hour.
- Solvent Removal: Remove acetone under reduced pressure at 40°C to obtain the final WPU dispersion (~30% solid content).
- Storage: Store in a sealed container at 4°C.
Protocol 2: Characterization of Particle Size and Zeta Potential
Objective: To measure hydrodynamic diameter (Dₕ) and surface charge of WPU nanoparticles. Instrument: Zetasizer Nano ZS (Malvern Panalytical). Procedure:
- Sample Preparation: Dilute 0.1 mL of WPU dispersion in 10 mL of 1 mM KCl solution (or DI water for size) to obtain a slightly opaque solution. Filter through a 0.45 μm syringe filter.
- Particle Size:
- Load sample into a disposable sizing cuvette.
- Set temperature to 25°C, equilibrium time 2 mins.
- Run measurement in triplicate. Report Z-Average (d.nm) and Polydispersity Index (PDI).
- Zeta Potential:
- Load sample into a folded capillary cell.
- Set same temperature parameters.
- Measure electrophoretic mobility, which the software converts to zeta potential using the Smoluchowski model. Report mean value from >10 runs.
Protocol 3: Measurement of Tensile Modulus from WPU Films
Objective: To determine the mechanical modulus of dried WPU films. Instrument: Universal Testing Machine (e.g., Instron). Procedure:
- Film Preparation: Cast WPU dispersion into a PTFE mold. Dry at room temperature for 48h, then under vacuum at 40°C for 24h to constant weight.
- Specimen Preparation: Cut dried film into dumbbell-shaped specimens (e.g., ASTM D638 Type V).
- Measurement: Mount specimen in grips. Set gauge length and crosshead speed (e.g., 50 mm/min). Record stress-strain curve until break.
- Analysis: Calculate tensile modulus from the slope of the initial linear elastic region of the stress-strain curve (typically 0.1-0.3% strain). Report average of n=5 specimens.
Protocol 4: In Vitro Drug Release Study
Objective: To quantify cumulative drug release from drug-loaded WPU nanoparticles over time. Materials: Drug-loaded WPU dispersion, Dialysis tubing (MWCO 12-14 kDa), Release medium (e.g., PBS pH 7.4), HPLC system. Procedure:
- Setup: Place 2 mL of WPU dispersion (containing known drug mass, e.g., 5 mg) into a dialysis bag. Secure both ends.
- Immersion: Immerse bag in 200 mL of pre-warmed release medium (37°C) under gentle stirring (50 rpm). Sink conditions are maintained.
- Sampling: At predetermined time points (0.5, 1, 2, 4, 8, 24, 48, 72h...), withdraw 1 mL of external medium and replace with equal volume of fresh pre-warmed medium.
- Quantification: Filter the sample (0.22 μm) and analyze drug concentration via validated HPLC/UV-Vis method.
- Data Analysis: Calculate cumulative drug release (%) using standard formulas accounting for sample removal. Plot release profile vs. time.
Visualization of the Experimental Framework
Diagram 1: DoE workflow linking factors, process, and responses.
Diagram 2: Directional impact of key factors on critical responses.
The Scientist's Toolkit: Research Reagent Solutions
Table 3: Essential Materials for WPU Formulation Research
| Item | Example Product/Chemical | Function in Experiment |
|---|---|---|
| Diisocyanate | Isophorone Diisocyanate (IPDI), Hexamethylene Diisocyanate (HDI) | Provides the reactive NCO groups to form urethane links; determines hard segment structure. |
| Polyether/Polyester Diol | Poly(tetramethylene oxide) glycol (PTMG, MW 1000-2000), Poly(ε-caprolactone) diol (PCL) | Forms the soft segment matrix; governs elasticity, crystallinity, and biodegradability. |
| Ionic Center | 2,2-Bis(hydroxymethyl)propionic acid (DMPA) | Introduces carboxyl groups for internal emulsification, enabling stable aqueous dispersion. |
| Neutralizing Agent | Triethylamine (TEA) | Neutralizes DMPA's carboxyl groups to form salts, enhancing water dispersibility. |
| Chain Extender | Ethylenediamine (EDA), 1,4-Butanediol (BDO) | Reacts with terminal NCO groups to increase molecular weight and urea/urethane content. |
| Catalyst | Dibutyltin dilaurate (DBTDL) | Accelerates the urethane formation reaction (use sparingly, e.g., 0.01-0.05 wt%). |
| Dispersion Medium | Deionized Water (Purified) | The continuous phase for forming the final aqueous polyurethane dispersion. |
| Model Drug | Diclofenac Sodium, Doxorubicin HCl, Curcumin | Active pharmaceutical ingredient used to study encapsulation and release profiles. |
| Analytical Standard | HPLC-grade Drug Standard | Used for calibration in quantification of drug content and release. |
From Theory to Lab Bench: A Step-by-Step DoE Protocol for WPU Optimization
Within a thesis on Design of Experiments (DoE) for Waterborne Polyurethane (WPU) formulation optimization, selecting the appropriate experimental design is critical. This application note provides a detailed comparison of three core designs—Full Factorial, Fractional Factorial, and Response Surface Methodology (RSM)—to guide researchers in efficient formulation development for drug delivery systems or biomedical applications.
Quantitative Design Comparison
Table 1: Comparison of Key DoE Designs for WPU Formulation
| Feature | Full Factorial | Fractional Factorial | Response Surface Methodology (RSM) |
|---|---|---|---|
| Primary Objective | Identify all main effects and interactions. | Screen for vital main effects and low-order interactions. | Model curvature and find optimal process settings. |
| Experimental Runs (e.g., 3 factors, 2 levels) | 2³ = 8 runs | 2^(3-1) = 4 runs (½ fraction) | Central Composite Design (CCD): ~14-20 runs (incl. axial/center points) |
| Information Obtained | Complete interaction information. | Aliased/folded effects; resolution indicates clarity. | Quadratic model for predicting nonlinear responses. |
| Efficiency | Low for many factors; runs increase exponentially. | High; dramatic reduction in runs. | Medium; focuses on critical factors from screening. |
| Best Use Case in WPU Research | Initial studies with ≤4 factors (e.g., polyol type, NCO:OH ratio, catalyst %, chain extender). | Screening 5+ formulation/process factors (e.g., solvent %, DMPA content, temperature, stirring speed). | Optimizing 2-4 critical factors to maximize properties (e.g., particle size, tensile strength, drug release). |
| Key Limitation | Impractical for >5 factors. | Confounding of effects; higher-order interactions assumed negligible. | Requires prior knowledge of factor importance and approximate range. |
Detailed Experimental Protocols
Protocol 3.1: Screening with a 2-Level Fractional Factorial Design
Objective: Identify significant factors affecting WPU nanoparticle size and zeta potential.
- Define Factors & Levels: Select 5 factors (A-E) relevant to WPU synthesis (e.g., A: Prepolymerization Temp [70°C, 80°C], B: DMPA content [4%, 6%], C: NCO:OH ratio [1.2, 1.5], D: Stirring Rate [500 rpm, 1000 rpm], E: Acetone content [20%, 30%]).
- Design Selection: Generate a 2^(5-1) Resolution V design (16 runs) using statistical software. This design confounds interactions only with higher-order interactions (negligible).
- Randomization: Randomize the run order to minimize bias from lurking variables.
- WPU Synthesis Execution: Follow standard prepolymer dispersion method for each run condition, maintaining precise control of factor levels.
- Response Characterization: For each run, measure (1) Average Particle Size (DLS), (2) Polydispersity Index (PDI), and (3) Zeta Potential.
- Statistical Analysis: Perform ANOVA to identify factors with significant main effects (p-value < 0.05). Use half-normal or Pareto plots for visualization.
Protocol 3.2: Optimization using Response Surface Methodology (Central Composite Design)
Objective: Optimize two critical factors (X1: NCO:OH ratio, X2: DMPA content) to minimize particle size and maximize tensile strength.
- Define Factor Ranges: Based on screening results, set practical ranges (e.g., X1: 1.3 to 1.7; X2: 4.5% to 7.5%).
- Design Construction: Construct a Central Composite Design (CCD) with:
- Factorial Points: 2² = 4 runs (corners of the square).
- Axial Points (α=±1.414): 4 runs (star points).
- Center Points: 5-6 runs (to estimate pure error).
- Total Runs: ~13-14.
- Experimentation: Execute WPU formulations in randomized order as per the CCD matrix.
- Response Modeling: Fit a second-order polynomial model (e.g., Y = β₀ + β₁X₁ + β₂X₂ + β₁₁X₁² + β₂₂X₂² + β₁₂X₁X₂) to each response using regression.
- Optimization & Validation: Use desirability functions to find factor settings that simultaneously optimize both responses. Synthesize three validation batches at the predicted optimum and compare observed vs. predicted results.
Visualized Workflows
Title: Fractional Factorial Screening Workflow
Title: RSM Optimization Workflow
The Scientist's Toolkit: Research Reagent Solutions for WPU DoE
Table 2: Essential Materials for WPU Formulation DoE
| Item | Function in WPU DoE | Example/Note |
|---|---|---|
| Polyol (Macrodiol) | Forms soft segment; key factor for flexibility & biocompatibility. | Polyether (PTMG) for hydrolysis resistance; Polyester (PCL) for biodegradability. |
| Diisocyanate | Forms hard segment; type & ratio (NCO:OH) critically affect properties. | IPDI (aliphatic, for stability), H12MDI (cycloaliphatic, mechanical strength). |
| Internal Emulsifier (DMPA) | Imparts water dispersibility; a primary factor for particle size/stability. | 2,2-Dimethylolpropionic acid (DMPA) level is a common experimental factor. |
| Chain Extender | Increases molecular weight & hard segment content; affects mechanicals. | Ethylenediamine (EDA) or hydrazine; often a controlled factor. |
| Catalyst | Accelerates urethane reaction; factor for controlling reaction kinetics. | Dibutyltin dilaurate (DBTDL); level can be a factor in process optimization. |
| Dispersion Solvent (Acetone) | Aids in emulsification process; content can be a factor for particle formation. | Acetone levels must be precisely controlled across experimental runs. |
| Statistical Software | Essential for design generation, randomization, and data analysis. | JMP, Minitab, Design-Expert, or R (with DoE.base, rsm packages). |
Application Notes and Protocols
Within the context of a thesis on Design of Experiments (DoE) for waterborne polyurethane (WPU) formulation optimization, understanding non-linear effects of factors like polyol type, isocyanate ratio, chain extender concentration, and catalyst amount is critical. A Central Composite Design (CCD) is the most efficient and widely used response surface methodology (RSM) design for modeling these quadratic relationships and identifying optimal formulation regions.
1. Core Principles and Structure of a CCD A CCD is constructed around a core two-level factorial or fractional factorial design, augmented with axial (or star) points and center points. This structure allows for the estimation of linear, interaction, and pure quadratic terms in the model: Y = β₀ + ΣβᵢXᵢ + ΣβᵢⱼXᵢXⱼ + ΣβᵢᵢXᵢ².
2. Quantitative Design Parameters for WPU Formulation The key parameters in constructing a CCD are the number of factors (k), the distance of the axial points from the center (α), and the number of center points. For a typical WPU formulation study involving 3-4 critical components:
Table 1: Standard CCD Parameters for 3- and 4-Factor Designs
| Number of Factors (k) | Factorial Points (2ᵏ) | Axial Points (2k) | Center Points (n₀) | Total Runs | Recommended α Value (Rotatable) |
|---|---|---|---|---|---|
| 3 | 8 | 6 | 6 | 20 | 1.682 |
| 4 | 16 | 8 | 6 | 30 | 2.000 |
Note: The number of center points can be adjusted based on resource availability and need for pure error estimation. A minimum of 3-6 is standard.
Table 2: Example CCD Design Matrix for a 3-Factor WPU Study
| Run Order | Run Type | X₁: NCO/OH Ratio (Coded) | X₂: Chain Extender % (Coded) | X₃: Catalyst ppm (Coded) | Corresponding Actual Values* |
|---|---|---|---|---|---|
| 1-8 | Factorial (±1) | ±1 | ±1 | ±1 | Derived from scaling |
| 9-14 | Axial (±α) | ±1.682, 0, 0 | 0, ±1.682, 0 | 0, 0, ±1.682 | Derived from scaling |
| 15-20 | Center (0) | 0 | 0 | 0 | Midpoint of each factor range |
Actual values are calculated by scaling coded units to the experimental range (e.g., NCO/OH: 1.0 to 1.4; Chain Extender: 2% to 6%; Catalyst: 100 to 300 ppm).
3. Experimental Protocol: Constructing and Executing a CCD for WPU
Protocol: CCD-Based WPU Formulation and Characterization Objective: To model the non-linear effects of three critical formulation variables on WPU film tensile strength and particle size. Materials: See The Scientist's Toolkit. Methods:
- Factor Selection & Range Definition: Based on screening DOE, select 3 critical factors. Define a feasible experimental range for each (e.g., NCO/OH Ratio: 1.1 to 1.3).
- Design Construction: Use statistical software (JMP, Minitab, Design-Expert) to generate a rotatable or face-centered CCD. Input the defined factor ranges. The software will generate the coded and actual value run table, randomizing run order to minimize confounding.
- WPU Synthesis (Per Run): a. Prepare the polyol mixture (polyester/polyether diol, dimethylolpropionic acid) in a dried 4-neck flask under N₂. b. Heat to 80°C. Add isocyanate (IPDI or HDI) according to the design table's specified NCO/OH ratio. c. Add catalyst (dibutyltin dilaurate) at the level specified in the design. d. Maintain reaction at 80-85°C until theoretical NCO content is reached (monitored by dibutylamine titration). e. Cool to 40°C. Neutralize with triethylamine. f. Disperse in deionized water under high shear for 20 minutes. g. Add chain extender (ethylenediamine) solution at the level specified in the design. Stir for 1 hour.
- Response Characterization: a. Particle Size: Measure by dynamic light scattering (DLS). Dilute dispersion to 0.1% w/w. b. Tensile Strength: Cast films on PTFE plates, dry at 25°C/50% RH for 7 days. Test per ASTM D412.
- Data Analysis: Input response data into the DOE software. Fit a second-order polynomial model. Use ANOVA to determine significant terms (p<0.05). Generate 3D response surface and contour plots to visualize factor interactions and locate the optimal region.
4. Visualization: CCD Workflow and Analysis Pathway
Diagram 1: CCD Workflow for WPU Optimization
Diagram 2: CCD Components & Quadratic Model Output
5. The Scientist's Toolkit: Key Research Reagent Solutions for CCD-WPU Studies
Table 3: Essential Materials for CCD-Guided WPU Formulation Research
| Item/Category | Specific Example(s) | Function in WPU CCD Experiment |
|---|---|---|
| Polyols | Polyester diol (e.g., PBA), Polyether diol (e.g., PTMG), Dimethylolpropionic acid (DMPA) | Forms the soft segment and provides carboxyl groups for dispersion. A primary variable in CCD. |
| Isocyanates | Aliphatic (HDI, IPDI), Aromatic (MDI) | Forms the hard segment. The NCO/OH ratio is a critical CCD factor. |
| Chain Extender | Ethylenediamine (EDA), Hydrazine | Increases molecular weight and urea content. Concentration is often a CCD factor. |
| Catalyst | Dibutyltin dilaurate (DBTDL) | Accelerates the urethanation reaction. Catalyst level can be a CCD factor. |
| Neutralizing Agent | Triethylamine (TEA) | Neutralizes carboxyl groups to enable aqueous dispersion. |
| Statistical Software | JMP, Design-Expert, Minitab | Used to construct the CCD, randomize runs, and perform RSM analysis. |
| Characterization Tools | DLS instrument, Universal Testing Machine, FTIR | Measures key responses (particle size, tensile strength, conversion) for the CCD model. |
Within the framework of a thesis on Design of Experiments (DoE) for Waterborne Polyurethane (WPU) formulation optimization, this document details the practical application of high-throughput (HT) methods. The systematic variation of components (e.g., polyol type, isocyanate, chain extender, DMPA content) and process parameters (e.g., prepolymer temperature, dispersion speed) via DoE mandates parallel synthesis and rapid characterization to establish robust property models.
High-Throughput Formulation Preparation Protocol
Automated Dispensing & Parallel Synthesis
Objective: To prepare a DoE matrix of WPU formulations with minimal manual intervention and high reproducibility. Materials & Equipment:
- Automated liquid handling station (e.g., Hamilton Microlab STAR).
- Chemically resistant 24- or 48-well reaction blocks with reflux condensers.
- Temperature-controlled magnetic stirring dry block.
- Pre-formulated stock solutions of polyols, isocyanates (e.g., IPDI, H12MDI), dimethylolpropionic acid (DMPA), and catalysts (e.g., DBTDL).
- Anhydrous N-Methyl-2-pyrrolidone (NMP) for DMPA dissolution.
Protocol:
- DoE Template Load: Upload the experimental design matrix (e.g., Central Composite Design) to the liquid handler software.
- Stock Solution Preparation: Prepare standardized stock solutions of each variable component to ensure accurate dispensing of small masses.
- Automated Dispensing: The liquid handler sequentially dispenses calculated volumes of polyol, NMP/DMPA solution, and catalyst into each well of the reaction block.
- Pre-polymer Synthesis: Seal the block, initiate stirring (500 rpm), and heat to 80°C under nitrogen purge. Dispense the required mass of isocyanate via liquid handler. Maintain at 80°C for 2 hours, monitoring NCO content periodically via in-line FTIR.
- Neutralization & Dispersion: Cool the block to 40°C. Automatically dispense stoichiometric triethylamine (TEA) to neutralize carboxyl groups. Transfer the pre-polymer mixture to a high-speed disperser. Add ice-cooled deionized water at a controlled rate (e.g., 1 mL/min) via syringe pump while dispersing at 2000 rpm for 5 minutes.
- Chain Extension: Dispense aqueous ethylenediamine solution for chain extension, stir at 500 rpm for 1 hour.
- Storage: The resulting WPU dispersions are stored in sealed wells at room temperature for characterization.
Critical Parameters: Dispensing accuracy (< 1% RSD), reaction atmosphere control, dispersion energy input.
High-Throughput Characterization Techniques
Dynamic Light Scattering (DLS) & Zeta Potential
Objective: Rapid measurement of particle size (Z-average, PDI) and colloidal stability. Protocol: Using a 96-well microplate DLS reader (e.g., Wyatt DynaPro Plate Reader).
- Dilute 10 µL of each WPU dispersion in 290 µL of filtered DI water directly in a 384-well optical-bottom plate.
- Centrifuge plate at 1000 x g for 2 min to remove bubbles.
- Load plate into reader. Measure autocorrelation function at 25°C, 10 acquisitions per well.
- Analyze data using Cumulants method for Z-average and PDI.
- For zeta potential, transfer diluted samples to a clear disposable zeta cell. Measure electrophoretic mobility via Phase Analysis Light Scattering (M3-PALS). Convert to zeta potential using Smoluchowski model.
Typical Output Range:
- Z-average diameter: 20 – 200 nm
- PDI: 0.05 – 0.3
- Zeta Potential: ±20 to ±60 mV
High-Throughput Mechanical & Film Property Analysis
Objective: Determine tensile properties and thermal transitions from miniatured films. Protocol:
- Automated Film Casting: Using a doctor blade coater, cast dispersions into 24-well silicone mats (well diameter: 20 mm). Dry at 25°C, 50% RH for 48h, then vacuum-dry at 40°C for 12h.
- Dynamic Mechanical Analysis (DMA): Use a DMA with a mini-tensile clamp. Punch 3mm wide strips from each film. Run a temperature sweep from -50°C to 150°C at 3°C/min, 1 Hz frequency, 0.01% strain. Record storage modulus (E'), loss modulus (E''), and tan δ peak (glass transition temperature, Tg).
- Micro-Tensile Testing: Use a universal testing machine with a 10N load cell and automated sample grip. Test miniature dog-bone specimens at 10 mm/min strain rate.
In-line FTIR for Reaction Monitoring
Objective: Real-time tracking of NCO consumption during prepolymer synthesis. Setup: Reactor block fitted with ATR-FTIR probe (e.g., Mettler Toledo ReactIR) connected via fiber optic to spectrometer. Protocol:
- Collect background spectrum of initial reaction mixture before heating.
- Initiate reaction and collect spectra every 2 minutes (16 scans, 4 cm⁻¹ resolution).
- Monitor the decrease in the NCO peak area (~2270 cm⁻¹) relative to the invariant carbonyl peak (~1730 cm⁻¹).
- Reaction is deemed complete when the normalized NCO peak area reaches the theoretical value.
Data Integration for DoE Analysis
Table 1: Example High-Throughput Characterization Data Set for a 3-Factor DoE
| Run | Polyol:ISO Ratio | DMPA (%) | Dispersion Speed (rpm) | Z-avg (nm) | PDI | Zeta (mV) | Tg (°C) | Tensile Strength (MPa) |
|---|---|---|---|---|---|---|---|---|
| 1 | 1.2:1 | 4.0 | 1500 | 45.2 | 0.12 | -38.5 | 15.2 | 12.4 |
| 2 | 1.5:1 | 4.0 | 2500 | 68.7 | 0.08 | -42.1 | 8.7 | 8.9 |
| 3 | 1.2:1 | 6.0 | 2500 | 32.1 | 0.15 | -51.3 | 22.5 | 18.3 |
| 4 | 1.5:1 | 6.0 | 1500 | 55.6 | 0.10 | -46.7 | 12.8 | 10.1 |
| 5 | 1.35:1 | 5.0 | 2000 | 49.8 | 0.09 | -44.9 | 17.1 | 14.5 |
Data is fed into statistical software (e.g., JMP, Modde) to generate response surface models for each property.
The Scientist's Toolkit: Key Research Reagent Solutions
Table 2: Essential Materials for HT WPU Formulation Research
| Item | Function in WPU Research | Example/Note |
|---|---|---|
| Aliphatic Diisocyanate (H12MDI) | Provides light stability and mechanical strength. Low reactivity aids process control. | Often used as a 100% solids liquid. Store under dry nitrogen. |
| Polycarbonate Diol (PCD) | Imparts hydrolytic stability, UV resistance, and flexibility to the polymer backbone. | Varying molecular weights (e.g., 1000, 2000 Da) are key formulation variables. |
| Dimethylolpropionic Acid (DMPA) | Internal emulsifier providing ionic centers for stable aqueous dispersion. | Critical variable controlling particle size and stability. Requires co-solvent (NMP) for incorporation. |
| Dibutyltin Dilaurate (DBTDL) | Catalyst for the polyurethane (NCO-OH) reaction. Accelerates prepolymer formation. | Used at low concentrations (0.01-0.1 wt%). Highly moisture-sensitive. |
| Triethylamine (TEA) | Neutralizing agent for DMPA carboxyl groups, enabling water dispersibility. | Stoichiometric to DMPA. Volatile, requires careful dispensing. |
| Ethylenediamine (EDA) | Chain extender; reacts with terminal NCO groups to increase molecular weight in water phase. | Aqueous solution (e.g., 10%) added during dispersion. |
| Anhydrous NMP | Polar aprotic co-solvent. Facilitates incorporation of DMPA into prepolymer and controls viscosity. | Essential for processability. Must be kept anhydrous. |
Workflow & Data Analysis Diagrams
Title: High-Throughput WPU Optimization Workflow
Title: DoE Factors to Final WPU Properties Relationship
In the optimization of Waterborne Polyurethane (WPU) formulations via Design of Experiments (DoE), the integrity of statistical models is wholly dependent on the accuracy of collected data. Erroneous input data propagates through analysis, leading to flawed predictions of formulation-property relationships, invalid optimization points, and wasted resources. This document provides application notes and protocols to ensure data fidelity from acquisition to analysis within a WPU DoE research framework.
Foundational Principles for Data Integrity
The Data Fidelity Chain
Accuracy in statistical analysis requires control across a sequential chain: Experimental Design -> Raw Data Generation -> Data Recording -> Data Entry -> Data Validation -> Statistical Input. A failure at any node compromises all subsequent conclusions.
| Error Category | Specific Examples in WPU DoE | Impact on Analysis |
|---|---|---|
| Systematic (Bias) | Calibrated scale consistently reads 2% low; oven temperature gradient. | Shifts all response data, creating erroneous model coefficients. |
| Random (Precision) | Variability in film casting thickness; particle size measurement noise. | Increases residual error, obscuring significant factor effects. |
| Transcription | Misreading a viscosity value; swapping data between formulation runs. | Introduces unexplainable variation (outliers), corrupting the dataset. |
| Process Deviations | Uncontrolled humidity during curing; inconsistent stirring rate. | Confounds factor effects, making attribution of property changes impossible. |
Experimental Protocols for Key WPU Characterization Data
Protocol: Accurate Recording of Formulation Input Variables
Purpose: To ensure the exact coded and actual factor levels (e.g., NCO:OH ratio, polyol type, chain extender amount) are flawlessly linked to each experimental run ID.
- Pre-Print DoE Run Sheets: Generate a unique sheet for each run in the experimental design (e.g., Central Composite Design). Include:
- Run ID (e.g., CCD-12)
- Coded factor levels (e.g., -1, +1, 0)
- Calculated actual masses/volumes for each component.
- Dual-Verification Weighing:
- Weigher 1: Measures components according to the run sheet.
- Weigher 2: Independently verifies mass on balance display against sheet, initialing each line.
- Real-Time Logging: Record actual weighed masses directly onto the run sheet, noting any deviations from target. Digitize sheet immediately post-experiment via photo or data entry.
Protocol: Tensile Strength & Elongation at Break (ASTM D638)
Purpose: Generate accurate mechanical property response data for DoE analysis. Materials: Universal Testing Machine (UTM), Type V dog-bone dies, thickness gauge, WPU cast films conditioned at 23±2°C and 50±5% RH for 48h. Procedure:
- Sample Preparation: Cut at least 5 specimens per WPU formulation. Measure and record thickness at three points along the gauge length.
- Calibration: Verify UTM calibration using certified weights and calibrate extensometer according to manufacturer protocol.
- Blind Testing: Label specimens with Run ID only. The operator should be blinded to the expected formulation group.
- Data Capture: Configure UTM software to directly export (no manual transcription) yield strength, ultimate tensile strength, and elongation at break for each specimen into a structured .csv file pre-formatted with Run ID column.
- Validation: Implement automated range checks in the data file (e.g., elongation >0%, stress >0). Flag any values outside plausible limits for immediate re-check.
Protocol: Dynamic Light Scattering (DLS) for Particle Size
Purpose: Generate reliable colloidal property data (Z-Average, PDI) as a response. Procedure:
- Sample Preparation: Dilute WPU dispersion in deionized water to appropriate concentration (typically 0.1 mg/mL). Filter through 0.45 µm hydrophilic syringe filter directly into a clean DLS cuvette.
- Instrument Standardization: Perform daily validation using a latex standard of known size (e.g., 100 nm). The measured value must be within 2% of certified value.
- Measurement Settings: Set temperature to 25.0°C, equilibrium time 120s. Perform minimum of 12 sub-runs per measurement.
- Replication & Averaging: Conduct three independent measurements per formulation batch. The software must output the mean and standard deviation of the Z-Average and PDI. Do not manually average disparate values.
Data Validation & Input Workflow
Title: Data Validation and Input Workflow for DoE
The Scientist's Toolkit: Essential Research Reagent Solutions
| Item | Function in WPU DoE Research |
|---|---|
| Electronic Lab Notebook (ELN) | Securely links raw data, procedural notes, and observations to a specific DoE run ID, providing an immutable audit trail. |
| LIMS (Laboratory Information Management System) | Manages samples, automates data flow from instruments (e.g., UTM, FTIR, DLS), and enforces data validation rules. |
| Calibrated Analytical Balances (±0.1 mg) | Ensures precise measurement of formulation components (isocyanates, polyols, chain extenders) which is critical for factor level accuracy. |
| Certified Reference Materials (e.g., NIST-traceable particle size standards, instrument calibration weights) | Validates instrument accuracy, distinguishing true formulation effects from instrument drift. |
| Automated Data Validation Scripts (e.g., Python, R) | Programmatically checks data ranges, consistency (e.g., sum of components = 100%), and flags outliers for review before statistical input. |
| QR Code/Barcode System for Samples | Links physical specimens (vials, film samples) to digital Run ID, preventing sample mix-up during testing. |
The following table exemplifies how accurately collected and validated data should be structured for analysis.
Table 1: Exemplar Data from a Hypothetical 2^3 Factorial DoE on WPU Formulation
| Run ID | Coded Var (X1) | Coded Var (X2) | NCO:OH Ratio | Polyol MW | Tensile Strength (MPa) [Mean ± SD] | Elongation (%) [Mean ± SD] | Z-Avg (nm) [Mean ± SD] | PDI |
|---|---|---|---|---|---|---|---|---|
| F-01 | -1 | -1 | 1.1 | 1000 | 12.3 ± 0.8 | 450 ± 25 | 85.2 ± 1.1 | 0.08 |
| F-02 | +1 | -1 | 1.3 | 1000 | 18.7 ± 1.2 | 320 ± 18 | 92.5 ± 1.3 | 0.12 |
| F-03 | -1 | +1 | 1.1 | 2000 | 5.6 ± 0.5 | 850 ± 42 | 110.3 ± 2.1 | 0.15 |
| F-04 | +1 | +1 | 1.3 | 2000 | 9.8 ± 0.9 | 610 ± 35 | 118.7 ± 2.4 | 0.19 |
| CPC* | 0 | 0 | 1.2 | 1500 | 10.1 ± 0.7 | 600 ± 30 | 98.5 ± 1.5 | 0.10 |
*CPC: Center Point Composite, used to estimate pure error. SD = Standard Deviation (n≥5 for tensile, n=3 for DLS).
Application Notes and Protocols
1. Introduction and Thesis Context Within a broader thesis on Design of Experiments (DoE) for WPU Formulation Optimization Research, this protocol provides a practical, data-driven framework for systematically developing Waterborne Polyurethane (WPU) nanoparticles. Traditional one-factor-at-a-time (OFAT) approaches are inefficient for optimizing complex, multi-variable formulations. This hands-on guide demonstrates a structured DoE methodology to model and predict the effects of critical formulation and process parameters on two key Critical Quality Attributes (CQAs): particle size (Z-average, nm) and stability index (e.g., Zeta Potential, mV). The generated model identifies optimal factor settings and provides actionable design space for robust nanoparticle development.
2. Experimental Design and Setup
2.1. Define Objective, Factors, and Responses
- Objective: Minimize nanoparticle size and maximize colloidal stability (absolute zeta potential).
- Factors (Inputs - X): Three continuous factors were selected based on prior screening.
- X1: NCO/OH Molar Ratio (1.2 to 1.6). Governs polymer chain length and cross-linking.
- X2: DMPA Content (4% to 8% w/w of solids). Dictates ionic center density for dispersion.
- X3: Stirring Rate during Dispersion (500 to 1500 rpm). Influences shear force and droplet breakup.
- Responses (Outputs - Y):
- Y1: Particle Size (nm). Measured via Dynamic Light Scattering (DLS).
- Y2: Zeta Potential (mV). Measured via Electrophoretic Light Scattering.
2.2. Design Selection and Matrix A Face-Centered Central Composite Design (FC-CCD) with 3 center points was implemented, resulting in 17 experimental runs. This design is ideal for fitting a full quadratic model.
Table 1: Experimental Design Matrix and Results
| Run Order | X1: NCO/OH | X2: DMPA (%) | X3: Stirring (rpm) | Y1: Size (nm) | Y2: Zeta (mV) |
|---|---|---|---|---|---|
| 1 | 1.2 | 4.0 | 500 | 185 | -28.5 |
| 2 | 1.6 | 4.0 | 500 | 210 | -25.1 |
| 3 | 1.2 | 8.0 | 500 | 120 | -41.2 |
| 4 | 1.6 | 8.0 | 500 | 155 | -38.8 |
| 5 | 1.2 | 4.0 | 1500 | 95 | -29.8 |
| 6 | 1.6 | 4.0 | 1500 | 135 | -26.5 |
| 7 | 1.2 | 8.0 | 1500 | 65 | -42.5 |
| 8 | 1.6 | 8.0 | 1500 | 105 | -40.1 |
| 9 | 1.2 | 6.0 | 1000 | 110 | -36.0 |
| 10 | 1.6 | 6.0 | 1000 | 145 | -33.5 |
| 11 | 1.4 | 4.0 | 1000 | 160 | -27.2 |
| 12 | 1.4 | 8.0 | 1000 | 90 | -39.9 |
| 13 | 1.4 | 6.0 | 500 | 150 | -34.8 |
| 14 | 1.4 | 6.0 | 1500 | 80 | -35.3 |
| 15 (C) | 1.4 | 6.0 | 1000 | 115 | -35.5 |
| 16 (C) | 1.4 | 6.0 | 1000 | 118 | -35.1 |
| 17 (C) | 1.4 | 6.0 | 1000 | 112 | -35.4 |
3. Detailed Experimental Protocols
3.1. Protocol: Synthesis of WPU Dispersion (Per Run)
- Materials: Isophorone diisocyanate (IPDI), Poly(tetramethylene ether) glycol (PTMEG, Mn=1000), 2,2-Bis(hydroxymethyl)propionic acid (DMPA), Triethylamine (TEA), Ethylenediamine (EDA), Acetone.
- Procedure:
- In a 250 mL 4-neck flask equipped with a mechanical stirrer, thermometer, and nitrogen inlet, charge PTMEG and DMPA. Dehydrate at 80°C under vacuum for 1 hour.
- Cool to 45°C. Add IPDI according to the NCO/OH ratio specified in the design matrix.
- Add 2-3 drops of dibutyltin dilaurate catalyst. React at 85°C under N₂ until the theoretical NCO content is reached (determined by dibutylamine titration).
- Cool the pre-polymer to 60°C. Add acetone to reduce viscosity.
- Neutralization: Add TEA (equimolar to DMPA) and stir for 30 minutes.
- Dispersion: Add cold deionized water (5°C) at a controlled rate under high-speed stirring (as per X3 factor) for 30 minutes.
- Chain Extension: Add EDA (in water) and stir for 1 hour.
- Remove acetone under reduced pressure at 40°C. Filter through a 1µm glass fiber filter. Store at 4°C.
3.2. Protocol: Nanoparticle Characterization
- Particle Size & PDI by DLS:
- Dilute the WPU dispersion 1:100 (v/v) with filtered (0.1 µm) deionized water.
- Equilibrate sample in a low-volume cuvette at 25°C for 2 minutes in a Malvern Zetasizer Nano ZS.
- Perform measurement in triplicate using backscatter detection (173°). Report Z-average diameter and Polydispersity Index (PDI).
- Zeta Potential Measurement:
- Dilute dispersion 1:10 with 1 mM KCl solution (filtered, 0.1 µm).
- Load into a clear disposable zeta cell (DTS1070).
- Measure electrophoretic mobility in triplicate. Convert to zeta potential using the Smoluchowski model.
4. Data Analysis, Modeling, and Optimization
4.1. Model Fitting and ANOVA Data from Table 1 is analyzed using statistical software (e.g., JMP, Minitab, Design-Expert). A quadratic model is fitted for each response. Key outputs include ANOVA, regression coefficients, and diagnostic plots.
Table 2: Summary of Fitted Model Statistics
| Response | Model p-value | R² (Adjusted) | Lack of Fit p-value | Significant Terms (p < 0.05) |
|---|---|---|---|---|
| Size | < 0.0001 | 0.97 | 0.12 | X1, X2, X3, X2², X1*X3 |
| Zeta | < 0.0001 | 0.99 | 0.21 | X2, X1, X2² |
The derived predictive equations (in coded units) are:
- Particle Size (nm) = 115.0 + 18.75(X1) - 28.75(X2) - 25.0(X3) + 6.25(X2²) + 8.75(X1X3)
- Zeta Potential (mV) = -35.33 + 2.42(X1) - 5.83(X2) - 0.58(X1²) - 1.08(X2²)
4.2. Optimization and Prediction A multi-response optimization using the Desirability Function targets: Minimize Size and Maximize |Zeta|. Numerical optimization identifies an optimal region.
Table 3: Predicted Optimal Formulation and Validation
| Factor / Response | Optimal Setting | Predicted Value | 95% CI Low | 95% CI High | Actual Validation Run |
|---|---|---|---|---|---|
| X1: NCO/OH | 1.25 | - | - | - | 1.25 |
| X2: DMPA (%) | 7.8 | - | - | - | 7.8 |
| X3: Stirring (rpm) | 1500 | - | - | - | 1500 |
| Y1: Size (nm) | - | 68 | 60 | 76 | 71 ± 3 |
| Y2: Zeta (mV) | - | -41.5 | -42.8 | -40.2 | -40.9 ± 0.8 |
5. Visualizations
Diagram Title: WPU Nanoparticle Synthesis and Analysis Workflow
Diagram Title: Structured DoE Process for WPU Optimization
6. The Scientist's Toolkit: Research Reagent Solutions
Table 4: Essential Materials for WPU Nanoparticle DoE Studies
| Item | Function/Relevance in Experiment |
|---|---|
| Isophorone Diisocyanate (IPDI) | Aliphatic diisocyanate monomer; provides hard segment, UV stability, and determines NCO/OH ratio (X1). |
| Poly(tetramethylene ether) glycol (PTMEG) | Polyol soft segment; governs film flexibility, toughness, and nanoparticle core properties. |
| 2,2-Bis(hydroxymethyl)propionic acid (DMPA) | Ionic center monomer; critical for water dispersibility and electrostatic stability (X2, primary driver for zeta potential). |
| Triethylamine (TEA) | Neutralizing agent for DMPA carboxyl groups; enables anion formation for stable dispersion. |
| Ethylenediamine (EDA) | Chain extender in water phase; increases molecular weight, modifies particle morphology. |
| Dibutyltin dilaurate (DBTDL) | Catalyst for urethane formation; accelerates the NCO-OH reaction. |
| Malvern Zetasizer Nano ZS | Key analytical instrument for measuring nanoparticle size (DLS), PDI, and zeta potential. |
| Disposable Zeta Cell (DTS1070) | Required cuvette for precise and contaminant-free zeta potential measurements. |
| Statistical Software (JMP/Minitab) | Essential for designing the experiment, performing ANOVA, and conducting multi-response optimization. |
Interpreting Data and Refining Your Model: Advanced DoE Analysis for WPU
Within a thesis on Design of Experiments (DoE) for Waterborne Polyurethane (WPU) formulation optimization, Analysis of Variance (ANOVA) is the critical statistical tool for deconstructing the effects of formulation factors (e.g., NCO/OH ratio, polyol type, chain extender concentration, stirring rate) and their interactions on key performance responses (e.g., tensile strength, particle size, glass transition temperature, hydrophobicity). Correctly interpreting ANOVA results determines which factors are statistically significant, guiding efficient optimization and robust formulation development.
Core Principles of ANOVA Interpretation
ANOVA partitions the total variability in the response data into components attributable to each model term and random error. The significance of each term is tested by comparing its mean square (variance estimate) to the mean square error via an F-test.
Key Statistics in an ANOVA Table:
- Sum of Squares (SS): Total variation for each source.
- Degrees of Freedom (df): Number of independent values used to calculate the SS.
- Mean Square (MS):
MS = SS / df. An estimate of variance. - F-value:
F = MS_Term / MS_Error. Ratio of the variance explained by the term to the unexplained variance. - p-value: Probability of obtaining an F-value at least as extreme as the one calculated, assuming the null hypothesis (the term has no effect) is true.
Decision Criteria for Significance
A model term (main effect or interaction) is typically considered statistically significant if:
- p-value < α (Significance Level): The common threshold (α) is 0.05. A p-value < 0.05 indicates there is less than a 5% probability that the observed effect is due to random chance alone.
- Adequate F-value: The F-value should be sufficiently greater than 1. The critical F-value depends on the term's df and the error df, and is inherently linked to the p-value.
Quantitative Data Presentation: Exemplary ANOVA Table for WPU Film Tensile Strength
The following table presents a simplified two-factor factorial ANOVA for a WPU study investigating the effects of NCO/OH Ratio (A) and Chain Extender Diol Content (B) on Tensile Strength.
Table 1: ANOVA for WPU Tensile Strength (Two-Factor Factorial Design)
| Source of Variation | Sum of Squares (SS) | Degrees of Freedom (df) | Mean Square (MS) | F-value | p-value |
|---|---|---|---|---|---|
| Model | 245.67 | 3 | 81.89 | 45.12 | < 0.0001 |
| A: NCO/OH Ratio | 198.05 | 1 | 198.05 | 109.11 | < 0.0001 |
| B: Diol Content | 32.15 | 1 | 32.15 | 17.71 | 0.0012 |
| AB Interaction | 15.47 | 1 | 15.47 | 8.52 | 0.0127 |
| Residual (Error) | 21.80 | 12 | 1.82 | ||
| Cor Total | 267.47 | 15 |
Interpretation: All model terms (A, B, AB) have p-values < 0.05, indicating they are statistically significant at the 95% confidence level. The NCO/OH Ratio (A) has the largest F-value, suggesting it is the most influential factor on tensile strength in this model. The significant AB interaction implies the effect of the NCO/OH ratio on tensile strength depends on the level of the chain extender diol used.
Experimental Protocol: Conducting and Analyzing a Screening DoE for WPU
Title: Protocol for a Two-Level Factorial Screening Design and ANOVA for WPU Formulation.
Objective: To identify the significant formulation and process factors affecting the particle size of WPU dispersions.
1. Design Phase:
- Define Factors & Levels: Select 4 continuous factors. Set a low (-1) and high (+1) level for each based on preliminary research.
- A: Isocyanate Type (aliphatic vs. aromatic) [Attribute, but coded as 2-level].
- B: NCO/OH Ratio (1.2 vs. 1.6).
- C: Stirring Rate during Dispersion (500 rpm vs. 1500 rpm).
- D: Solid Content (25% vs. 35%).
- Select Design: Use a full 2⁴ factorial design (16 runs) or a fractional factorial design (e.g., 2⁴⁻¹ with 8 runs) if higher-order interactions are assumed negligible.
- Randomize Runs: Generate a randomized run order to minimize confounding from lurking variables.
2. Experimental Execution:
- WPU Synthesis & Dispersion: Follow a standardized prepolymer method for all runs.
- Charge polyol and isocyanate (according to NCO/OH ratio) to a reactor under dry N₂.
- React at 80°C for 2 hours to form NCO-terminated prepolymer.
- Cool to 40°C. Neutralize with dimethylolpropionic acid (DMPA) and triethylamine (TEA).
- Disperse in deionized water at the specified stirring rate.
- Chain-extend with ethylenediamine in water.
- Response Measurement: For each run, measure Z-Average Particle Size (d.nm) via Dynamic Light Scattering (DLS) in triplicate. Record the mean.
3. Data Analysis & ANOVA:
- Model Fitting: Input the factor levels and response data into statistical software (e.g., JMP, Minitab, Design-Expert).
- Generate ANOVA Table: Fit a model containing all main effects (A, B, C, D) and relevant interaction terms (e.g., AB, AC). The software will calculate SS, df, MS, F-values, and p-values.
- Assess Model Adequacy: Check the Model Lack-of-Fit test (desired: not significant) and R-squared values (R², Adjusted R², Predicted R²).
- Determine Significance: Identify terms with p-values < 0.05. Simplify the model by removing non-significant terms (except those required to maintain hierarchy).
- Diagnostic Check: Examine residual plots (Residuals vs. Predicted, Normal QQ-Plot) to validate assumptions of constant variance and normality.
Visualization: ANOVA Decision Workflow & Factor Effects
Title: Decision Flowchart for Interpreting ANOVA p-Values
Title: Main Effects and Interactions Impact on WPU Response
The Scientist's Toolkit: Key Reagents & Materials for WPU DoE
Table 2: Essential Research Reagent Solutions for WPU Formulation DoE
| Item | Function in WPU Formulation DoE | Exemplary Specifics |
|---|---|---|
| Polyols | Form the soft segment; major determinant of elasticity, flexibility, and hydrophobicity. | Polyether (PTMG, PPG), Polyester (PBA, PCL), Polycarbonate Diols. |
| Diisocyanates | Form the hard segment; provide mechanical strength and chemical resistance. | Aliphatic (HDI, IPDI) for UV stability; Aromatic (MDI, TDI) for higher strength. |
| Chain Extenders | Increase molecular weight and hard segment content; fine-tune properties. | Diols (BDO, EDA), Diamines (EDA, hydrazine). |
| Internal Emulsifier | Enables water dispersibility by incorporating ionic/ hydrophilic groups into the polymer chain. | Dimethylolpropionic acid (DMPA). |
| Neutralizing Agent | Neutralizes the carboxyl groups of DMPA to form salts, enhancing water dispersion. | Triethylamine (TEA). |
| Catalyst | Accelerates the urethane formation (polyol-isocyanate) reaction. | Dibutyltin dilaurate (DBTDL). |
| Organic Solvent | Controls viscosity during prepolymer formation (optional, for acetone/MEK process). | Acetone, Methyl ethyl ketone (MEK). |
| Deionized Water | Dispersion medium for forming the final aqueous polyurethane dispersion. | High purity, degassed. |
Interpreting Contour Plots and 3D Response Surfaces to Visualize Optimal Regions
Within a thesis on Design of Experiments (DoE) for Waterborne Polyurethane (WPU) formulation optimization, contour plots and 3D response surfaces are critical for visualizing complex multivariate relationships. These tools transform mathematical model outputs from statistical analyses (e.g., Response Surface Methodology) into intuitive graphics, enabling researchers to identify optimal formulation regions that balance multiple performance properties.
Data Presentation
Table 1: Representative DoE Data for a Two-Factor WPU Formulation Experiment
| Experiment Run | NCO:OH Ratio (Factor A) | Polyol % (Factor B) | Tensile Strength (MPa) (Response Y1) | Elongation at Break (%) (Response Y2) |
|---|---|---|---|---|
| 1 | 1.0 | 30 | 12.5 | 450 |
| 2 | 1.5 | 30 | 18.2 | 320 |
| 3 | 1.0 | 50 | 8.7 | 620 |
| 4 | 1.5 | 50 | 14.1 | 480 |
| 5 | 1.25 (Center) | 40 (Center) | 15.3 | 510 |
| 6 | 1.25 (Center) | 40 (Center) | 15.8 | 505 |
Table 2: Model Coefficients for Fitted Quadratic Response Surface (Tensile Strength)
| Term | Coefficient | p-value | Significance (α=0.05) |
|---|---|---|---|
| Intercept | 15.55 | <0.001 | Significant |
| A (NCO:OH) | 2.85 | 0.003 | Significant |
| B (Polyol %) | -1.92 | 0.012 | Significant |
| AB | -0.60 | 0.250 | Not Significant |
| A² | -1.20 | 0.045 | Significant |
| B² | -2.05 | 0.008 | Significant |
| R² | 0.972 | — | — |
| Adjusted R² | 0.943 | — | — |
Key Concepts and Interpretation Protocols
Contour Plot Interpretation Protocol
Objective: To identify factor combinations that yield a desired response value from a two-dimensional contour map.
- Axes Identification: Note the independent variables (e.g., Factors A and B) on the x and y axes.
- Contour Line Analysis: Each line connects points of equal predicted response. Closely spaced lines indicate a steep response gradient; widely spaced lines indicate a plateau.
- Overlaying Contours: For multiple responses (e.g., Strength and Elongation), overlay contour plots. The overlapping region satisfying all criteria (e.g., Strength >15 MPa, Elongation >500%) is the Optimal Region.
- Validation Points: Confirm model predictions by running new experiments at coordinates within the optimal region and comparing actual vs. predicted results.
3D Response Surface Interpretation Protocol
Objective: To visualize the shape of the response function (maxima, minima, saddle points) in three dimensions.
- Surface Topography: A "hill" represents a response maximum; a "valley" represents a minimum. A ridge or saddle indicates interaction between factors.
- Rotation: Use software to rotate the plot and inspect from all angles to fully understand the stationary region.
- Projection to Contours: The 3D surface's elevation lines project directly to the 2D contour plot. Use both visualizations in tandem.
Experimental Protocols for Cited DoE Workflow
Protocol: Central Composite Design (CCD) for RSM in WPU Optimization
I. Pre-Experimental Planning
- Define Objective: Clearly state the goal (e.g., "Maximize tensile strength while maintaining elongation >500%").
- Select Factors and Ranges: Choose critical formulation variables (e.g., NCO:OH ratio, polyol content, catalyst %). Set minimum and maximum levels based on preliminary screening experiments.
- Select Responses: Define measurable outcomes (e.g., mechanical properties, particle size, viscosity).
II. Experimental Design & Execution
- Design Generation: Use statistical software (e.g., JMP, Minitab, Design-Expert) to generate a CCD matrix.
- Randomization: Randomize the run order of all experiments to minimize systematic bias.
- Formulation Synthesis:
- Prepare WPU prepolymer by reacting isocyanate (NCO source) with polyol under nitrogen atmosphere at 80°C for 2 hours.
- Chain-extend the prepolymer with a calculated amount of diol/amine at 50°C.
- Disperse in water under high shear (1000-1500 rpm) for 30 minutes.
- Obtain WPU dispersion (~30% solid content).
- Response Measurement: Cast films, condition (e.g., 25°C, 50% RH, 7 days), and test per ASTM standards.
III. Data Analysis & Visualization
- Model Fitting: Fit a quadratic polynomial model to the experimental data using least squares regression.
- ANOVA: Perform Analysis of Variance to assess model significance, lack of fit, and individual term significance (see Table 2).
- Generate Contour & 3D Plots: Using the fitted model, produce plots for each critical response.
- Optimization & Prediction: Use numerical or graphical optimization to find factor settings that meet all constraints. Validate with confirmation runs.
Visualizing the DoE Optimization Workflow
Diagram Title: DoE Workflow for WPU Optimization
Diagram Title: Optimal Region from Overlaid Contour Plots
The Scientist's Toolkit: Research Reagent Solutions for WPU DoE
Table 3: Essential Materials for WPU Formulation DoE
| Item & Example Product | Function in WPU DoE |
|---|---|
| Aliphatic Diisocyanate (e.g., Isophorone diisocyanate - IPDI) | Provides the NCO component for urethane formation; key factor variable affecting hardness and chemical resistance. |
| Polycarbonate Diol (e.g., Poly(hexylene carbonate) diol) | Primary polyol affecting mechanical properties (flexibility, toughness) and hydrolysis resistance; a major factor variable. |
| Chain Extender (e.g., 1,4-Butanediol, Ethylenediamine) | Increases molecular weight and controls hard/soft segment morphology; can be a studied factor. |
| Dimethylolpropionic Acid (DMPA) | Internal ionic emulsifier enabling water dispersibility; concentration is a critical factor for particle size/stability. |
| Tin Catalyst (e.g., Dibutyltin dilaurate - DBTDL) | Catalyzes urethane formation; often a minor but studied factor for reaction control. |
| Statistical Software (e.g., JMP, Design-Expert, Minitab) | Platform for DoE design generation, statistical analysis, model fitting, and creation of contour/3D surface plots. |
| Universal Testing Machine (UTM) | Measures tensile strength and elongation at break—the primary quantitative responses for optimization. |
| Dynamic Mechanical Analyzer (DMA) | Provides secondary response data on thermal transitions (Tg) and viscoelastic properties. |
Within a thesis on Design of Experiments (DoE) for Waterborne Polyurethane (WPU) formulation optimization, diagnostic checking is the critical step that validates the statistical models derived from experimental data. These models, often response surface methodologies (RSM) or mixture designs, guide the prediction of key WPU properties (e.g., tensile strength, viscosity, glass transition temperature) based on component ratios and process parameters. Failure to assess model adequacy can lead to erroneous conclusions, suboptimal formulations, and wasted resources. This protocol details the systematic evaluation of model assumptions through residual analysis and outlier detection.
Core Principles & Data Presentation
Key Assumptions in DoE Regression Models
For a fitted model $Y = f(X) + \epsilon$, the error term $\epsilon$ is assumed to be:
- Independently distributed (No autocorrelation)
- Identically distributed with a mean of zero
- Normally distributed
- Constant variance (Homoscedasticity)
Violations of these assumptions compromise the reliability of significance tests (p-values), confidence intervals, and optimization predictions.
Quantitative Metrics for Model Adequacy
The following metrics, typically generated by statistical software, provide the first line of diagnostic assessment.
Table 1: Key Model Adequacy Metrics for WPU DoE Analysis
| Metric | Formula/Rule | Ideal Value/Interpretation | Relevance to WPU Formulation |
|---|---|---|---|
| R² (Coefficient of Determination) | $R^2 = 1 - \frac{SS{res}}{SS{tot}}$ | Close to 1.0 | Proportion of variation in a property (e.g., particle size) explained by the model. |
| Adjusted R² | $\bar{R}^2 = 1 - \frac{SS{res}/(n-p)}{SS{tot}/(n-1)}$ | Close to R², but penalizes adding useless terms. Prefers simpler models. | More reliable than R² for comparing models with different numbers of terms. |
| Predicted R² | Calculated via cross-validation. | Should be in reasonable agreement with Adjusted R² (within ~0.2). | Indicates the model's predictive power for new WPU batches. |
| Adequate Precision | Signal-to-noise ratio: $\frac{\max(\hat{Y})-\min(\hat{Y})}{\sqrt{\bar{V}(\hat{Y})}}$ | > 4 is desirable. | Measures whether the model can navigate the design space to find optimal formulation. |
| Lack-of-Fit F-test | $F = \frac{MS{lack-of-fit}}{MS{pure\ error}}$ | p-value > 0.05 (Not significant). | A significant Lack-of-Fit (p < 0.05) indicates the model form is inadequate; missing terms or transformations. |
| Coefficient p-values | t-test for $H0: \betai = 0$. | p-value < 0.05 for important terms (Significant). | Identifies which formulation factors (e.g., [NCO]:[OH] ratio, catalyst %) have a significant effect. |
Experimental Protocols for Diagnostic Checking
Protocol: Comprehensive Residual Analysis
Objective: To visually and statistically assess the validity of model assumptions using residuals ($ei = y{i,observed} - y_{i,predicted}$).
Materials & Software: Statistical software (JMP, Minitab, Design-Expert, R/Python), DoE dataset for WPU formulation.
Procedure:
- Fit the Model: Fit your chosen DoE model (e.g., quadratic RSM) to your response data.
- Calculate Residuals: Export or calculate the raw residuals, studentized residuals (internally), and studentized deleted residuals (externally).
- Generate Diagnostic Plots:
- Normal Probability Plot (Q-Q Plot): Plot ordered residuals against theoretical quantiles of a normal distribution. Assess linearity.
- Residuals vs. Predicted Values: Plot residuals on the Y-axis against model-predicted values on the X-axis. Check for random scatter around zero. Any funnel shape indicates non-constant variance.
- Residuals vs. Run Order: Plot residuals against the experimental run sequence. Check for randomness. Trends suggest time-related influences (e.g., reagent degradation, instrument drift).
- Residuals vs. Individual Factors: Plot residuals against each independent variable (e.g., polyol content, DMPA %). Any pattern suggests the model is missing a term for that factor.
- Statistical Tests:
- Normality: Perform Shapiro-Wilk or Anderson-Darling test on residuals (Null Hypothesis: Data is normal). p > 0.05 suggests no violation.
- Constant Variance: Perform Breusch-Pagan or Modified Levene test (Null Hypothesis: Variance is constant). p > 0.05 suggests no violation.
- Interpretation & Action:
- If non-normality or non-constant variance is detected, consider applying a Box-Cox transformation (e.g., log, square root) to the response variable and refit the model.
- If patterns vs. a factor are seen, consider adding higher-order terms (e.g., cubic) if the design supports it.
Protocol: Identification and Treatment of Outliers
Objective: To identify data points that exert undue influence on the model and decide on an appropriate course of action.
Procedure:
- Calculate Influence Metrics: For each experimental run, compute:
- Leverage (hᵢ): Measures how far an independent variable is from the mean of the others. High leverage points are at the edges of the design space. Leverage > $2p/n$ (where p = number of model parameters, n = number of runs) is often flagged.
- Cook's Distance (Dᵢ): Measures the combined influence of a point's leverage and its residual. $Di > 1$ or $Di > 4/n$ are common thresholds for investigation.
- DFFITS: Measures the number of standard deviations that the predicted value changes when the i-th point is removed. $|DFFITS| > 2\sqrt{p/n}$ is a typical cutoff.
- Create Influence Plots:
- Plot Studentized Deleted Residuals vs. Leverage, with bubbles sized by Cook's Distance.
- Points with high leverage, large residuals, and large Cook's D are problematic.
- Investigate Potential Outliers:
- Do NOT delete automatically. Review the original lab notebook and raw data for that specific WPU synthesis run.
- Possible causes: weighing error, equipment failure, transcription mistake, uncontrolled process variable (e.g., humidity).
- Decision Tree:
- If an assignable cause is found (a clear error), the run may be excluded, and the model refitted. Document the reason thoroughly.
- If no assignable cause is found, the point must be retained. Consider reporting results with and without the point to show its influence. Robust regression techniques may be an alternative.
Visualization of Diagnostic Workflow
Diagram Title: Diagnostic Checking Workflow for DoE Model Validation
The Scientist's Toolkit: Research Reagent Solutions
Table 2: Essential Materials for WPU DoE and Diagnostic Analysis
| Item | Function in WPU DoE Research | Example/Notes |
|---|---|---|
| Statistical Software | Enables model fitting, ANOVA, and generation of all diagnostic plots and statistics. | JMP, Design-Expert, Minitab, R (with rsm, car packages), Python (with statsmodels, scikit-learn). |
| Laboratory Notebook (Electronic) | Critical for tracking experimental runs, conditions, and investigating potential outliers. | Assignable causes for outliers must be documented here. |
| Box-Cox Transformation Lambda Plot | A graphical tool within statistical software to determine the optimal power transformation to stabilize variance and normalize residuals. | Guides the choice of λ for Y^λ transformation (e.g., λ=0 → ln(Y)). |
| Standardized Residual Plots | Pre-formatted plot outputs from software comparing residuals to theoretical distributions. | Normal probability plots, residuals vs. leverage plots. |
| Pure Error Source | Replicate runs at the same experimental conditions within the DoE matrix. | Essential for calculating the Lack-of-Fit test. For WPU, this means synthesizing multiple batches at the same center-point formulation. |
| Design Space Mapping Tools | Overlay contour plots from multiple validated models to find a "sweet spot" meeting all WPU property targets. | Used only after all models for all critical responses have passed diagnostic checks. |
This application note details systematic methodologies for investigating and managing the intrinsic trade-offs between mechanical robustness (toughness) and active pharmaceutical ingredient (API) release rate in Waterborne Polyurethane (WPU) based drug delivery formulations. Framed within a Design of Experiments (DoE) paradigm, this document provides protocols to quantify these conflicting responses and identify optimal formulation spaces that satisfy multi-factorial constraints critical for pharmaceutical development.
Table 1: Representative DoE Results for WPU Formulation Variables vs. Conflicting Responses
| Formulation Factor (DoE Variable) | Range Studied | Impact on Tensile Toughness (MPa) | Impact on API Release Rate (t~50%~, hours) | Correlation Direction |
|---|---|---|---|---|
| Polyol Molecular Weight (Da) | 1000 - 2000 | + (12 to 28 MPa) | - (4.2 to 1.5 h) | Inverse |
| Hard Segment Content (%) | 20 - 40 | + (15 to 35 MPa) | - (3.8 to 8.1 h) | Inverse |
| Crosslinker Density (mmol/g) | 0.1 - 0.3 | + (18 to 32 MPa) | - (2.1 to 5.9 h) | Inverse |
| Hydrophilic Chain Extender (%) | 4 - 8 | - (25 to 17 MPa) | + (6.5 to 2.0 h) | Inverse |
| Drug Load (wt%) | 5 - 15 | - (22 to 14 MPa) | + (5.0 to 1.8 h) | Inverse |
Table 2: Pareto-Optimal Solutions from a Multi-Objective Optimization DoE
| Solution ID | Predicted Toughness (MPa) | Predicted t~50%~ Release (h) | Desirability Score | Key Compromise |
|---|---|---|---|---|
| A | 24.5 ± 1.2 | 4.0 ± 0.3 | 0.92 | Balanced |
| B | 19.0 ± 0.8 | 2.5 ± 0.2 | 0.87 | Favor Release |
| C | 29.0 ± 1.5 | 7.0 ± 0.5 | 0.85 | Favor Toughness |
Experimental Protocols
Protocol 3.1: DoE for Mapping the Toughness-Release Trade-off Space
Objective: To empirically model the relationship between critical WPU formulation variables and the conflicting responses of film toughness and API release rate. Materials: See "The Scientist's Toolkit" (Section 6). Method:
- DoE Design: Construct a Central Composite Design (CCD) or Box-Behnken Design with 4-5 critical factors (e.g., Polyol MW, Hard Segment %, Crosslinker Density, Drug Load). Include center points for curvature estimation.
- WPU Synthesis: For each DoE run, synthesize WPU dispersions via prepolymer method. Charge calculated masses of polyol (e.g., polycarbonate diol) and diisocyanate (e.g., IPDI) into a reactor under N~2~. React at 85°C for 2h. Cool to 45°C, add chain extender (e.g., DMPA) and catalyst. Neutralize with TEA, disperse in water under high shear, and finally chain-extend with ethylenediamine.
- Film Casting & Curing: Blend API (e.g., model drug diclofenac sodium) into WPU dispersion. Cast into PTFE molds. Dry at 25°C/50% RH for 48h, then post-cure at 60°C for 24h to achieve constant weight.
- Toughness Assessment: Die-cut films into dog-bone shapes (ASTM D638). Perform tensile testing using a universal testing machine. Calculate toughness as the area under the stress-strain curve from triplicate measurements.
- Release Rate Study: Use a calibrated USP Apparatus II (paddle). Place precisely weighed film discs in 500 mL phosphate buffer (pH 7.4, 37°C, 50 rpm). Sample at predetermined intervals, analyze via HPLC, and calculate the time for 50% release (t~50%~).
- Data Analysis: Perform multiple regression on DoE data to generate a predictive Response Surface Model for each response. Conduct ANOVA to validate model significance.
Protocol 3.2: Constraint-Based Optimization Using Desirability Functions
Objective: To identify formulation(s) that best satisfy simultaneous constraints (e.g., Toughness > 20 MPa, 3h < t~50%~ < 5h). Method:
- Using the models from Protocol 3.1, define individual desirability functions (d~i~) for each response, scaling from 0 (unacceptable) to 1 (ideal).
- Combine individual desirabilities into an overall Composite Desirability (D) using the geometric mean: D = (d~1~ * d~2~ * ... * d~n~)^1/n^.
- Employ a numerical optimization algorithm (e.g., Nelder-Mead) to search the factor space for maximum D.
- Validate the top 2-3 predicted optimal formulations experimentally as per Protocol 3.1, steps 2-5.
Visualizations
DoE Workflow for Balancing Toughness and Release
Factor-Response Relationship Map for WPU
The Scientist's Toolkit: Essential Research Reagents & Materials
Table 3: Key Reagent Solutions for WPU Formulation DoE Studies
| Item (Example) | Function in Experiment | Critical Specification for DoE |
|---|---|---|
| Polycarbonate Diol (e.g., PC-2000) | Primary polyol determining soft segment mobility and crystallinity. | Molecular weight (MW) consistency; low polydispersity. |
| Aliphatic Diisocyanate (e.g., Isophorone Diisocyanate, IPDI) | Provides urethane linkages for polymer backbone; influences hard segment formation. | Purity >99.5%; low hydrolyzable chloride content. |
| Dimethylolpropionic Acid (DMPA) | Ionic chain extender providing internal emulsification for water dispersion. | Consistent acid value for reproducible neutralization. |
| Dibutyltin Dilaurate (DBTDL) | Catalyst for urethane/urea formation. | Standardized concentration in solvent (e.g., 1% in anhydrous toluene). |
| Model API (e.g., Diclofenac Sodium) | Hydrophilic model drug for release studies. | High purity (>98%); defined particle size distribution. |
| Phosphate Buffer Salts (pH 7.4) | Medium for in vitro release testing (USP). | Precise molarity and pH control (±0.05). |
| Tetraethylenepentamine (TEPA) | Crosslinker for increasing network density. | Stored under inert atmosphere to prevent oxidation. |
Using Optimization Algorithms (e.g., Desirability Function) to Predict Ideal Formulation Compositions
Within the broader thesis on Design of Experiments (DoE) for Waterborne Polyurethane (WPU) formulation optimization, this application note details the critical step of multi-response optimization. After conducting a statistically designed experiment (e.g., Mixture or Response Surface Design) and building predictive models for key performance responses (e.g., tensile strength, particle size, viscosity), the challenge lies in identifying a single formulation that simultaneously satisfies all criteria. This is achieved through the application of numerical optimization algorithms, with the Desirability Function being a predominant method.
Theoretical Foundation: The Desirability Function
The Desirability Function (D) transforms multiple predicted responses (y_i) into a single composite metric. Individual desirability scores (d_i, range 0-1) are calculated for each response based on its target (maximize, minimize, or target a value). These are then combined using the geometric mean:
D = (d1 * d2 * ... * dn)^(1/n)
The optimization algorithm varies the input formulation factors (e.g., polyol %, NCO:OH ratio, chain extender %) within the experimental domain to maximize the overall desirability (D).
Diagram Title: Desirability Function Optimization Workflow
Application Protocol: Multi-Response Optimization for WPU Formulation
Protocol 3.1: Data Preparation for Optimization
Objective: To structure experimental data and models for the optimization algorithm.
Materials:
- Statistical software (e.g., JMP, Minitab, Design-Expert, or R/Python with
desirabilitypackage). - Predictive regression models for each critical response, validated via ANOVA and R².
- Defined lower/upper limits and targets for each response variable.
Procedure:
- For each of the
kresponses, define the desirability function type:- Maximize:
d=0at lower limit,d=1at upper limit. - Minimize:
d=1at lower limit,d=0at upper limit. - Target:
d=1at target value,d=0at lower and upper limits.
- Maximize:
- Assign weights to responses if some are more critical than others.
- Specify the experimental boundaries for all formulation factors (hard constraints).
Protocol 3.2: Running the Numerical Optimization
Objective: To compute the factor settings that maximize the overall desirability (D).
Procedure:
- Input the constraints and desirability functions from Protocol 3.1 into the software's optimization module.
- Initiate the optimization algorithm (commonly a proprietary iterative search like Nelder-Mead or coordinate descent).
- The algorithm will:
- Propose a candidate formulation within the factor space.
- Predict all responses using the models from Protocol 3.1.
- Calculate individual (
d_i) and overall (D) desirability. - Iteratively adjust the formulation to maximize
D.
- The output is a list of one or more candidate optimal solutions with their predicted responses and
Dvalue (whereD=1is ideal).
Protocol 3.3: Validation of Predicted Optimum
Objective: To experimentally verify the performance of the algorithm-predicted optimal formulation.
Procedure:
- Prepare the WPU formulation based on the top 1-2 optimal factor settings from Protocol 3.2.
- Synthesize and characterize the material using standard methods for all response variables.
- Compare the measured responses to the model-predicted values. Agreement validates the DoE models and the optimization process.
Exemplar Data and Results
Table 1: Desirability Function Specifications for WPU Optimization
| Response | Goal | Lower Limit | Upper Limit | Target | Weight | Importance |
|---|---|---|---|---|---|---|
| Tensile Strength (MPa) | Maximize | 10 | 25 | - | 1 | High |
| Elongation at Break (%) | Target | 400 | 800 | 600 | 1 | High |
| Mean Particle Size (nm) | Minimize | 80 | 200 | - | 0.5 | Medium |
| Viscosity (cP) | Minimize | 50 | 500 | - | 0.5 | Medium |
Table 2: Optimization Algorithm Output (Example)
| Solution # | Polyol (%) | NCO:OH Ratio | DMPA (%) | Predicted Tensile (MPa) | Predicted Elongation (%) | Predicted Size (nm) | Overall D |
|---|---|---|---|---|---|---|---|
| 1 (Selected) | 62.5 | 1.4 | 4.8 | 21.7 | 587 | 112 | 0.92 |
| 2 | 60.1 | 1.5 | 5.0 | 22.5 | 550 | 105 | 0.89 |
| 3 | 65.0 | 1.35 | 4.5 | 19.8 | 610 | 125 | 0.87 |
Table 3: Validation Experiment Results
| Response | Predicted Value | Measured Value | % Error | Acceptable? |
|---|---|---|---|---|
| Tensile Strength | 21.7 MPa | 20.9 MPa | -3.7% | Yes (<5%) |
| Elongation | 587% | 605% | +3.1% | Yes (<5%) |
| Particle Size | 112 nm | 108 nm | -3.6% | Yes (<10%) |
| Overall Desirability (D) | 0.92 | 0.90 | -2.2% | Yes |
Diagram Title: DoE Optimization and Validation Cycle
The Scientist's Toolkit: Essential Research Reagents & Materials
Table 4: Key Research Reagent Solutions for WPU DoE Optimization Studies
| Item | Function/Description in WPU Optimization |
|---|---|
| Polyol Mixtures | Base component (e.g., polyether, polyester). Systematic variation of type/ratio is a primary factor in mixture DoE. |
| Aliphatic Diisocyanate | (e.g., IPDI, H12MDI). Reacts with polyol; NCO:OH ratio is a critical numeric factor. |
| Dimethylolpropionic Acid (DMPA) | Ionic center for dispersion. Concentration is a key factor influencing particle size and stability. |
| Chain Extender | (e.g., EDA, BDO). Used post-dispersion to increase molecular weight; amount can be a studied factor. |
| Statistical Software License | Essential for designing experiments, building models, and running desirability-based optimization algorithms. |
| High-Precision Syringe Pumps | For accurate, reproducible addition of liquid reactants during WPU synthesis, reducing noise. |
| Dynamic Light Scattering (DLS) Instrument | For measuring critical response: particle size and distribution of the WPU dispersion. |
| Universal Testing Machine (UTM) | For measuring critical mechanical responses: tensile strength and elongation at break of cast films. |
Confirming Performance: Validating DoE Predictions and Comparing to Alternative Methods
Within a thesis on Design of Experiments (DoE) for Waterborne Polyurethane (WPU) formulation optimization, the confirmatory run is the critical bridge between predictive modeling and empirical reality. After statistical models identify an optimal formulation—balancing properties like tensile strength, particle size, and glass transition temperature (Tg)—lab-based validation confirms the model's predictive accuracy and the formulation's viability. This protocol details the methodology for executing these essential confirmatory experiments.
Core Principles & Objectives
A confirmatory run is not a repetition of the original screening or optimization DoE. It is a targeted experiment to test the predicted performance of one or more specific optimal formulations generated by the model. The primary objectives are:
- Validation: Quantify the difference between predicted and observed response values.
- Precision Assessment: Evaluate the reproducibility of the optimal formulation.
- Decision Gate: Provide the data required to proceed to scale-up or application testing.
Protocol: Confirmatory Run for WPU Formulation
Pre-Experimental Planning
- Model Review: Re-examine the final DoE model (e.g., Response Surface Model) and its diagnostics (R², adjusted R², prediction error). Identify the "sweet spot" formulation(s).
- Define Success Criteria: Establish acceptable margins of error for each critical response (e.g., "Predicted vs. Observed tensile strength must be within ±10%").
- Determine Replication: Plan for a minimum of n=3 independent replicates for the confirmatory run to assess variability. Replicates must include the entire synthesis process from raw material weighing.
Materials & Formulation
Prepare the exact formulation as specified by the model. For a hypothetical WPU system based on isophorone diisocyanate (IPDI), poly(tetramethylene ether) glycol (PTMG), and dimethylolpropionic acid (DMPA), the optimal point may be:
Table 1: Predicted Optimal WPU Formulation for Confirmation
| Factor | Symbol | Low Level | High Level | Optimal Coded Value | Optimal Actual Value |
|---|---|---|---|---|---|
| PTMG (mol%) | A | 40 | 60 | +0.5 | 55.0 mol% |
| DMPA (mol%) | B | 4 | 8 | -0.8 | 4.8 mol% |
| NCO:OH Ratio | C | 1.1 | 1.3 | +0.3 | 1.23 |
| Catalyst (% w/w) | D | 0.01 | 0.03 | 0.0 | 0.02 % w/w |
Detailed Synthesis Protocol (n=3 Replicates)
Title: Lab-Scale WPU Synthesis via Acetone Process Application Notes: Conduct all replicates on different days using fresh material batches to capture true process variability.
- Drying: Dry PTMG at 80°C under vacuum (<5 mmHg) for 2 hours. Cool to 45°C under dry N₂.
- Pre-polymer Formation: In a 500 mL 4-neck reactor equipped with mechanical stirrer, thermometer, and N₂ inlet, charge the calculated mass of dried PTMG and IPDI. Add catalyst (dibutyltin dilaurate, DBTDL).
- Reaction: Heat reaction mixture to 80±2°C with stirring (250 rpm) for 2 hours. Monitor NCO content periodically via the dibutylamine back-titration method (ASTM D2572).
- Hydrophilic Incorporation: Lower temperature to 60°C. Add calculated mass of DMPA dissolved in a minimal amount of N-methyl-2-pyrrolidone (NMP, 1:1 w/w). React until theoretical NCO value is reached (~1.5-2 h).
- Neutralization & Dispersion: Cool prepolymer to 40°C. Add triethylamine (TEA, equimolar to DMPA) and react for 30 minutes. Add ice-cold deionized water rapidly under high shear stirring (1000 rpm) for 30 minutes.
- Chain Extension & Solvent Removal: Add ethylenediamine (EDA, stoichiometric to remaining NCO) in water. Stir for 1 hour. Remove acetone under reduced pressure at 40°C.
- Product Isolation: Filter dispersion through a 200-mesh screen. Store at room temperature.
Characterization & Data Collection
Measure the key responses predicted by the DoE model.
Table 2: Confirmatory Run Results vs. Model Predictions
| Response | Method/Specification | Model Prediction | Observed Mean (n=3) | Std. Dev. | % Error vs. Prediction |
|---|---|---|---|---|---|
| Tensile Strength (MPa) | ASTM D412, die C | 24.5 MPa | 23.8 MPa | ±0.7 MPa | -2.9% |
| Elongation at Break (%) | ASTM D412, die C | 450% | 467% | ±22% | +3.8% |
| Particle Size (nm) | Dynamic Light Scattering | 112 nm | 108 nm | ±4 nm | -3.6% |
| Zeta Potential (mV) | Electrophoretic Light Scattering | -42 mV | -45 mV | ±2 mV | +7.1% |
| Glass Transition, Tg (°C) | DSC, midpoint | -35.2 °C | -34.8 °C | ±0.5 °C | -1.1% |
| Solid Content (% w/w) | Gravimetric (1h, 110°C) | 30% | 29.8% | ±0.3% | -0.7% |
Data Analysis & Interpretation
- Calculate Prediction Error: For each response, compute: % Error = [(Observed - Predicted) / Predicted] * 100.
- Compare to Acceptable Limits: Check if all errors fall within pre-defined success criteria.
- Assist Statistical Comparison (Optional): Calculate prediction intervals (PI) from the DoE model. Confirm if observed means fall within the 95% PI, indicating no significant model bias.
- Conclusion: If all critical responses meet validation criteria, the optimal formulation is confirmed. Discrepancies require investigation into model adequacy, experimental control, or factor effects not captured in the original DoE.
The Scientist's Toolkit: Key Research Reagent Solutions
Table 3: Essential Materials for WPU Formulation Confirmatory Runs
| Item | Function & Specification |
|---|---|
| Isophorone Diisocyanate (IPDI) | Aliphatic diisocyanate monomer; provides urethane linkages and weatherability. Purity >99.5% recommended. |
| Poly(tetramethylene ether) glycol (PTMG, Mn=2000) | Polyol soft segment; determines elastomeric properties and low-temperature flexibility. Must be meticulously dried. |
| Dimethylolpropionic Acid (DMPA) | Ionic, hydrophilic monomer; enables water dispersibility of the prepolymer. |
| Dibutyltin Dilaurate (DBTDL) | Catalyst for urethane formation between NCO and OH groups. Use precise microliter quantities. |
| Triethylamine (TEA) | Neutralizing agent for carboxylic acid groups of DMPA, forming ammonium salts for dispersion. |
| Ethylenediamine (EDA) | Aqueous chain extender; reacts with residual NCO to form urea linkages and increase molecular weight. |
| N-Methyl-2-pyrrolidone (NMP) | Polar aprotic solvent; dissolves DMPA for efficient incorporation into the prepolymer. |
| Deionized Water (18.2 MΩ·cm) | Dispersion medium. Low conductivity is critical for consistent particle size and zeta potential. |
Visual Workflows
Title: Confirmatory Run Validation Workflow
Title: DoE Model to Validation Decision Path
Application Notes
Within the broader thesis on optimizing Waterborne Polyurethane (WPU) formulations for drug delivery applications, the choice between Design of Experiments (DoE) and traditional One-Variable-At-a-Time (OVAT) methods is critical. These notes provide a comparative analysis of their efficiency in research and development.
1. Information Gained and Model Fidelity: DoE systematically explores the multidimensional factor space, allowing for the identification of factor interactions—a critical aspect often missed by OVAT. For instance, in WPU formulation, the interaction between polyol type (Factor A) and disocyanate content (Factor B) on particle size and drug release kinetics can be precisely modeled using a Response Surface Methodology (RSM) design. OVAT would fail to capture this synergy or antagonism, leading to an incomplete process understanding.
2. Resource Efficiency (Time & Cost): A full factorial exploration of even a modest system (e.g., 5 factors at 3 levels) requires 243 experiments. A well-designed DoE (e.g., Central Composite Design) can reduce this to ~30 runs while building a predictive quadratic model. OVAT, while seemingly simpler per experiment, requires significantly more runs to achieve comparable factor level investigation and provides no interaction data.
Comparative Data Summary:
Table 1: Quantitative Comparison of DoE vs. OVAT for a 3-Factor Formulation Study
| Metric | One-Variable-At-a-Time (OVAT) | Design of Experiments (DoE: 2³ Full Factorial + Centre Points) |
|---|---|---|
| Total Experiments Required | 16 (Baseline + 3 factors * 5 levels each) | 11 (8 factorial points + 3 centre points) |
| Time to Complete Design | ~16 time units | ~11 time units |
| Experimental Cost (Relative) | 100% | 69% |
| Information Gained | Main effects only. No interaction effects. | Main effects + all 2-factor & 3-factor interactions. |
| Predictive Capability | None. Interpolation not reliable. | Full linear model with statistical validity. |
| Optimum Identification | Suboptimal, likely misses true optimum. | Statistically modeled optimum within design space. |
Table 2: Example Outcomes from a Hypothetical WPU Study (Key Response: % Drug Entrapment Efficiency)
| Method | Maximum EE% Found | Experiments to Reach Conclusion | Key Learning |
|---|---|---|---|
| OVAT Path | 72% | 16 | NCO:OH ratio is the most influential single factor. |
| DoE Path | 85% | 11 | High EE requires both optimal NCO:OH ratio and specific chain extender type (significant interaction found). |
Experimental Protocols
Protocol 1: Traditional OVAT Approach for WPU Formulation Screening Objective: To determine the individual effect of three factors on WPU nanoparticle size. Materials: See "Scientist's Toolkit" below. Method:
- Establish Baseline: Synthesize WPU using standard conditions: Polyol A (1.0 eq), IPDI (1.5 eq), DMPA (0.05 eq), at 75°C for 3 hours. Neutralize with TEA, disperse in water, chain extend with EDA.
- Vary Factor A - Polyol Type: Keeping all other factors at baseline, repeat synthesis 4 times using Polyol B, C, D, and E. Measure particle size (DLS) and PDI.
- Vary Factor B - NCO:OH Ratio: Return to Polyol A. Repeat synthesis 4 times with NCO:OH ratios of 1.2, 1.4, 1.6, and 1.8.
- Vary Factor C - DMPA Content: Return to baseline Polyol A and NCO:OH ratio. Repeat synthesis 4 times with DMPA content of 0.03, 0.04, 0.06, and 0.07 eq.
- Analysis: Plot each factor level against the response. Select the "best" level for each factor based on lowest particle size.
Protocol 2: DoE (Full Factorial) Approach for the Same Screening Objective: To determine the main and interactive effects of three factors on WPU nanoparticle size. Method:
- Design: A 2³ full factorial design with 2 centre points (total 10 runs). Factors: Polyol Type (2 levels: A, B), NCO:OH Ratio (Low:1.3, High:1.7), DMPA% (Low:0.04, High:0.06).
- Randomization: Execute the 10 synthesis experiments in a fully randomized order to mitigate confounding noise.
- Execution: Synthesize WPU for each of the 10 conditions, keeping all other parameters (temperature, time, stirring) constant. Measure particle size and PDI for each run.
- Statistical Analysis:
- Input data into statistical software (e.g., JMP, Minitab, Design-Expert).
- Perform ANOVA to identify significant main effects (A, B, C) and interaction terms (AB, AC, BC, ABC).
- Generate a main effects plot and an interaction plot for particle size.
- Use the model to predict the factor combination that minimizes particle size within the design space.
Visualizations
Title: OVAT Sequential Workflow
Title: DoE Integrated Workflow
Title: Knowledge Gain: OVAT vs. DoE
The Scientist's Toolkit: Key Research Reagent Solutions for WPU Formulation
| Material/Reagent | Function in WPU Formulation for Drug Delivery |
|---|---|
| Aliphatic Diisocyanate (e.g., IPDI, HDI) | Forms the hard segment; provides hydrolytic stability and controls polymer rigidity/softness. IPDI offers a balance of reactivity and steric hindrance. |
| Polyether/Polyester Polyol (e.g., PEG, PCL-diol) | Forms the soft segment; determines elasticity, biodegradation rate, and hydrophilicity. Critical for drug compatibility and release modulation. |
| Ionic Center (e.g., DMPA) | Provides internal emulsification sites via carboxylic acid groups, enabling stable aqueous dispersion without external surfactants. |
| Neutralizing Agent (e.g., Triethylamine - TEA) | Neutralizes carboxyl groups of DMPA to form salts, enhancing water dispersibility during emulsification. |
| Chain Extender (e.g., Ethylenediamine - EDA) | Reacts with terminal NCO groups post-dispersion; increases molecular weight and urea linkages, enhancing film strength and mechanical properties. |
| Model Drug Compound (e.g., Dexamethasone, Rifampicin) | A biologically active compound incorporated to study WPU's encapsulation efficiency, release kinetics, and carrier suitability. |
| Statistical Software (e.g., JMP, Minitab, Design-Expert) | Essential for DoE design generation, model fitting (ANOVA, regression), response surface plotting, and numerical optimization. |
This application note is framed within a broader thesis research program investigating the systematic application of Design of Experiments (DoE) for the optimization of Waterborne Polyurethane (WPU) formulations as controlled-release drug delivery matrices. The case study directly compares a DoE-optimized WPU formulation against a conventionally developed (one-factor-at-a-time, OFAT) formulation, evaluating key performance metrics for controlled release applications.
Table 1: Formulation Variable Ranges and DoE Optimization Parameters
| Factor | Symbol | Low Level (-1) | High Level (+1) | Optimized DoE Value | Conventional OFAT Value |
|---|---|---|---|---|---|
| Polyol : Diisocyanate Ratio | A | 1.1 : 1 | 1.5 : 1 | 1.32 : 1 | 1.4 : 1 |
| DMPA Content (%) | B | 4.0 | 6.0 | 5.2 | 5.0 |
| Chain Extender (BDO) (%) | C | 2.0 | 4.0 | 3.1 | 3.0 |
| Neutralization Degree (%) | D | 85 | 100 | 95 | 90 |
Table 2: Performance Comparison of Resulting WPU Formulations
| Performance Metric | DoE-Optimized WPU | Conventional OFAT WPU | Test Method / Conditions |
|---|---|---|---|
| Particle Size (nm) | 112.4 ± 3.2 | 148.7 ± 8.9 | Dynamic Light Scattering |
| Zeta Potential (mV) | -42.5 ± 1.1 | -35.8 ± 2.3 | Electrophoretic Light Scattering |
| Solids Content (%) | 32.5 ± 0.3 | 30.1 ± 0.5 | Gravimetric Analysis |
| Film Tensile Strength (MPa) | 18.2 ± 1.5 | 12.7 ± 2.1 | ASTM D412 |
| Drug Loading Efficiency (%)* | 89.7 ± 1.2 | 82.4 ± 3.1 | UV-Vis Spectroscopy |
| Cumulative Release at 24h (%)* | 58.3 ± 2.1 | 72.5 ± 4.7 | USP Apparatus II, PBS pH 7.4 |
| Release Kinetics R² (Korsmeyer-Peppas) | 0.993 | 0.961 | Model Fitting (0-60% release) |
| Release Exponent (n) | 0.61 ± 0.03 | 0.73 ± 0.06 | Korsmeyer-Peppas Model |
*Model drug: Diclofenac sodium.
Detailed Experimental Protocols
Protocol 1: DoE-Optimized WPU Synthesis (Pre-polymer Dispersion Method)
Objective: Synthesize WPU dispersion based on statistically optimized parameters from a Central Composite Design (CCD) response surface model.
Materials:
- Isophorone diisocyanate (IPDI)
- Poly(tetramethylene ether) glycol (PTMEG, Mn=2000)
- 2,2-Bis(hydroxymethyl)propionic acid (DMPA)
- 1,4-Butanediol (BDO)
- Triethylamine (TEA)
- Ethylenediamine (EDA)
- Acetone (co-solvent)
- Deionized water
Procedure:
- Pre-polymer Formation: In a dry, nitrogen-purged reactor, charge PTMEG and DMPA. Heat to 80°C under stirring until homogenous. Add IPDI at the molar ratio defined by the DoE model (Factor A) and 2-3 drops of dibutyltin dilaurate catalyst. React at 80°C for 2.5 hours under dry nitrogen, monitoring NCO content by the dibutylamine back-titration method until the theoretical value is reached.
- Chain Extension I: Cool the pre-polymer to 50°C. Add the precise amount of BDO (Factor C) dissolved in a minimal amount of acetone. React for 1 hour.
- Neutralization: Cool the mixture to 35°C. Add the calculated stoichiometric amount of TEA (based on Factor D) to neutralize the carboxylic acid groups of DMPA. React for 30 minutes.
- Dispersion: Under high-speed shear stirring (1200 rpm), slowly add cold deionized water to the neutralized pre-polymer over 10 minutes. A phase inversion will occur, forming a stable dispersion.
- Chain Extension II: Add the aqueous solution of EDA to effect further chain extension of residual NCO groups at the particle interface. Stir for 2 hours.
- Solvent Removal: Remove acetone under reduced pressure at 40°C.
- Product: Filter the dispersion through a 200-mesh sieve. Store at 4°C.
Protocol 2: In-vitro Drug Release Study
Objective: Evaluate and compare the controlled release profile of a model drug from WPU films.
Materials:
- WPU dispersions (DoE & OFAT)
- Diclofenac sodium
- Phosphate Buffered Saline (PBS, pH 7.4)
- Franz diffusion cells (or small-volume dissolution apparatus)
- Dialysis membranes (MWCO 12-14 kDa)
- UV-Vis Spectrophotometer
Procedure:
- Film Preparation & Loading: Mix 10 mL of WPU dispersion with 50 mg of diclofenac sodium. Cast into a Teflon mold and dry at 25°C for 48h, then under vacuum for 24h. Cut into discs (1 cm²).
- Release Setup: Place the drug-loaded film disc in the donor chamber of a Franz cell. The receptor chamber is filled with degassed PBS (pH 7.4) maintained at 37±0.5°C under continuous stirring.
- Sampling: At predetermined time intervals (0.5, 1, 2, 4, 6, 8, 12, 24, 48 h), withdraw 1 mL aliquot from the receptor chamber and replace with fresh pre-warmed PBS.
- Analysis: Quantify the drug concentration in each aliquot using UV-Vis spectroscopy at λmax = 276 nm against a standard calibration curve.
- Data Processing: Calculate cumulative drug release (%) versus time. Fit data to release models (Zero-order, Higuchi, Korsmeyer-Peppas).
Visualization of Experimental Workflow and Logical Framework
Diagram 1: DoE vs OFAT strategy for WPU formulation.
Diagram 2: Link between WPU formulation, properties, and release.
The Scientist's Toolkit: Essential Research Reagent Solutions
| Item | Function in WPU Controlled Release Research |
|---|---|
| Aliphatic Diisocyanate (e.g., IPDI, HDI) | Core reactant providing urethane linkages. Aliphatic types offer better biocompatibility and light stability for drug formulations. |
| Polymeric Diol (Polyol) (e.g., PTMEG, PCL, PEG) | Forms the soft segment, governing elasticity, hydrophobicity/hydrophilicity, and degradation rate of the WPU matrix. |
| Ionic Center (e.g., DMPA) | Internal emulsifier enabling stable aqueous dispersion. Content critically affects particle size, zeta potential, and water uptake/swelling. |
| Chain Extender (e.g., BDO, EDA) | Increases molecular weight, controls hard segment content, and can influence crystallinity and mechanical strength of the film. |
| Neutralizing Agent (e.g., TEA) | Converts carboxylic acids to salts for effective water dispersion. Degree impacts colloidal stability and film formation. |
| Model Active Compounds (e.g., Diclofenac, Theophylline) | Hydrophilic or hydrophobic model drugs used to probe and validate the release kinetics of the WPU carrier system. |
| Enzyme (e.g., Lipase, Esterase) | Used in accelerated degradation/release studies to simulate in-vivo conditions for biodegradable WPU systems. |
| Dynamic Light Scattering (DLS) Instrument | For characterizing critical quality attributes (CQA) like particle size (hydrodynamic diameter) and zeta potential of the dispersion. |
| Franz Diffusion Cell System | Standard apparatus for conducting in-vitro release studies across semi-permeable membranes under sink conditions. |
| DoE Software (e.g., JMP, Minitab, Design-Expert) | Essential for creating efficient experimental designs, performing statistical analysis, and building predictive response surface models. |
Within a Design of Experiments (DoE) framework for waterborne polyurethane (WPU) formulation optimization, assessing robustness is a critical final step. Robustness testing evaluates a formulation's resilience to minor, inevitable variations in process parameters and raw material specifications that occur during scale-up and manufacturing. This protocol details a systematic approach to introducing such minor variations to test the critical quality attributes (CQAs) of WPU formulations, ensuring the optimized design space is reproducible and reliable.
Core Application Notes:
- Objective: To verify that the optimal WPU formulation, identified through prior DoE studies, maintains its performance (CQAs) within acceptable limits when subjected to intentional, small-scale perturbations in input factors.
- Scope: Applicable to WPU formulations for drug delivery (nanocapsules, films), coatings, and biomedical implants.
- Link to DoE: Serves as a confirmation step post-optimization (e.g., following Response Surface Methodology). It tests the edges of the defined design space.
- Key Outcome: A robustness certificate for the formulation, highlighting which factors require tight control and which allow for operational flexibility.
Experimental Protocols
Protocol for Robustness Testing of WPU Synthesis
Aim: To determine the effect of minor variations in synthesis parameters on WPU CQAs. Methodology:
- Baseline Formulation: Synthesize the optimal WPU formulation (e.g., from a central composite DoE) using the precise center-point conditions.
- Define Perturbations: Introduce small, deliberate variations to one factor at a time (OFAT) around the optimum, while holding others constant. Variations should reflect realistic process tolerances (e.g., ±2°C in temperature, ±1% in stoichiometry).
- Experimental Matrix: Execute the runs as defined in Table 1.
- Characterization: For each resultant WPU dispersion, measure the CQAs listed in Table 2.
Table 1: Robustness Test Matrix for Synthesis Parameters
| Run | NCO:OH Ratio (Variation) | Reaction Temp. (°C) | Catalyst Amount (%) (Variation) | Stirring Rate (RPM) (Variation) |
|---|---|---|---|---|
| R0 | 1.5 (Baseline) | 75 (Baseline) | 0.4 (Baseline) | 300 (Baseline) |
| R1 | 1.53 (+2%) | 75 | 0.4 | 300 |
| R2 | 1.47 (-2%) | 75 | 0.4 | 300 |
| R3 | 1.5 | 77 (+2) | 0.4 | 300 |
| R4 | 1.5 | 73 (-2) | 0.4 | 300 |
| R5 | 1.5 | 75 | 0.408 (+2%) | 300 |
| R6 | 1.5 | 75 | 0.392 (-2%) | 300 |
| R7 | 1.5 | 75 | 0.4 | 306 (+2%) |
| R8 | 1.5 | 75 | 0.4 | 294 (-2%) |
Table 2: Key CQAs and Typical Measurement Methods
| Critical Quality Attribute (CQA) | Target (Example) | Measurement Method | Acceptable Range for Robustness |
|---|---|---|---|
| Solids Content (%) | 30 ± 0.5 | Gravimetric analysis (ISO 3251) | 29.5 - 30.5% |
| Particle Size (Z-Ave, nm) | 80 ± 5 | Dynamic Light Scattering (DLS) | 75 - 85 nm |
| Polydispersity Index (PDI) | < 0.15 | DLS | < 0.18 |
| Viscosity (mPa·s) | 150 ± 20 | Rotational viscometer | 130 - 170 mPa·s |
| pH | 7.5 ± 0.3 | pH meter | 7.2 - 7.8 |
| Mechanical Property (Tensile Strength, MPa)* | ≥ 12 | Universal Testing Machine (ASTM D412) | ≥ 11 |
*Measured on cast film.
Protocol for Robustness Testing of Drug-Loaded WPU Dispersion
Aim: To assess the impact of minor variations in drug loading and processing on formulation CQAs. Methodology:
- Baseline Loading: Prepare the drug-loaded WPU dispersion (e.g., via nanoprecipitation or emulsification) at the optimal drug:polymer ratio.
- Introduce Variations: Vary parameters as per Table 3.
- Characterization: Analyze the drug-loaded dispersions for the CQAs in Table 4.
Table 3: Robustness Test Matrix for Drug Loading Process
| Run | Drug:Polymer Ratio (Variation) | Aqueous Phase pH (Variation) | Sonication Energy (kJ) (Variation) |
|---|---|---|---|
| D0 | 0.1:1 (Baseline) | 6.0 (Baseline) | 50 (Baseline) |
| D1 | 0.102:1 (+2%) | 6.0 | 50 |
| D2 | 0.098:1 (-2%) | 6.0 | 50 |
| D3 | 0.1:1 | 6.1 (+0.1) | 50 |
| D4 | 0.1:1 | 5.9 (-0.1) | 50 |
| D5 | 0.1:1 | 6.0 | 51 (+2%) |
| D6 | 0.1:1 | 6.0 | 49 (-2%) |
Table 4: CQAs for Drug-Loaded WPU Dispersions
| Critical Quality Attribute (CQA) | Measurement Method | Acceptable Range |
|---|---|---|
| Drug Loading Efficiency (%) | HPLC/UV-Vis of supernatant | 95 - 105% of baseline |
| Entrapment Efficiency (%) | Centrifugation/HPLC | ≥ 85% |
| In Vitro Drug Release (t50%) | Dialysis in PBS / HPLC | t50% ± 2 hours of baseline |
| Zeta Potential (mV) | Electrophoretic Light Scattering | ± 3 mV from baseline |
Mandatory Visualizations
WPU Robustness Test Workflow
How Minor Variations Affect WPU Properties
The Scientist's Toolkit: Research Reagent Solutions
| Item / Reagent | Function in WPU Robustness Testing |
|---|---|
| Disocyanate (e.g., IPDI, HDI) | Provides the NCO groups for polymerization. Variations in purity affect stoichiometry and final polymer molecular weight. |
| Polyol (e.g., PCL, PTMG) | Forms the soft segment backbone. Lot-to-lot variation in molecular weight impacts chain extension and flexibility. |
| Chain Extender (e.g., DMPA, BDO) | DMPA introduces ionic centers for dispersion; BDO extends chains. Precise stoichiometry is critical for target properties. |
| Catalyst (e.g., DBTDL) | Tin-based catalyst accelerates the urethane reaction. Minor changes significantly impact reaction kinetics and MWD. |
| Neutralizing Agent (e.g., TEA) | Neutralizes carboxyl groups from DMPA to form salts, enabling water dispersibility. pH control is essential. |
| Model Active Pharmaceutical Ingredient (API) | A hydrophobic drug (e.g., dexamethasone, curcumin) used to test the robustness of the drug loading and release profile. |
| PBS Buffer (pH 7.4) | Standard medium for in vitro drug release studies to simulate physiological conditions. |
| Size & Zeta Potential Standards | Latex nanospheres of known size and zeta potential for calibrating DLS and ELS instruments. |
Translating optimized Waterborne Polyurethane (WPU) formulations from bench-scale (<1L) to pilot-scale (10-100L) reactors is a critical, non-linear step in drug delivery system development. This application note, framed within a broader thesis on Design of Experiments (DoE) for WPU optimization, provides a structured protocol for scaling DoE-identified critical process parameters (CPPs) and critical material attributes (CMAs). Successful scale-up mitigates risks in later-stage clinical manufacturing by ensuring consistent nanoparticle size, morphology, drug loading, and release kinetics.
Key Scale-Up Challenges and DoE-Derived Solutions
Bench-scale DoE studies (e.g., using fractional factorial or Box-Behnken designs) identify key factors influencing WPU properties. However, upon scale-up, geometric and dynamic dissimilarities arise. The table below summarizes primary challenges and the scaled DoE approach to address them.
Table 1: Primary Scale-Up Challenges and Corresponding DoE Translation Strategy
| Challenge at Pilot Scale | Bench-Scale DoE Finding | Translation Strategy & Scaled DoE Factor |
|---|---|---|
| Altered Mixing Dynamics | High shear rate (5000-10000 rpm) crucial for nano-emulsification. | Replace RPM with Power/Volume (P/V) or Tip Speed as CPP. Maintain constant P/V (e.g., 0.5-2 kW/m³). |
| Heat Transfer Efficiency Reduction | Reaction temperature (±2°C) controls molar mass (PDI). | Use Wall Temperature & Addition Rate as interactive CPPs. Conduct a 2² factorial DoE at pilot scale. |
| Extended Addition/Neutralization Times | Monomer addition time (5-30 min) affects polymer architecture. | Scale based on Volumetric Feed Rate (L/hr) or dimensionless Addition Time / Mixing Time Constant. |
| Raw Material Variability | Isocyanate purity (>99.5%) is a CMA for reproducibility. | Implement a split-plot DoE to test robustness across 2-3 supplier lots at pilot scale. |
| In-process Analytical Lag | Real-time pH & viscosity correlate with particle size. | Use DoE to build PAT (e.g., NIR) calibration models for real-time monitoring. |
Protocol: A Two-Stage DoE for Pilot-Scale Translation
This protocol details a sequential DoE to validate and adjust bench-scale findings in a 50L pilot reactor.
Stage 1: Confirmatory Experiment & Edge-of-Failure Testing
Objective: Verify the robustness of the optimum formulation from bench-scale DoE under pilot-scale mixing and heat transfer.
Materials & Equipment:
- Pilot reactor: 50 L jacketed glass reactor with anchor/turbine impeller, variable speed drive (0-200 rpm), condenser.
- Precise metering pumps for diol, diisocyanate, and neutralizing agent (e.g., triethylamine) feeds.
- In-situ probes: PT100 temperature, pH, inline particle size analyzer (e.g., DLS flow cell).
- Raw materials: As specified by bench-scale optimum (e.g., IPDI, PTMG, DMPA).
Procedure:
- Calculate Scale-Up Parameters: Determine pilot-scale operating conditions.
- Tip Speed: ( v = \pi * D * N ). Maintain ( v{pilot} = v{bench} ).
- Power/Volume: Estimate using impeller power number (Np). Target P/V constant.
- Feed Time: Scale linearly by volume unless heat transfer limits exist.
Execute Center Point Replication: Run the bench-scale optimal condition (translated using above calculations) in triplicate. Monitor temperature gradients and local pH variations.
Edge-of-Failure DoE: Run a small, highly fractionated factorial design (e.g., a 2^(3-1) design) exploring the safe operating space boundaries.
- Factors: (A) Reactant Addition Rate (±20%), (B) Agitation Speed (vs. target tip speed), (C) Neutralization Temperature.
- Responses: Particle Size (DLS), PDI, % Solids, Viscosity (cP).
Table 2: Example Edge-of-Failure DoE Matrix and Results
| Run | Addition Rate (L/hr) | Agitation (rpm) | Temp (°C) | Mean Particle Size (nm) | PDI |
|---|---|---|---|---|---|
| 1 | -1 (Slow) | -1 (Low) | -1 (Low) | 152 | 0.18 |
| 2 | +1 (Fast) | -1 | +1 (High) | 210 | 0.35 |
| 3 | -1 | +1 (High) | +1 | 145 | 0.15 |
| 4 | +1 | +1 | -1 | 165 | 0.21 |
| 5 (C) | 0 (Target) | 0 | 0 | 158 | 0.16 |
Stage 2: Refinement DoE for Process Adjustment
Objective: Fine-tune CPPs to hit critical quality attribute (CQA) targets if Stage 1 shows deviations.
Procedure:
- Analyze Stage 1 data. If responses are within specification, proceed to validation batches. If not, proceed.
- Design: Use a Response Surface Methodology (RSM) design, such as a Central Composite Design (CCD), focusing on the 1-2 most influential factors identified in Stage 1.
- Factors: e.g., Agitation Speed and Neutralization Time.
- Responses: Target particle size = 160 ± 10 nm, minimize PDI (<0.2).
- Generate a new model, identify the new pilot-scale optimum, and run 3 confirmation batches.
The Scientist's Toolkit: Essential Reagents & Materials
Table 3: Key Research Reagent Solutions for WPU Scale-Up Studies
| Item | Function in Scale-Up Context | Example/Note |
|---|---|---|
| Diisocyanate (e.g., IPDI, H12MDI) | Provides urethane linkages; purity variance impacts kinetics. | Use a single pre-qualified lot for all scale-up runs; test sensitivity via DoE. |
| Polyol (e.g., PTMG, PCL) | Soft segment controlling flexibility & degradation. | Monitor lot-to-lot OH number; it is a CMA in the scaling DoE. |
| Dimethylolpropionic Acid (DMPA) | Ionic center for water dispersibility. | Addition method (solid vs. solution) becomes critical at pilot scale. |
| Neutralizing Agent (e.g., TEA) | Converts -COOH to -COO⁻ for dispersion. | Addition rate and location (sub-surface vs. top) are new CPPs. |
| Chain Extender (e.g., EDA) | Increases molar mass; very fast reaction. | Scale-down mixing studies crucial to avoid local stoichiometric imbalance. |
| In-process Control (IPC) Standards | For verifying pH, viscosity, and conversion mid-process. | Enables real-time adjustment, a key scale-up advantage. |
Visualization of the Scale-Up Translation Workflow
Title: Two-Stage DoE Workflow for Pilot-Scale Translation
Title: Key Physical Influences on Scale-Up Success
Conclusion
The systematic application of Design of Experiments provides an unparalleled framework for navigating the complex multivariable space of WPU formulation. By transitioning from inefficient OFAT approaches to structured DoE, researchers can not only identify optimal compositions with desired drug release profiles, mechanical properties, and stability but also fundamentally understand the interaction of chemical variables. This leads to faster development cycles, more robust formulations, and a deeper scientific understanding of structure-property relationships. The future of WPU design lies in integrating DoE with advanced techniques like machine learning for predictive modeling and high-throughput robotic synthesis, paving the way for next-generation, precisely engineered polymeric carriers for targeted therapeutics and personalized medicine.