Implementing Quality by Design in Pharmaceutical Polymer Development: A Modern Framework for Reliable Drug Delivery Systems
This article provides a comprehensive guide to applying Quality by Design (QbD) principles in pharmaceutical polymer development for researchers, scientists, and drug development professionals.
Implementing Quality by Design in Pharmaceutical Polymer Development: A Modern Framework for Reliable Drug Delivery Systems
Abstract
This article provides a comprehensive guide to applying Quality by Design (QbD) principles in pharmaceutical polymer development for researchers, scientists, and drug development professionals. It covers the foundational concepts of QbD, methodological approaches for defining Critical Material Attributes (CMAs) and Critical Process Parameters (CPPs), troubleshooting strategies for common polymer-related issues, and validation techniques for ensuring product robustness. The content aims to bridge the gap between polymer science and regulatory expectations, offering a systematic framework for designing reliable, scalable, and high-quality polymeric drug products.
Quality by Design Essentials: Building the Foundation for Polymer-Based Drug Products
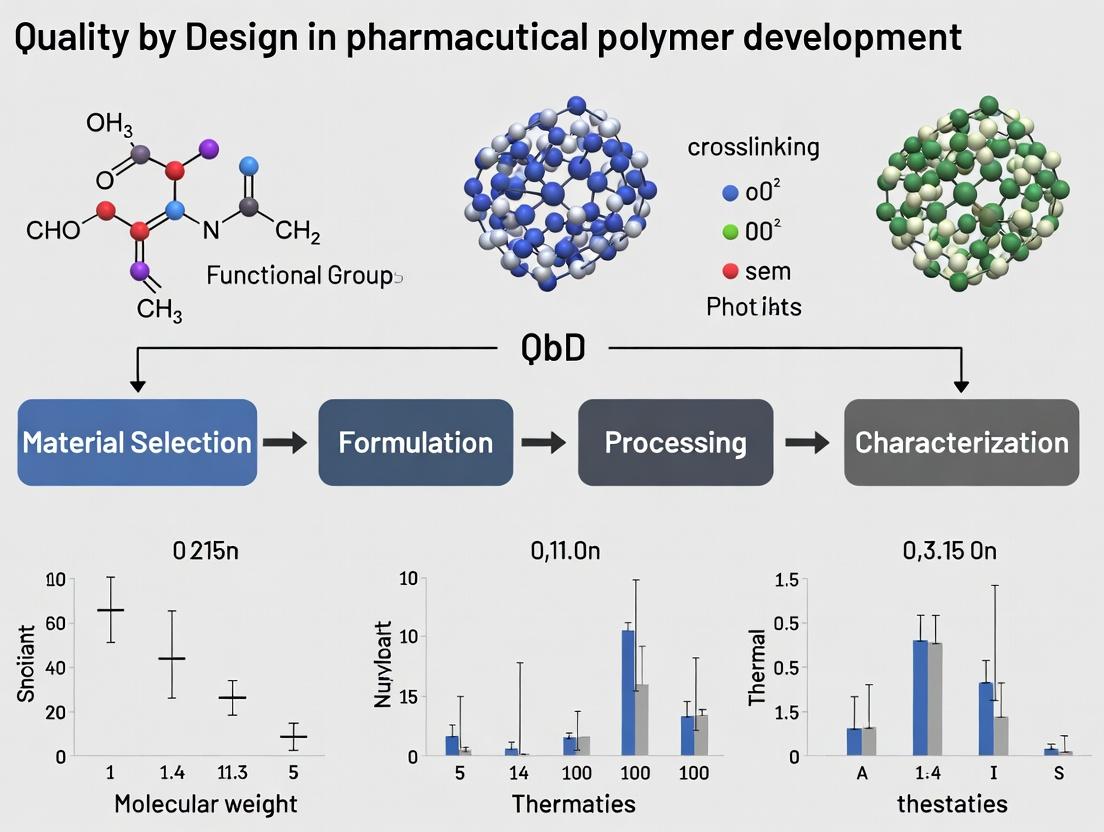
This Application Note situates the principles of Quality by Design (QbD) within the context of pharmaceutical polymer development. QbD, as formalized by ICH guidelines Q8(R2), Q9, and Q10, is a systematic approach to development that begins with predefined objectives and emphasizes product and process understanding and control based on sound science and quality risk management. For polymer science, this translates to the deliberate design of polymer attributes (e.g., molecular weight, polydispersity, functional group composition, degradation profile) to ensure the Critical Quality Attributes (CQAs) of the final drug product, such as drug release kinetics, stability, and bioavailability.
Key ICH Guidelines and Polymer-Specific Interpretations
Table 1: Core ICH QbD Guidelines and Their Application to Polymer Science
| ICH Guideline | Primary Focus | Polymer Development Application |
|---|---|---|
| ICH Q8(R2) | Pharmaceutical Development | Defines Target Product Profile (TPP), identifies CQAs of the polymer-based dosage form, and establishes the link between Material Attributes (MAs) of the polymer and product CQAs. |
| ICH Q9 | Quality Risk Management | Provides tools (e.g., FMEA) to assess risks in polymer synthesis, purification, and processing on final product quality. |
| ICH Q10 | Pharmaceutical Quality System | Establishes a system for knowledge management, change control, and continual improvement across the polymer lifecycle from R&D to commercial. |
| ICH Q11 | Development & Manufacture of Drug Substances | Guides the development of synthetic routes for polymeric drug carriers, including definition of starting materials and control strategies. |
Core QbD Workflow for Pharmaceutical Polymer Development
Application Note: Designing a Controlled-Release Polymer Matrix
Objective: To apply QbD principles in the development of a poly(lactic-co-glycolic acid) (PLGA) based controlled-release microsphere formulation.
Target Product Profile (TPP) Element: Drug X must be released over 28 days with <10% burst release in first 24 hours.
Critical Quality Attributes (CQAs): In-vitro release profile (burst release, duration), particle size distribution, drug loading efficiency, residual solvent.
Critical Material Attributes (CMAs) of PLGA:
- Lactide:Glycolide (L:G) Ratio: Influences degradation rate and release kinetics.
- Molecular Weight (Mn, Mw): Affects polymer viscosity, erosion rate, and diffusion.
- End-Group Chemistry (Free acid vs. Ester-capped): Impacts hydration and degradation rate.
- Inherent Viscosity: Correlates with molecular weight and influences microsphere formation.
Table 2: Example DoE Matrix for PLGA Microsphere Process Optimization
| Experiment | CMA: L:G Ratio | CMA: Mw (kDa) | CPP: Homogenization Speed (rpm) | CPP: Polymer Conc. (% w/v) | Observed CQA: Burst Release (%) | CQA: D50 (µm) |
|---|---|---|---|---|---|---|
| 1 | 50:50 | 15 | 5000 | 3 | 45 | 25 |
| 2 | 75:25 | 15 | 10000 | 3 | 30 | 15 |
| 3 | 50:50 | 50 | 5000 | 6 | 15 | 55 |
| 4 | 75:25 | 50 | 10000 | 6 | 8 | 40 |
| Center Point | 62.5:37.5 | 32.5 | 7500 | 4.5 | 20 | 35 |
Detailed Experimental Protocols
Protocol 5.1: High-Throughput Screening of Polymer CMAs on Drug Release
Title: High-Throughput Solvent Casting for Polymer Film Release Screening.
Objective: To rapidly assess the impact of polymer CMA variations (L:G ratio, Mw) on drug release profiles.
Materials: (See Section 7: Scientist's Toolkit) Method:
- Prepare 96 distinct polymer solutions in a deep-well plate by dissolving varying PLGA types (different L:G, Mw) in DCM at a standard concentration (e.g., 5% w/v).
- Add a fixed concentration of model API (e.g., fluorescein) to each well.
- Using an automated liquid handler, transfer 100 µL from each well to individual wells of a 96-well plate with a non-adherent surface.
- Allow solvent to evaporate under controlled vacuum for 24 hours to form thin polymer films.
- Add 200 µL of phosphate buffer saline (PBS, pH 7.4) release medium to each well. Seal plate.
- Place plate on an orbital shaker (37°C, 100 rpm). At predetermined time points, centrifuge the plate and use a microplate reader to quantify API concentration in the supernatant via UV-Vis or fluorescence.
- Replace with fresh PBS after each measurement.
- Analyze release kinetics (burst release, t50%) and correlate with polymer CMA inputs.
Protocol 5.2: Establishing a Design Space for Emulsion-Solvent Evaporation
Title: DoE for PLGA Microsphere Fabrication via Emulsion-Solvent Evaporation.
Objective: To model the relationship between CPPs/CMAs and microsphere CQAs (size, burst release).
Materials: (See Section 7: Scientist's Toolkit) Method:
- Risk Assessment & DoE Design: Using an Ishikawa diagram, identify potential CPPs. Select key CPPs (e.g., homogenization speed, polymer concentration, surfactant concentration) and CMAs (PLGA type) for a factorial or response surface DoE.
- Internal Phase Preparation: Dissolve a fixed amount of Drug X and the specified PLGA in dichloromethane (DCM).
- External Phase Preparation: Prepare an aqueous solution of polyvinyl alcohol (PVA).
- Emulsification: Add the internal phase to the external phase under continuous high-shear homogenization at the speed and time defined by the DoE matrix.
- Solvent Evaporation & Hardening: Transfer the primary emulsion to a larger volume of stirred aqueous PVA solution. Stir for 3 hours to allow DCM evaporation and particle hardening.
- Harvesting: Collect microspheres by filtration or centrifugation. Wash with water and lyophilize.
- CQA Analysis:
- Particle Size: Analyze by laser diffraction (e.g., Mastersizer).
- Drug Loading: Digest a known weight of microspheres in acetonitrile, quantify Drug X via HPLC.
- In-Vitro Release: Incubate microspheres in release medium (PBS + 0.1% Tween, 37°C). Sample and quantify Drug X release over 28 days.
- Statistical Modeling: Input CPP/CMA variables and CQA responses into statistical software (e.g., JMP, Design-Expert). Generate a predictive model and contour plots to define the operable design space.
Control Strategy for Polymer Synthesis
A control strategy for a QbD-based polymer development includes:
- Input Controls: Specifications for monomer purity, initiator type/amount, solvent quality.
- Process Controls: In-situ monitoring of reaction temperature, pressure, and monomer conversion (e.g., via FTIR or Raman spectroscopy).
- Output Controls: Tests on the synthesized polymer lot: GPC for Mn/Mw/PDI, NMR for L:G ratio, DSC for Tg, residual solvent analysis.
The Scientist's Toolkit: Key Research Reagent Solutions
Table 3: Essential Materials for QbD Polymer Development
| Item | Function & Relevance to QbD |
|---|---|
| Characterized PLGA Libraries | Commercially available sets of polymers with certified CMAs (L:G, Mw, end-group). Essential for DoE studies linking CMA to CQA. |
| Functionalized Monomers (e.g., Lactide-PEG) | Enable synthesis of tailored block copolymers for specific drug delivery profiles (e.g., stealth properties, targeting). |
| RAFT/Macro-RAFT Agents | Provide controlled radical polymerization for precise control over polymer architecture (block, graft), a key CMA. |
| GMP-Grade Polymers | Scalable, well-characterized polymers for transition from preclinical to clinical manufacturing, ensuring consistent CMA. |
| In-Situ Process Analytics (ReactIR, FBRM probes) | Enable real-time monitoring of polymer synthesis (conversion, particle size) for process understanding and control. |
| High-Throughput Formulation Robots | Automate preparation of formulation libraries (as in Protocol 5.1) for efficient design space exploration. |
| Advanced Dispersion Analyzers | Precisely measure particle size, zeta potential, and stability of polymer colloids, key CQAs for nanomedicines. |
Within Quality by Design (QbD) pharmaceutical development, polymers are not inert carriers but Critical Material Attributes (CMAs) that dictate drug product performance. QbD principles demand a systematic understanding of how polymer properties—molecular weight, viscosity, functional group chemistry, and glass transition temperature—influence Critical Quality Attributes (CQAs) like drug release, stability, and bioavailability. This application note details practical protocols for characterizing and utilizing polymers in controlled-release systems, framed within a QbD-based research thesis.
Application Note: Polymer Selection for Modified-Release Formulations
Key Polymer Classes and Their Functions
Polymers serve as release-modifiers, stabilizers, enhancers, and targeting ligands. Their selection is guided by the desired drug release profile and administration route.
Table 1: Common Pharmaceutical Polymers and Key Attributes
| Polymer Class | Example Polymers | Key Functional Attributes | Typical Application in Delivery | CMA Influence on CQA |
|---|---|---|---|---|
| pH-Sensitive | Eudragit L100, S100 (Methacrylates) | Carboxyl groups, dissolution pH threshold | Colon-targeted delivery | Polymer composition & MW affect pH trigger precision & release kinetics. |
| Extended Release | HPMC, Ethylcellulose | Viscosity grade, gelation strength | Matrix tablets, hydrophilic matrices | Viscosity & concentration control gel layer thickness & release rate (Higuchi model). |
| Mucoadhesive | Chitosan, Carbopol | Charge density, hydration rate | Buccal, nasal, GI retention | Molecular weight & charge density impact adhesion strength & residence time. |
| Enteric | HPMCAS, CAP | Acid insolubility, enteric dissolution | Protection from gastric acid | Acetyl/succinyl substitution level dictates dissolution pH & lag time. |
| Thermo-sensitive | Poloxamer 407, PNIPAM | Critical micelle temperature, gelation point | In-situ forming gels | Polymer concentration & MW define gelation temperature & depot integrity. |
QbD-Based Experimental Design for Formulation Optimization
A Design of Experiments (DoE) approach is essential. For a sustained-release matrix tablet, CMAs (polymer viscosity grade, polymer-drug ratio) are input variables. The CQAs (e.g., % released at 2h (Q2), 12h (Q12), time for 50% release (T50)) are monitored responses.
Table 2: Example DoE Matrix and Results for HPMC-Based Matrix Tablet
| Run | CMA1: HPMC Viscosity (cP) | CMA2: Polymer:Drug Ratio | CQA1: Q2 (%) | CQA2: T50 (h) | CQA3: Q12 (%) |
|---|---|---|---|---|---|
| 1 | 4000 | 1:1 | 25.4 | 4.8 | 78.9 |
| 2 | 10000 | 1:1 | 18.1 | 6.5 | 72.3 |
| 3 | 4000 | 2:1 | 12.3 | 8.9 | 85.1 |
| 4 | 10000 | 2:1 | 8.7 | 11.2 | 80.5 |
| Main Effect | Increased Viscosity | Increased Ratio | Decreases | Increases | Variable |
Detailed Experimental Protocols
Protocol: In Vitro Dissolution Testing for pH-Dependent Release
Objective: To evaluate the release profile of a model API from enteric-coated beads using USP apparatus I (baskets). Materials: Eudragit L30 D-55 coated beads, Phosphate buffers (pH 6.8, 7.4), 0.1N HCl (pH 1.2), USP Dissolution Apparatus. Procedure:
- Acid Stage: Place beads equivalent to 100 mg API in 750 mL of 0.1N HCl at 37°C ± 0.5°C. Rotate baskets at 100 rpm. Sample (5 mL) and replace with fresh medium at 60, 120 minutes. Analyze API concentration (HPLC/UV). Release should be <10% at 2h to pass enteric test.
- Buffer Stage: After 2h, carefully drain acid media. Immediately add 750 mL of pre-warmed phosphate buffer pH 6.8. Continue rotation & sampling at 15, 30, 60, 120, 240, 480 mins.
- Data Analysis: Plot cumulative % release vs. time. Calculate T50 and T90. Fit data to release models (Zero-order, Korsmeyer-Peppas).
Protocol: Preparation and Characterization of Polymeric Nanoparticles (Nanoprecipitation)
Objective: To formulate and characterize API-loaded PLGA nanoparticles. Materials: PLGA (50:50, acid-terminated), Acetone (organic solvent), Poloxamer 188 (stabilizer), Model API, Probe Sonicator, Zetasizer. Procedure:
- Organic Phase: Dissolve 50 mg PLGA and 5 mg API in 10 mL acetone.
- Aqueous Phase: Prepare 20 mL of 1% (w/v) Poloxamer 188 solution in DI water.
- Nanoprecipitation: Under magnetic stirring (600 rpm), inject the organic phase into the aqueous phase via syringe pump (1 mL/min).
- Solvent Removal: Stir for 3h to evaporate acetone. Concentrate by rotary evaporation if needed.
- Purification: Centrifuge at 15,000 rpm for 30 min, wash pellet, resuspend in buffer.
- Characterization:
- Size & PDI: Dynamic Light Scattering (Dilute 1:100, measure at 25°C).
- Zeta Potential: Laser Doppler Velocimetry (Dilute in 1mM NaCl).
- Drug Loading: Lyophilize 1 mL aliquot. Dissolve in DMSO, measure API via validated HPLC method. Calculate: Loading Capacity (%) = (Mass of API in NPs / Total mass of NPs) x 100.
Protocol: Rheological Characterization of In Situ Gelling Polymer
Objective: To determine the sol-gel transition temperature (Tsol-gel) of a thermosensitive polymer (e.g., Poloxamer 407). Materials: Poloxamer 407, Refrigerated water bath, Rheometer with Peltier plate, Parallel plate geometry. Procedure:
- Sample Prep: Prepare a 20% (w/v) Poloxamer solution in cold DI water (4°C) with stirring overnight.
- Rheometer Setup: Equip with 40mm parallel plate, set gap to 1000 µm. Load cold sample onto Peltier plate at 5°C.
- Temperature Ramp: Set oscillation frequency (1 Hz), strain (1%, within linear viscoelastic region). Ramp temperature from 5°C to 40°C at 0.5°C/min.
- Data Analysis: Plot storage modulus (G'), loss modulus (G''), and complex viscosity vs. temperature. Tsol-gel is defined as the temperature where G' crosses over G''.
Visualization: QbD Polymer Development Workflow
Diagram Title: QbD Workflow for Polymer Development
The Scientist's Toolkit: Research Reagent Solutions
Table 3: Essential Materials for Polymer-Based Drug Delivery Research
| Item / Reagent Solution | Function / Purpose in Research | Key Considerations |
|---|---|---|
| Hypromellose (HPMC) | Hydrophilic matrix former for sustained release. | Select viscosity grade (K4M, K15M, K100M) based on desired release rate. |
| Eudragit Series (Evonik) | pH-sensitive methacrylates for targeted release (gastric resistance, colon targeting). | L100/S100 (enteric), RS/RL (sustained), E100 (film coating). |
| PLGA (Poly(lactic-co-glycolic acid)) | Biodegradable polymer for microparticles/nanoparticles, implants. | Ratio (LA:GA), molecular weight, end-group (ester/acid) affect degradation time. |
| Poloxamer 407 (Pluronic F127) | Thermo-gelling polymer for in-situ depot formation. | Concentration determines gelation temperature; requires cold preparation. |
| Chitosan (low/medium MW) | Cationic, mucoadhesive polymer for enhancing permeability. | Degree of deacetylation & viscosity are CMAs; soluble in dilute acid. |
| Trehalose (Dihydrate) | Lyoprotectant for stabilizing polymeric nanoparticles during freeze-drying. | Prevents aggregation & maintains particle size upon reconstitution. |
| D-α-Tocopherol PEG 1000 Succinate (TPGS) | Emulsifier/stabilizer for nano-formulations; can inhibit P-gp efflux. | Used to enhance encapsulation efficiency and cellular uptake. |
| Fluorescein Isothiocyanate (FITC) | Fluorescent probe for covalent conjugation to polymers (e.g., chitosan, PLGA). | Enables visualization of polymer fate in cellular uptake & biodistribution studies. |
Within a thesis on Quality by Design (QbD) for pharmaceutical polymer development, precise terminology is foundational. QbD is a systematic, risk-based approach to product and process development that begins with predefined objectives. For polymers used in drug delivery, formulation, or packaging, defining and linking the Quality Target Product Profile (QTPP), Critical Material Attributes (CMAs), Critical Process Parameters (CPPs), and the Design Space is essential for ensuring consistent quality, regulatory flexibility, and scientific understanding.
Terminology & Application to Polymers
Quality Target Product Profile (QTPP)
The QTPP is a prospective summary of the quality characteristics of the final drug product, ensuring safety and efficacy. For polymer-based systems, the QTPP directly informs polymer selection and performance requirements.
Table 1: QTPP Elements Influenced by Polymer Choice
| QTPP Element | Relevance to Polymer | Example for a Sustained-Release Tablet |
|---|---|---|
| Dosage Form & Route | Dictates polymer biocompatibility and degradation. | Oral, matrix tablet. |
| Drug Release Profile | Determined by polymer type, grade, and ratio. | >80% release over 12 hours (zero-order kinetics). |
| Stability/Shelf Life | Polymer must not degrade or interact adversely with API. | 24-month stability at 25°C/60% RH. |
| Patient Compliance | Influenced by polymer-derived attributes (e.g., size, swallowability). | Tablet diameter <10 mm. |
Critical Material Attributes (CMAs) of Polymers
CMAs are physical, chemical, biological, or microbiological properties of a material that must be within an appropriate limit, range, or distribution to ensure desired product quality. For pharmaceutical polymers, CMAs are pivotal.
Table 2: Common CMAs for Pharmaceutical Polymers
| Polymer CMA | Typical Measurement | Impact on Product Quality |
|---|---|---|
| Molecular Weight & Distribution | Gel Permeation Chromatography (GPC) | Controls viscosity, mechanical strength, and drug release rate. |
| Viscosity Grade | Solution viscosity (e.g., Ubbelohde viscometer) | Affects processing (mixing, granulation) and drug release. |
| Glass Transition Temp. (Tg) | Differential Scanning Calorimetry (DSC) | Influences physical stability and mechanical properties. |
| Particle Size & Morphology | Laser diffraction, SEM | Affects flow, compaction, and dissolution uniformity. |
| Degree of Substitution / Hydrolysis | NMR, Titration | Determines solubility, gelation, and interaction with API. |
| Residual Solvents/Monomers | Gas Chromatography (GC) | Impacts safety and biocompatibility. |
Critical Process Parameters (CPPs) in Polymer Processing
CPPs are process parameters whose variability impacts a Critical Quality Attribute (CQA) and therefore must be monitored or controlled to ensure the process produces the desired quality.
Table 3: Example CPPs for a Wet Granulation Process Using a Polymer Binder
| Process Step | Potential CPP | Linked CMA/CQA |
|---|---|---|
| Binder Addition | Binder solution concentration | Polymer distribution, granule strength. |
| Granulation | Impeller speed, addition rate, endpoint torque | Granule particle size, density. |
| Drying | Inlet temperature, drying time | Residual moisture, polymer film formation. |
| Tableting | Compression force, speed | Tablet hardness, dissolution profile. |
Design Space for Polymer-Based Products
The Design Space is the multidimensional combination and interaction of material attributes and process parameters demonstrated to provide assurance of quality. Working within the Design Space is not considered a change, providing operational flexibility.
Key Concept: For a sustained-release matrix tablet, the Design Space might be defined by the interaction between polymer viscosity (CMA), polymer-to-drug ratio (CMA), and compression force (CPP), all mapping to the CQA of drug release rate.
Experimental Protocols
Protocol 1: Establishing CMA – Molecular Weight & Distribution via GPC
Objective: To determine the molecular weight (Mw, Mn) and polydispersity index (PDI) of a polymer (e.g., hydroxypropyl methylcellulose - HPMC).
Materials:
- GPC system with refractive index (RI) detector.
- Appropriate columns (e.g., PLgel Mixed-C).
- HPLC-grade solvent (e.g., water with 0.1M NaNO2 for HPMC).
- Polymer standards for calibration (narrow dispersity pullulan or polyethylene oxide).
- Sample filters (0.45 µm).
Procedure:
- Mobile Phase Preparation: Prepare and degas the specified solvent system.
- System Equilibration: Run mobile phase through the system at 1.0 mL/min until a stable baseline is achieved (typically 30-60 min).
- Calibration: Inject a series of known molecular weight standards. Construct a calibration curve of log(Mw) vs. retention time.
- Sample Preparation: Dissolve the polymer sample at a known concentration (e.g., 2 mg/mL) using gentle agitation. Filter through a 0.45 µm syringe filter.
- Sample Analysis: Inject the prepared sample. Record the chromatogram.
- Data Analysis: Use GPC software to calculate weight-average molecular weight (Mw), number-average molecular weight (Mn), and PDI (Mw/Mn) by comparing the sample's retention profile to the calibration curve.
Protocol 2: Defining a Design Space for Drug Release from a Polymer Matrix
Objective: To investigate the impact of two CMAs and one CPP on the critical quality attribute (CQA) of dissolution rate.
Experimental Design: A Full Factorial Design (2^3) with center points.
- Factor A (CMA): Polymer Viscosity Grade (Low, High)
- Factor B (CMA): Drug-to-Polymer Ratio (1:1, 1:2)
- Factor C (CPP): Compression Force (10 kN, 20 kN)
- Response (CQA): % Drug Released at 8 hours (Q8h).
Materials: API, polymer (two viscosity grades), direct compression excipients, rotary tablet press, USP dissolution apparatus (paddle method), HPLC for assay.
Procedure:
- Blending: Prepare 8 powder blends according to the factorial design matrix.
- Tableting: Compress each blend into tablets at the two target compression forces, measuring tablet hardness.
- Dissolution Testing: Perform dissolution testing (n=6) per USP method (e.g., 900 mL, pH 6.8 buffer, 50 rpm). Sample at 1, 2, 4, 6, 8, and 12 hours.
- Assay: Analyze samples via validated HPLC method to determine % drug released.
- Data Modeling: Input Q8h results into statistical software (e.g., JMP, Design-Expert). Perform multiple linear regression or response surface modeling.
- Design Space Visualization: Generate contour plots or 3D response surface plots showing the region where Q8h meets the specification (e.g., 60-80%). This region is the proposed Design Space.
Visualization: QbD Logic Flow for Polymer Development
Diagram 1: QbD Logic Flow for Polymer Development
The Scientist's Toolkit: Research Reagent Solutions
Table 4: Essential Materials for QbD-Based Polymer Development
| Item / Reagent | Function & Relevance to QbD |
|---|---|
| Polymer Standards (e.g., USP HPMC) | Well-characterized reference materials for establishing analytical methods and benchmarking CMAs. |
| Calibration Kits for GPC/SEC | Narrow dispersity polymer standards (e.g., pullulan, polystyrene sulfonate) essential for accurate Mw determination, a key CMA. |
| Controlled-Release Model APIs | Drugs like theophylline or metoprolol succinate used as model compounds in dissolution studies to screen polymer performance. |
| pH-Buffered Dissolution Media | Biorelevant media (e.g., FaSSIF, FeSSIF) to test polymer performance under physiological conditions, critical for predicting in vivo release (a QTPP element). |
| Thermal Analysis Kits (Indium, Zinc) | Calibration standards for DSC to accurately measure Tg and other thermal transitions, fundamental polymer CMAs. |
| Specific Viscosity Standards | Certified viscosity oils or standard solutions for calibrating viscometers to determine polymer viscosity grade (CMA). |
Application Notes
The implementation of ICH Q8 (Pharmaceutical Development), Q9 (Quality Risk Management), Q10 (Pharmaceutical Quality System), and Q11 (Development and Manufacture of Drug Substances) provides a structured, science- and risk-based framework for the development of pharmaceutical polymers. Within a Quality by Design (QbD) thesis, these guidelines translate theoretical principles into actionable polymer development strategies.
1. ICH Q8 (R2) – Defining the Target Product Profile & Critical Quality Attributes For a polymer intended as a drug delivery matrix, the Target Product Profile (TPP) dictates its Critical Quality Attributes (CQAs). CQAs are physical, chemical, biological, or microbiological properties that must be within an appropriate limit, range, or distribution to ensure desired product quality. A QbD approach requires establishing a link between polymer attributes and drug product performance.
2. ICH Q9 – Risk-Based Prioritization in Polymer Development Quality Risk Management (QRM) is used to identify which material attributes and process parameters of polymer synthesis and purification most significantly impact the CQAs. Tools like Failure Mode and Effects Analysis (FMEA) prioritize experimental efforts.
3. ICH Q10 – Enabling Knowledge Management and Change Control A Pharmaceutical Quality System (PQS) ensures that polymer development knowledge (e.g., structure-property relationships, degradation pathways) is formally documented and maintained. This is critical for justifying the design space of a polymer and managing post-approval changes.
4. ICH Q11 – Control Strategy for the Polymer as a Drug Substance When the polymer is the active pharmaceutical ingredient (e.g., polymeric sequestrants) or a critical excipient with a biological effect, ICH Q11 principles apply directly. A control strategy for the polymer includes starting material controls, in-process controls, and specifications for release.
Table 1: Mapping ICH Guidelines to Polymer Development Activities
| ICH Guideline | Primary Objective | Polymer Development Application Example |
|---|---|---|
| Q8 (R2) | Establish Product & Process Understanding | Define CQAs: Molecular weight distribution, glass transition temperature (Tg), residual monomer content, viscosity, particle size. |
| Q9 | Proactive Risk Management | FMEA on synthesis: Identify high-risk parameters (e.g., initiator concentration, temperature, reaction time) affecting polymer CQAs. |
| Q10 | Establish a Robust PQS | Document and manage knowledge on polymer stability, ensuring consistent performance across batches and enabling continuous improvement. |
| Q11 | Develop a Control Strategy | Justify starting material (monomer) specifications, define proven acceptable ranges for polymerization steps, and set final polymer release tests. |
Experimental Protocols
Protocol 1: Establishing the Design Space for a Controlled-Release Polymer Matrix
Objective: To determine the impact of polymer molecular weight (MW) and drug-to-polymer ratio (D:P) on the critical quality attribute of in vitro drug release rate.
Materials & Reagents:
- Active Pharmaceutical Ingredient (API)
- Polymer (e.g., PLGA) with three distinct viscosity-average molecular weights (Low: 15kDa, Medium: 50kDa, High: 100kDa)
- Methylene chloride (Dichloromethane)
- Polyvinyl alcohol (PVA) solution (1% w/v)
- Deionized water
- Phosphate buffer saline (PBS), pH 7.4
Procedure:
- Experimental Design: Execute a full factorial design (3²) with factors: Polymer MW (3 levels) and D:P ratio (e.g., 1:1, 1:2, 1:3).
- Microsphere Preparation: For each condition, dissolve the API and polymer in methylene chloride. Emulsify this solution into 1% PVA solution using a high-speed homogenizer (10,000 rpm, 2 min).
- Solvent Evaporation: Stir the emulsion continuously at room temperature for 3 hours to evaporate the solvent.
- Product Isolation: Collect the formed microspheres by filtration, wash with deionized water, and lyophilize for 24 hours.
- In Vitro Release Testing: Place ~50 mg of microspheres in 50 mL of PBS (pH 7.4) at 37°C under constant agitation (100 rpm). Withdraw samples at predetermined time points (1, 3, 6, 12, 24, 48, 72, 168 hours).
- Analysis: Quantify API concentration in release samples via HPLC. Calculate cumulative release (%).
- Data Modeling: Fit release profiles to kinetic models (e.g., Higuchi, Korsmeyer-Peppas). Use ANOVA to determine the significance of each factor and their interaction on the release rate (time for 50% release, T₅₀).
Protocol 2: Risk Assessment via FMEA for Polymer Synthesis
Objective: To identify and rank potential failure modes in a ring-opening polymerization (ROP) process for a polyester.
Procedure:
- Define Process Steps: Break down synthesis into: 1. Monomer/Initiator Drying, 2. Charging & Purging, 3. Polymerization Reaction, 4. Precipitation & Isolation, 5. Drying & Sieving.
- Assemble Team: Include polymer chemist, process engineer, and analytical scientist.
- Identify Failure Modes: For each step, brainstorm how it can fail (e.g., Step 3: Incomplete conversion due to incorrect temperature).
- Analyze Risks: For each failure mode, rate (scale 1-10):
- Severity (S): Impact on polymer CQAs (e.g., MW, dispersity).
- Occurrence (O): Likelihood of the failure occurring.
- Detection (D): Ability to detect the failure before the next step.
- Calculate RPN: Compute Risk Priority Number: RPN = S × O × D.
- Prioritize & Plan: Actions are directed at failure modes with the highest RPN. For example, high RPN for temperature control leads to implementing automated temperature monitoring and defining a proven acceptable range.
Table 2: Example FMEA Fragment for Polymerization Reaction Step
| Process Step | Potential Failure Mode | Potential Effect on CQA | S | O | D | RPN | Recommended Action |
|---|---|---|---|---|---|---|---|
| Polymerization Reaction | Deviation from setpoint temperature | Altered MW and dispersity (Đ) | 8 | 4 | 3 | 96 | Implement in-line temperature logger; define PAR ± 2°C. |
| Polymerization Reaction | Impurity in monomer feed | Increased residual monomer; altered Tg | 7 | 3 | 4 | 84 | Tighten incoming monomer specification; include identity test. |
Visualizations
Title: QbD Workflow for Polymer Development Under ICH
Title: ICH Q11-Inspired Control Strategy for a Polymer
The Scientist's Toolkit: Key Research Reagent Solutions
| Item / Reagent | Function / Role in Polymer QbD |
|---|---|
| Functionalized Monomers (e.g., Lactide, Caprolactone, N-vinyl pyrrolidone) | Building blocks for controlled synthesis. Variability in purity is a key CMA; sourcing from qualified suppliers with tight specifications is essential. |
| Catalysts & Initiators (e.g., Stannous octoate, AIBN, TEA) | Drive polymerization kinetics and control end-group chemistry. Critical process parameters (concentration, addition rate) require precise control. |
| Chain Transfer Agents (e.g., Dodecanethiol, 1-Butanol) | Used to control polymer molecular weight (a key CQA) and dispersity (Đ). Their purity and stoichiometry are critical. |
| Deuterated Solvents (e.g., CDCl₃, DMSO-d₆) | Essential for NMR analysis to determine monomer conversion (in-process control), copolymer composition, and end-group analysis. |
| Size Exclusion Chromatography (SEC) Kits | Calibrated columns and standards (e.g., narrow polystyrene, polyethylene glycol) are critical for accurately determining MW and Đ, the primary CQAs. |
| Thermal Analysis Standards (e.g., Indium, Zinc) | Used to calibrate DSC instruments for accurate measurement of Glass Transition Temperature (Tg) and melting point, which are key stability and performance CQAs. |
| Residual Solvent & Monomer Kits | Certified reference standards and headspace vials for GC analysis to ensure safety and compliance with ICH Q3C/Q3D guidelines. |
Application Notes
Within a Quality by Design (QbD) framework for pharmaceutical polymer development, proactive risk assessment is a foundational activity. This document outlines critical failure points in the selection and processing of polymers for drug product formulation (e.g., solid dispersions, controlled-release matrices, coating systems) and provides structured protocols for their investigation.
1.0 Key Failure Modes in Polymer Selection & Processing Polymer performance is governed by intrinsic material properties and extrinsic process-induced changes. The following table summarizes primary risk categories and potential failure modes impacting Critical Quality Attributes (CQAs) like dissolution, stability, and bioavailability.
Table 1: Risk Matrix for Polymer Selection and Processing
| Risk Category | Potential Failure Mode | Impact on CQA(s) | Likelihood (Initial) |
|---|---|---|---|
| Material Properties | Variability in molecular weight (MW) & dispersity (Ð) | Dissolution rate, drug release kinetics, physical stability | High |
| Material Properties | Impurity profile (residual monomers, catalysts, antioxidants) | Chemical stability, toxicity | Medium |
| Material Properties | Glass Transition Temperature (Tg) mismatch with drug & process temp. | Physical instability (crystallization), poor miscibility | High |
| Processing (Thermo-mechanical) | Polymer degradation (chain scission, cross-linking) during hot melt extrusion (HME) | Drug release profile, mechanical properties | High |
| Processing (Solution-based) | Incomplete solvent removal in spray drying or film casting | Residual solvents, physical form instability | Medium |
| Drug-Polymer Interaction | Lack of adequate drug-polymer miscibility | Phase separation, drug crystallization on storage | High |
| Environmental | Moisture uptake (hygroscopicity) affecting flow & compaction | Content uniformity, dissolution, chemical stability | Medium-High |
2.0 Experimental Protocols for Risk Mitigation
Protocol 2.1: Assessing Drug-Polymer Miscibility and Tg Prediction Objective: To determine the thermodynamic propensity for drug-polymer mixing and predict the Tg of amorphous solid dispersions. Materials: Drug substance, polymer (e.g., PVP, HPMCAS, Soluplus), analytical balance, DSC, dry powder mixing equipment. Procedure:
- Prepare physical mixtures of drug and polymer at varying ratios (e.g., 10:90, 30:70, 50:50 w/w).
- Analyze each mixture and pure components by Differential Scanning Calorimetry (DSC). Use a heating rate of 10°C/min under nitrogen purge.
- Determine the Tg of the polymer and any melting endotherm of the drug.
- For miscibility assessment, note any depression of the drug's melting point and the presence of a single, composition-dependent Tg in the mixture.
- Compare experimental Tg values to predictions from the Gordon-Taylor equation:
Tg(mix) = (w1*Tg1 + K*w2*Tg2) / (w1 + K*w2), whereK ≈ (ρ1*α1)/(ρ2*α2)(often estimated via Simha-Boyer rule:K ≈ ρ1*Tg1 / ρ2*Tg2). Significant deviations indicate non-ideal mixing.
Protocol 2.2: Evaluating Process-Induced Degradation during Hot Melt Extrusion Objective: To quantify chemical and molecular weight changes in a polymer due to thermo-mechanical stress. Materials: Polymer, plasticizer (if applicable), twin-screw extruder, GPC/SEC system, DSC. Procedure:
- Establish a baseline: Characterize native polymer via Gel Permeation Chromatography (GPC/SEC) for MW and Ð, and DSC for Tg.
- Process the polymer (with/without drug) via HME across a design space of varying parameters: Barrel Temperature (T), Screw Speed (RPM), and Residence Time.
- Collect extrudates and allow to equilibrate under controlled humidity.
- Dissolve processed material in appropriate mobile phase. Filter and analyze by GPC/SEC. Compare MW and Ð to baseline.
- Calculate % change in MW. A significant decrease indicates chain scission; an increase suggests cross-linking.
- Correlate MW changes to processing parameters to define a safe operating space.
Table 2: Representative Data from HME Processing Risk Study
| Processing Condition (T, RPM) | Mw (kDa) Post-Process | Polydispersity Index (Ð) | Tg Shift (°C) | Observation |
|---|---|---|---|---|
| Control (Native Polymer) | 120.5 | 1.85 | 100.2 | -- |
| Condition A (Low Stress) | 118.7 | 1.87 | 99.8 | Minimal change |
| Condition B (High Temp) | 105.3 | 1.92 | 98.5 | Moderate chain scission |
| Condition C (High RPM, High Temp) | 95.8 | 2.15 | 97.1 | Significant degradation, broader MW distribution |
3.0 Visualizing the Risk Assessment Workflow
Title: QbD Risk Assessment Workflow for Polymer Development
4.0 The Scientist's Toolkit: Research Reagent Solutions
Table 3: Essential Materials for Polymer Risk Assessment Studies
| Item / Reagent | Function & Rationale |
|---|---|
| Model Polymers (PVP-VA, HPMCAS, Soluplus) | Widely studied, varied chemistry for benchmarking miscibility and processability. |
| Thermoplastic Polyester (PLGA) | Model for studying hydrolytic degradation and controlled release. |
| GPC/SEC Standards (Polystyrene, PEG) | Calibrate molecular weight distribution analysis for degradation studies. |
| Inert Dielectric Fluid (e.g., Silicone Oil) | Used as a heating medium in hot-stage microscopy for observing melt behavior. |
| Stable Free Radical (e.g., BHT) | Added to polymer melts to study/mitigate oxidative degradation pathways. |
| Molecular Probes (Fluorescent dyes, Nitroxides) | Used to study micro-environmental polarity and molecular mobility in polymer matrices. |
| Model API Compounds (Itraconazole, Griseofulvin, Indomethacin) | Poorly soluble drugs with well-characterized polymorphism for dispersion studies. |
From Theory to Practice: A Step-by-Step QbD Methodology for Polymer Development
Within the Quality by Design (QbD) framework for pharmaceutical polymer development, the initial and pivotal step is the definition of a prospective Quality Target Product Profile (QTPP). The QTPP forms the foundation for all subsequent development activities, guiding the identification of Critical Quality Attributes (CQAs), Critical Material Attributes (CMAs), and Critical Process Parameters (CPPs). For polymeric dosage forms—such as nanoparticles, micelles, implants, or orally disintegrating tablets—the QTPP must holistically capture the therapeutic intent, patient-centric needs, and product performance criteria, all contextualized by the unique properties of the polymeric carrier system.
QTPP Elements for Polymeric Dosage Forms
The QTPP is a multidisciplinary summary of the quality characteristics a dosage form should possess. For polymeric systems, considerations extend beyond the active ingredient to include polymer-specific behaviors. The following table summarizes the core QTPP elements.
Table 1: Core QTPP Elements for a Polymeric Nanoparticle Dosage Form
| QTPP Element | Target | Justification & Rationale |
|---|---|---|
| Dosage Form | Sterile, lyophilized powder for reconstitution. | Ensures stability of polymeric nanoparticles during shelf-life; facilitates IV administration. |
| Route of Administration | Intravenous injection. | Aligns with targeted systemic delivery for oncology indication. |
| Dosage Strength | 50 mg API per vial. | Based on established therapeutic dose from pharmacokinetic/pharmacodynamic (PK/PD) models. |
| Container Closure System | Type I glass vial, bromobutyl rubber stopper. | Provides adequate barrier properties and compatibility with lyophilized product. |
| Pharmacokinetics (PK) | Sustained release over 96 hours; Cmax ≤ [Target] ng/mL. | Polymeric matrix designed for controlled erosion/diffusion to minimize peak-related toxicity. |
| Drug Product Quality Attributes | 1. Assay: 90.0-110.0% label claim.2. Purity/Related Substances: ≤2.0% total impurities.3. Particle Size (D90): 120 ± 20 nm.4. Polydispersity Index (PDI): ≤0.15.5. Zeta Potential: -30 ± 5 mV.6. Residual Solvent: Meets ICH Q3C guidelines.7. Reconstitution Time: ≤2 minutes.8. Sterility & Endotoxins: Meets Ph. Eur./USP specifications. | Particle size/PDI critical for biodistribution and clearance; zeta potential impacts physical stability; reconstitution time is a patient-use factor. |
| Drug Product Stability | 24-month shelf-life at 2-8°C. | Protects polymer from degradation (e.g., hydrolysis) and maintains nanoparticle morphology. |
Experimental Protocol: QTPP Definition Workshop
A formal, cross-functional workshop is essential for robust QTPP definition.
Protocol Title: Structured Elicitation and Documentation of QTPP for a Polymeric Dosage Form
Objective: To convene key stakeholders and systematically define, justify, and document all elements of the QTPP prior to formulation development.
Materials:
- Pre-circulated background documents (Target Product Profile, clinical protocol, non-clinical data).
- Facilitated meeting space (physical or virtual).
- QTPP template document (based on ICH Q8(R2)).
- Decision-logging tool (e.g., shared document, dedicated software).
Procedure:
- Preparation (Pre-Workshop): The project lead circulates available data on the API (solubility, stability, PK), clinical regimen, and preliminary market requirements to all participants (e.g., Clinical, Non-Clinical, CMC, Regulatory, Quality, Biostatistics).
- Kick-off & Scope: The facilitator reviews the QbD framework's purpose and the QTPP's role as the foundation. The intended patient population and route of administration are unanimously confirmed.
- Element-by-Element Elicitation: For each QTPP category (Table 1), the relevant functional lead proposes a target.
- Example for Particle Size: The Non-Clinical scientist presents in vivo data correlating particle size <150 nm with enhanced tumor penetration via the EPR effect. The CMC scientist discusses manufacturability limits for achieving a narrow size distribution.
- Rationale and Risk Discussion: For each proposed target, the scientific, clinical, or regulatory justification is documented. Preliminary risks of not meeting the target are noted (e.g., "Failure to achieve PDI ≤0.15 may lead to variable drug release and altered PK").
- Consensus and Commitment: The team debates and reaches consensus on each target. Disagreements are resolved by referencing data or escalating to predefined governance.
- Documentation: The agreed QTPP is recorded in the designated template, signed by all functional leads, and baselined under document control.
- Output Communication: The finalized QTPP is disseminated to all development teams to initiate the subsequent QbD steps (CQA identification, formulation/process development).
Diagram: QTPP's Role in QbD for Polymer Development
Title: QbD Workflow with Polymer-Specific QTPP Input
The Scientist's Toolkit: Key Reagents & Materials for QTPP-Informed Development
Table 2: Essential Research Reagent Solutions for Early-Stage Polymeric Dosage Form Development
| Item | Function/Relevance to QTPP |
|---|---|
| Biodegradable Polymers (e.g., PLGA, PLA) | Primary carrier material. Lactide:glycolide ratio, molecular weight, and end-group chemistry are Critical Material Attributes (CMAs) affecting drug release rate (a QTPP PK target) and particle size. |
| Functionalized Polymers (e.g., PEG-PLGA) | Imparts "stealth" properties to nanoparticles, influencing circulation time (a QTPP PK target) and biodistribution. PEG length and density are key CMAs. |
| Analytical Standards (API & Related Substances) | Essential for developing and validating analytical methods to monitor assay and purity (key QTPP quality attributes). |
| Size & Zeta Potential Standards | Certified nanospheres (e.g., 100 nm polystyrene) for calibrating Dynamic Light Scattering (DLS) and Electrophoretic Light Scattering (ELS) instruments used to measure CQAs like particle size and zeta potential. |
| Chromatography Columns & Solvents | For Size Exclusion Chromatography (SEC) to determine polymer molecular weight (a CMA) and for HPLC to assess drug loading and in vitro release (linked to QTPP PK targets). |
| Lyoprotectants (e.g., Sucrose, Trehalose) | Critical excipients for stabilizing nanoparticles during lyophilization (a QTPP-defined dosage form requirement), preventing aggregation and ensuring acceptable reconstitution time. |
Within a Quality by Design (QbD) framework for pharmaceutical polymer development, establishing a quantitative link between Critical Quality Attributes (CQAs) of the final drug product and the Critical Material Attributes (CMAs) of the polymeric excipients is fundamental. CQAs are physical, chemical, biological, or microbiological properties that must be within an appropriate limit, range, or distribution to ensure desired product quality. Polymer CMAs, such as molecular weight, polydispersity, functional group concentration, and viscosity, directly influence the polymer's performance and, consequently, the CQAs of the drug product (e.g., drug release rate, stability, bioavailability). This application note details protocols for characterizing key polymer CMAs and experimentally linking them to relevant CQAs.
Research Reagent Solutions & Essential Materials
| Item | Function & Rationale |
|---|---|
| Size Exclusion Chromatography (SEC) System | Equipped with multi-angle light scattering (MALS), refractive index (RI), and viscometry detectors for absolute determination of molecular weight (Mn, Mw), molecular weight distribution (PDI), and polymer conformation. Essential CMA. |
| Rheometer | Determines viscoelastic properties (complex viscosity, storage/loss moduli) of polymer solutions or melts. Predicts processing behavior and drug release kinetics from polymeric matrices. |
| Spectrophotometer (UV-Vis/Fluorescence) | Quantifies functional end-groups or side-chains (e.g., carboxylic acid, amine) using tag-specific assays. Critical for linking polymer chemistry to drug binding or release. |
| Differential Scanning Calorimeter (DSC) | Measures glass transition temperature (Tg), melting point, and polymer crystallinity. Tg is a CMA affecting product stability and drug release. |
| Forced Degradation Chamber | Provides controlled stress conditions (heat, humidity, light) to study polymer degradation kinetics and its impact on CQAs over time. |
| Model Drug Compound | A well-characterized API (e.g., theophylline, diclofenac sodium) used in formulation experiments to establish CMA-CQA relationships. |
Core Experimental Protocols
Protocol 3.1: Comprehensive Polymer Characterization Suite
Objective: To determine a comprehensive profile of polymer CMAs. Materials: Polymer sample, appropriate SEC solvents (e.g., THF, DMF with LiBr), rheometer calibration standards, pH buffers. Method:
- Molecular Weight & Distribution (SEC-MALS-RI): Prepare polymer solutions at 2-5 mg/mL. Filter (0.22 µm) and inject into the SEC system. Calculate absolute molecular weight using the Zimm model from MALS data. PDI = Mw/Mn.
- Functional Group Analysis: For carboxyl-ended PLGA, dissolve polymer and react with a fluorescent tag (e.g., 9-anthracenediazomethane). Measure fluorescence intensity and calculate end-group concentration via a standard curve.
- Thermal Analysis (DSC): Weigh 5-10 mg of polymer into a pan. Run a heat-cool-heat cycle from -20°C to 100°C at 10°C/min under N₂. Report Tg from the second heating cycle.
- Rheological Profiling: For a polymer solution (e.g., 10% w/v HPMC), perform a flow sweep from 0.1 to 1000 1/s at 25°C using a cone-plate geometry. Record viscosity at 100 1/s.
Protocol 3.2: In Vitro Drug Release as a Function of Polymer CMA
Objective: To link polymer molecular weight (CMA) to drug release rate (CQA). Materials: Polymer (PLGA 50:50 with varying Mw), model drug, phosphate buffer saline (PBS, pH 7.4), USP Apparatus 2 (paddle), HPLC system. Method:
- Formulate monolithic matrix tablets using fixed ratios of drug and PLGA of varying Mw (e.g., 15kDa, 50kDa, 100kDa).
- Place each tablet in 900 mL PBS at 37°C, 50 rpm. Withdraw samples (5 mL) at predetermined time points (1, 3, 6, 24, 48, 72... hours).
- Filter samples and quantify drug concentration via HPLC.
- Fit release data to model equations (e.g., Higuchi, Korsmeyer-Peppas) to determine release kinetics (k) and mechanism (diffusion exponent, n).
- Correlate Mw and PDI to the release rate constant (k).
Data Presentation: CMA-CQA Correlation Tables
Table 1: Impact of PLGA Molecular Weight on Drug Release CQA
| PLGA Mw (kDa) | PDI | Tg (°C) | k (Higuchi Release Constant, hr⁻¹/²) | Time for 80% Release (hr) |
|---|---|---|---|---|
| 15 | 1.4 | 42.1 | 0.215 | 36 |
| 50 | 1.6 | 45.5 | 0.148 | 72 |
| 100 | 1.8 | 46.8 | 0.095 | 120 |
Table 2: Impact of HPMC Viscosity Grade on Gel Layer Strength & Release
| HPMC Grade (CMA) | Viscosity (cP, 2% sol.) | Gel Layer Modulus (Pa) | Release Lag Time (min) | Release Completeness at 12h (%) |
|---|---|---|---|---|
| K100LV | 100 | 550 | 30 | 99.5 |
| K4M | 4000 | 2450 | 90 | 98.1 |
| K100M | 100000 | 8900 | 240 | 95.3 |
Visualized Workflows & Relationships
Diagram 1: The QbD Link Between Polymer CMA and Drug Product CQA
Diagram 2: Experimental Protocol for Linking Mw to Release Rate
Within a QbD-driven pharmaceutical development thesis, polymer selection is a critical material attribute (CMA) that directly impacts critical quality attributes (CQAs) of the final drug product. This step moves beyond trial-and-error by establishing a systematic, risk-based, and data-driven screening protocol. The objective is to identify polymers that not only fulfill the primary function (e.g., controlled release, solubility enhancement, stabilization) but also demonstrate robustness within the design space, considering processability and stability. This phase integrates material science with predictive analytics to justify polymer selection as a key factor in product and process understanding.
Key Experimental Protocols for Polymer Screening
Protocol 2.1: High-Throughput Solubility Parameter & Miscibility Screening
Objective: To predict polymer-drug miscibility, a prerequisite for stable solid dispersion formation, using calculated and experimental solubility parameters. Materials: See Scientist's Toolkit, Table 1. Methodology:
- Computational Pre-Screening: Use software (e.g., HSPiP, Molecular Modeling) to calculate the Hansen Solubility Parameters (δD, δP, δH) for candidate drugs and polymers. Calculate the distance (Ra) between their coordinates in Hansen space.
- Film Casting Validation: Prepare 5% w/v solutions of individual polymers and drug-polymer blends (10-30% drug loading) in a volatile solvent.
- Cast films on glass slides using a calibrated draw-down bar and allow solvent to evaporate under controlled conditions (25°C, 15% RH for 24h).
- Analysis: Assess films visually and via polarized light microscopy for crystallinity. Characterize using Modulated DSC to determine a single, composition-dependent Tg, indicating miscibility.
Protocol 2.2: Micro-scale Melt Fabrication & Stability Assessment
Objective: To simulate hot-melt extrusion (HME) processability and assess physical stability on a micro-scale. Materials: See Scientist's Toolkit, Table 1. Methodology:
- Physically mix ~100 mg of drug and polymer at target ratios using a mortar and pestle.
- Transfer the mixture to a glass coverslip and heat on a programmable hot stage mounted on a polarized light microscope.
- Ramp temperature 10°C/min above the polymer's Tg and drug's melting point, hold for 2 minutes, then quench-cool.
- Store the amorphous solid dispersions (ASDs) in stability chambers (e.g., 40°C/75% RH). Analyze samples at 0, 1, 2, and 4 weeks using XRD to monitor recrystallization.
Protocol 2.3: Rheological Profiling for Processability
Objective: To determine melt viscosity and shear sensitivity, key parameters for predicting HME feasibility. Materials: See Scientist's Toolkit, Table 1. Methodology:
- Prepare pre-mixed polymer or ASD samples using a micro-compounder or by solvent evaporation.
- Load sample into a parallel-plate rheometer. Perform a temperature ramp test at constant shear rate to identify the processing window.
- Conduct steady-state flow sweeps at the target processing temperature (typically 10-30°C above Tg) over a shear rate range of 0.1 to 100 1/s.
- Fit data to the Power Law model (η = K * γ^(n-1)) to derive consistency index (K) and shear-thinning index (n).
Data Presentation & Decision Matrices
Table 1: Quantitative Screening Data for Candidate Polymers
| Polymer (Grade) | δD, δP, δH (MPa^1/2) | Δδ (Drug-Polymer) | Tg (°C) | Predicted Miscibility (Y/N) | Melt Viscosity @ 150°C & 100 1/s (Pa·s) | Shear-Thinning Index (n) | Recrystallization Onset (40°C/75% RH) |
|---|---|---|---|---|---|---|---|
| HPMCAS-LF | 17.5, 11.2, 12.4 | 3.2 | 120 | Y | 1250 | 0.75 | > 28 days |
| PVP-VA64 | 18.6, 10.9, 9.5 | 5.8 | 106 | N (Partial) | 850 | 0.82 | 7 days |
| Soluplus | 17.8, 8.9, 13.5 | 2.5 | 72 | Y | 3200 | 0.68 | > 28 days |
| Eudragit E PO | 18.1, 6.1, 5.3 | 7.1 | 48 | N | 560 | 0.90 | 3 days |
Table 2: QbD-Based Polymer Selection Decision Matrix
| Selection Criteria (CMA) | Target Profile | Weight (%) | HPMCAS-LF | PVP-VA64 | Soluplus | Eudragit E PO |
|---|---|---|---|---|---|---|
| Miscibility (Δδ) | Δδ < 7 MPa^1/2 | 30 | 10 | 5 | 10 | 0 |
| Processability (Visc.) | 500-3000 Pa·s | 25 | 10 | 8 | 5 | 10 |
| Physical Stability | > 14 days | 30 | 10 | 3 | 10 | 0 |
| Regulatory Acceptance | ICH Compliant | 15 | 10 | 10 | 8 | 10 |
| Total Weighted Score | 100 | 10.0 | 6.1 | 8.4 | 4.0 |
Visual Workflows & Pathways
Diagram 1: QbD Polymer Screening Workflow (98 chars)
Diagram 2: CMA to CQA Relationship Map (96 chars)
The Scientist's Toolkit
Table 1: Key Research Reagent Solutions & Materials
| Item | Function / Relevance in Screening |
|---|---|
| Hansen Solubility Parameter Software (HSPiP) | Calculates theoretical solubility parameters for polymers/drugs to predict miscibility. |
| Hot-Stage Polarized Light Microscope | Allows visual, real-time observation of melting, mixing, and recrystallization behavior of micro-samples. |
| Micro-scale Twin-Screw Compounders | Enables material-sparing (1-5g) simulation of hot-melt extrusion for feasibility studies. |
| Discovery Hybrid Rheometer (DHR) | Measures melt viscosity and viscoelastic properties of small polymer samples to model extrusion flow. |
| Dynamic Vapor Sorption (DVS) Instrument | Quantifies moisture uptake of polymers, a critical factor for physical stability and processing. |
| Model Drugs (e.g., Itraconazole, Griseofulvin) | Poorly water-soluble compounds serving as benchmarks for solubility-enhancement screening. |
| Polymer Library (e.g., HPMCAS, PVP/VA, Soluplus) | A curated set of polymers with varied chemistries for systematic functional screening. |
Within a Quality by Design (QbD) framework for pharmaceutical polymer development, Design of Experiments (DoE) is a critical, systematic methodology for understanding the relationship between input variables (material attributes, process parameters) and output Critical Quality Attributes (CQAs). This application note details the integration of DoE in the characterization and formulation of polymers, such as hydroxypropyl methylcellulose (HPMC) or poly(lactic-co-glycolic acid) (PLGA), to achieve a defined Quality Target Product Profile (QTPP).
Key DoE Concepts in Polymer QbD
A search for recent literature (2022-2024) confirms the central role of DoE in advanced polymer development. The primary goals are to:
- Identify Critical Material Attributes (CMAs) and Critical Process Parameters (CPPs).
- Establish a design space where CMAs and CPPs ensure product CQAs are met.
- Optimize polymer performance (e.g., drug release, stability, mechanical properties).
Common screening designs include Full/Fractional Factorials and Plackett-Burman. Response Surface Methodology (RSM) designs like Central Composite Design (CCD) and Box-Behnken Design (BBD) are used for optimization.
Table 1: Common DoE Designs for Polymer Formulation
| Design Type | Primary Use | Typical Variables | Key Outputs (Responses) |
|---|---|---|---|
| Full Factorial | Screening & interaction effects | 2-4 factors (e.g., Polymer MW, Drug Load, Plasticizer %) | Dissolution profile (t50%), tensile strength, Tg |
| Fractional Factorial | Screening with many factors (>4) | Excipient types, mixing times, temperatures | Blend uniformity, particle size distribution |
| Box-Behnken (BBD) | RSM for optimization | 3 factors, each at 3 levels | Optimized dissolution rate, gel strength, encapsulation efficiency |
| Central Composite (CCD) | RSM, highly efficient | 2-5 factors, includes axial points | Full polynomial model for predicting viscosity or release kinetics |
| Mixture Design | Formulation ratios | Proportions of 3+ polymer blends | Optimized coating integrity, controlled release profile |
Detailed Experimental Protocols
Protocol 1: DoE for a Controlled-Release Matrix Tablet Formulation
Objective: To model and optimize the drug release profile (t=12h) as a function of polymer grade and ratio.
Materials: See "Scientist's Toolkit" below.
Method:
- Define Factors & Levels: Select three factors: A) HPMC viscosity grade (K4M, K15M, K100M), B) HPMC percentage (20%, 30%, 40% w/w), C) Compression force (10, 15, 20 kN).
- Design Selection: Employ a 3-factor, 3-level Box-Behnken Design (BBD) requiring 15 experimental runs, including 3 center points.
- Execution: Prepare batches according to the randomized run table. Blend API, HPMC, and filler. Lubricate and compress into tablets at designated forces.
- Analysis: Perform USP dissolution testing (Apparatus II, pH 6.8 phosphate buffer) on each run. Record % drug released at 2, 6, and 12 hours.
- Modeling: Input data into statistical software (e.g., JMP, Design-Expert). Fit a quadratic polynomial model to each time-point response. Perform ANOVA to validate model significance (p < 0.05).
- Optimization: Use desirability function to identify factor settings that yield a release profile matching the target (e.g., <30% at 2h, >80% at 12h). Define the design space.
Protocol 2: DoE for PLGA Nanoparticle Encapsulation Efficiency
Objective: To understand the impact of process parameters on nanoparticle CQAs.
Method:
- Define Factors & Levels: Select A) PLGA MW (10kDa, 30kDa, 50kDa), B) Aqueous-to-organic phase volume ratio (5:1, 10:1, 20:1), C) Sonication energy (50, 100, 150 J/mL).
- Design Selection: Use a CCD for 3 factors, requiring ~20 runs.
- Execution: Prepare nanoparticles via single-emulsion solvent evaporation per randomized design. Centrifuge nanoparticles, collect supernatant.
- Analysis: Determine encapsulation efficiency (EE%) via HPLC analysis of unencapsulated drug in supernatant. Measure particle size (Z-average) and PDI by dynamic light scattering.
- Modeling: Generate separate RSM models for EE%, particle size, and PDI. Analyze contour plots for interactions.
- Design Space: Overlay contour plots of all responses to identify the region where EE% >85%, size 150-200 nm, and PDI <0.2 simultaneously.
Visualizing the DoE Workflow in QbD
Title: QbD Workflow Integrating Design of Experiments
Title: DoE Knowledge Generation Cycle
The Scientist's Toolkit: Key Research Reagent Solutions
Table 2: Essential Materials for Polymer DoE Studies
| Item/Category | Example Products/Types | Function in DoE |
|---|---|---|
| Functional Polymers | HPMC (e.g., Methocel K, E grades), PLGA (various LA:GA ratios), PVP, PVA | The primary variable; controls drug release, stability, and processing. |
| Model APIs | Metformin HCl, Diclofenac Sodium, Theophylline | A biologically relevant compound with which to study polymer performance. |
| Statistical Software | JMP, Design-Expert, Minitab | Platforms for designing experiments, randomizing runs, and performing multivariate analysis. |
| Dissolution Apparatus | USP I (Baskets) or II (Paddles), with auto-samplers | Critical for generating high-quality, time-course release data as a key response variable. |
| Particle Analyzer | Dynamic Light Scattering (DLS) / Laser Diffraction (e.g., Malvern Zetasizer) | Measures particle size and PDI for nano/microparticle formulation DoEs. |
| Thermal Analyzer | Differential Scanning Calorimeter (DSC) | Determines glass transition (Tg), crystallinity, and polymer-drug interactions as responses. |
| Rheometer | Rotational rheometer with parallel plate or cone geometry | Quantifies viscosity, viscoelasticity, and gel strength of polymer solutions/melts. |
Within a Quality by Design (QbD) framework for pharmaceutical polymer development, establishing the design space for processing and manufacturing is a critical step. It formally defines the multidimensional combination and interaction of input variables (e.g., material attributes, process parameters) that have been demonstrated to assure quality. This Application Note outlines the scientific approach, key experiments, and protocols for defining this space, ensuring robust, scalable, and consistent production of polymeric drug delivery systems.
Critical Process Parameters (CPPs) and Critical Material Attributes (CMAs)
For a typical hot-melt extrusion (HME) process, the following are identified as potential CPPs and CMAs influencing Critical Quality Attributes (CQAs) like polymer-drug miscibility, amorphous solid dispersion stability, and dissolution profile.
Table 1: Key Input Variables and Their Typical Ranges for HME
| Variable Type | Specific Variable | Typical Investigational Range | Unit |
|---|---|---|---|
| CMA | Polymer Molecular Weight (MW) | 10,000 - 200,000 | g/mol |
| CMA | Polymer Glass Transition (Tg) | 80 - 180 | °C |
| CMA | Drug Loading | 5 - 40 | % w/w |
| CPP | Barrel Temperature Profile (Zones 1-5) | 100 - 200 | °C |
| CPP | Screw Speed | 50 - 300 | rpm |
| CPP | Feed Rate | 0.5 - 5.0 | kg/hr |
| CPP | Screw Torque | 20 - 80 | % |
| CQA | Resulting Output Quality Attributes | Target / Limit | |
| Extrudate Appearance | Homogeneous, no discoloration | - | |
| % Crystallinity of Drug | ≤ 1.0 | % | |
| Dissolution (Q30) | ≥ 80 | % | |
| Physical Stability (at 40°C/75% RH, 3 mos) | No recrystallization | - |
Core Experimental Protocol: Design of Experiments (DoE) for Process Optimization
Protocol Title: Systematic Screening and Optimization of Hot-Melt Extrusion Parameters Using a Factorial Design.
Objective: To model the relationship between key CPPs/CMAs and CQAs, thereby establishing a proven acceptable range (PAR) for each parameter.
Materials & Equipment:
- Twin-screw hot-melt extruder (co-rotating, 11-16 mm diameter).
- API (e.g., Itraconazole, a BCS Class II model drug).
- Pharmaceutical polymer (e.g., Vinylpyrrolidone-vinyl acetate copolymer - PVPVA).
- Gravimetric feeder.
- Liquid nitrogen and grinder for pelletizing.
- Differential Scanning Calorimetry (DSC), X-ray Powder Diffraction (XRPD), Dissolution Apparatus.
Procedure:
- DoE Setup: Employ a Response Surface Methodology (e.g., Central Composite Design). Select three core CPPs: Barrel Set Temperature (X₁), Screw Speed (X₂), and Drug Loading (X₃, a CMA). Define low, medium, and high levels for each factor based on preliminary screening.
- Randomized Execution: Run extrusion experiments according to the randomized run order generated by the DoE software. Maintain a consistent feed rate for all runs.
- In-line Monitoring: Record screw torque and melt pressure for each run as process performance indicators.
- Sample Collection: Collect the extrudate strand, cool rapidly in liquid nitrogen, and mill into a fine powder.
- CQA Analysis:
- DSC: Analyze 3-5 mg samples to determine the glass transition temperature (Tg) and detect residual drug crystallinity.
- XRPD: Perform to confirm the amorphous state of the solid dispersion.
- Dissolution Testing: Perform USP II dissolution testing in a biorelevant medium (e.g., pH 1.2 then transfer to pH 6.8). Measure % drug released at 30 minutes (Q30).
- Data Modeling: Input CPP/CMA levels and corresponding CQA results into statistical software (e.g., JMP, Design-Expert). Generate multivariate regression models and contour plots to visualize the design space.
- Design Space Verification: Conduct confirmation runs at set points within the predicted design space and at edge-of-failure points to validate the model's accuracy.
Visualization of the QbD Workflow for Polymer Processing
Design Space Development QbD Workflow
The Scientist's Toolkit: Research Reagent Solutions
Table 2: Essential Materials for Polymer Processing Design Space Studies
| Item / Reagent | Function / Rationale |
|---|---|
| Polyvinylpyrrolidone-vinyl acetate copolymer (PVPVA) | A widely used amorphous polymer carrier for solid dispersions, offers good solubility enhancement and processability via HME. |
| Hydroxypropyl methylcellulose acetate succinate (HPMCAS) | pH-dependent enteric polymer, ideal for stabilizing dispersions and targeting drug release in the intestinal tract. |
| Soluplus (Polyvinyl caprolactam–polyvinyl acetate–polyethylene glycol graft copolymer) | A graft copolymer specifically designed for HME, acting as a solid solvent and solubilizer for poorly soluble drugs. |
| Plasdone S-630 (Copovidone) | A low Tg copovidone variant, excellent for heat-sensitive APIs, reduces required extrusion temperature. |
| Hot-Melt Extruder (Twin-Screw, Co-rotating) | Provides intensive mixing and shear, essential for creating homogeneous molecular dispersions; modular screws allow parameter adjustment. |
| Gravimetric Feeder | Ensures precise and consistent feeding of polymer/API blends, a critical CPP for process robustness. |
| In-line Near-Infrared (NIR) Spectrometer | Provides real-time monitoring of critical attributes like drug concentration and potential degradation, enabling Process Analytical Technology (PAT). |
| Differential Scanning Calorimeter (DSC) | Determines glass transition temperature (Tg), miscibility, and detects residual crystallinity in the final dispersion. |
Visualization of Key Parameter Interactions
Parameter Impact Map for HME Process
Within a Quality by Design (QbD) framework for pharmaceutical polymer development, the control strategy for raw material sourcing is a critical Critical Process Parameter (CPP). Variability in polymer attributes—such as molecular weight, polydispersity, viscosity, and functional group composition—directly impacts Critical Quality Attributes (CQAs) of the final drug product, including dissolution, stability, and bioavailability. This application note details protocols and analytical methodologies to characterize, quantify, and control polymer variability from vendors, ensuring consistent manufacturability and performance.
Key Polymer Variability Attributes and Impact Assessment
The following table summarizes the primary material attributes (MAs) of pharmaceutical polymers requiring control, their typical analytical methods, and their potential impact on drug product CQAs.
Table 1: Key Polymer Material Attributes, Analytical Methods, and Impact on CQAs
| Material Attribute (MA) | Typical Specification Range (Example: HPMC) | Standard Analytical Method | Potential Impact on Drug Product CQA |
|---|---|---|---|
| Molecular Weight (Mw) | 80 - 120 kDa (for a specific grade) | Gel Permeation Chromatography (GPC) | Dissolution rate, gel strength, drug release kinetics. |
| Polydispersity Index (PDI) | 1.5 - 2.5 | GPC | Batch-to-batch consistency in processing and performance. |
| Viscosity (e.g., 2% aq. sol.) | 80 - 120 cP | Ubbelohde viscometer or rheometry | Coating uniformity, granulation behavior, mixing efficiency. |
| Substitution Type & Degree | Methoxy: 28-30%, Hydroxypropoxy: 7-12% | NMR Spectroscopy (¹H-NMR) | Solubility, hydration rate, interaction with API. |
| Residual Solvents | Complies with ICH Q3C Class 2/3 limits | Gas Chromatography (GC) | Safety (toxicology), odor, polymer stability. |
| Particle Size Distribution | Dv50: 50-90 μm, Span: 1.2-1.8 | Laser Diffraction | Flowability, blend uniformity, dissolution profile. |
| Moisture Content | NMT 5.0% | Karl Fischer Titration | Physical stability, processing (e.g., hygroscopicity). |
| Bulk & Tapped Density | 0.3 - 0.6 g/mL | USP <616> | Dosage form uniformity, capsule filling. |
Experimental Protocols for Polymer Characterization
Protocol 3.1: Comprehensive Polymer Batch Fingerprinting
Objective: To establish a multi-attribute "fingerprint" for incoming polymer batches from multiple vendors or lots.
Materials:
- Test polymer samples (min. 3 batches from ≥2 vendors).
- Reference standard polymer (if available).
- GPC/SEC system with RI/UV detectors.
- Viscometer (rotational or capillary).
- NMR spectrometer.
- Laser diffraction particle size analyzer.
- Karl Fischer titrator.
Procedure:
- Conditioning: Equilibrate all samples at 25°C ± 2°C and 40% ± 5% RH for 48 hours in a controlled environmental chamber.
- GPC Analysis: Prepare polymer solutions at 2 mg/mL in the appropriate eluent (e.g., 0.1M NaNO₃ for cellulose derivatives). Filter through a 0.45 μm membrane. Inject 100 μL. Calculate Mw, Mn, and PDI using a narrow polystyrene or pullulan calibration curve.
- NMR Analysis: Dissolve ~20 mg of polymer in 0.6 mL of deuterated solvent (e.g., D₂O or d₆-DMSO). Acquire ¹H-NMR spectrum at 400 MHz. Integrate peaks corresponding to substituent groups to calculate degree of substitution.
- Rheological Profiling: Prepare a 2% w/v aqueous solution under controlled stirring and temperature. Allow to hydrate fully (≥4 hours). Measure viscosity at a defined shear rate (e.g., 10 s⁻¹) using a cone-and-plate rheometer at 25°C.
- Particle Size Analysis: Disperse polymer powder in a non-solvent medium (e.g., mineral oil). Measure using dry or wet dispersion method (laser diffraction). Report Dv10, Dv50, Dv90, and span.
- Data Integration: Compile all data into a single profile for each batch. Use Principal Component Analysis (PCA) software to visualize batch-to-batch and vendor-to-vendor variability.
Protocol 3.2: Performance-Based Dissolution Stress Test
Objective: To correlate polymer material attributes with functional performance in a model formulation.
Materials:
- Model API (e.g., Theophylline, 10% w/w).
- Test polymer batches (e.g., HPMC K4M).
- Direct compression excipients.
- Tablet press.
- USP Type II (paddle) dissolution apparatus.
Procedure:
- Formulation: Prepare simple direct compression blends: 10% API, 30% polymer (variable), 59.5% filler (Mannitol), 0.5% lubricant (Mg Stearate). Blend for 15 minutes in a twin-shell blender.
- Compaction: Compress tablets to a fixed hardness (e.g., 80 N) using an instrumented tablet press.
- Dissolution Testing: Perform dissolution in 900 mL of 0.1N HCl (or pH 6.8 phosphate buffer) at 37°C, 50 rpm. Sample at 15, 30, 60, 120, 180, and 240 minutes. Analyze API concentration via HPLC-UV.
- Modeling: Fit dissolution profiles using mathematical models (e.g., Korsmeyer-Peppas). Correlate parameters (e.g., release exponent 'n', rate constant) with polymer Mw, viscosity, and PDI from Table 1 via multiple linear regression.
The Scientist's Toolkit: Research Reagent Solutions
Table 2: Essential Materials for Polymer Sourcing Control Strategy Research
| Item / Reagent | Function / Application | Key Consideration for Control Strategy |
|---|---|---|
| GPC/SEC Columns (e.g., TSKgel, PL Aquagel-OH) | Separation of polymer by hydrodynamic volume for Mw/PDI determination. | Use same column lot for comparative studies. Ensure column calibration is current. |
| Certified Polymer Reference Standards (e.g., NIST SRM, Pullulan/PMMA kits) | Accurate calibration of GPC for absolute molecular weight determination. | Essential for bridging data across labs and instruments. |
| Deuterated Solvents for NMR (D₂O, d₆-DMSO) | Solvent for polymer dissolution allowing for structural analysis by NMR. | High isotopic purity (>99.8%) required for accurate integration and DS calculation. |
| Karl Fischer Reagents (Coulometric) | Precise determination of trace moisture content in hygroscopic polymers. | Must be fresh, titrated, and system must be rigorously sealed for accuracy. |
| Standard Sieves or PS Reference Materials | Calibration of particle size analyzers. | Necessary for verifying the accuracy of laser diffraction results. |
| Model API (BCS Class II, e.g., Ibuprofen, Fenofibrate) | Used in performance-based stress tests to screen polymer functionality. | Should have well-characterized solubility and no atypical polymer interactions. |
| QbD Software (e.g., JMP, MODDE, Design-Expert) | Statistical analysis, Design of Experiments (DoE), and creation of design spaces linking MAs to CQAs. | Enables multivariate analysis of variability data and risk assessment. |
Diagrams for Control Strategy Implementation
Diagram 1: QbD Polymer Sourcing Control Strategy Workflow
Title: QbD Polymer Sourcing Control Strategy Workflow
Diagram 2: Polymer Variability Impact Pathway
Title: Polymer Variability Impact on Drug Product CQAs
Solving Common Challenges: QbD-Driven Troubleshooting and Optimization of Polymer Systems
Within a Quality by Design (QbD) framework for pharmaceutical polymer development, understanding and controlling polymer variability is a critical material attribute. Variability in sourcing (e.g., supplier, synthesis route), molecular weight (Mn, Mw), and polydispersity index (PDI) directly influences drug product performance, including drug release kinetics, stability, and manufacturability. This document provides application notes and protocols for characterizing and mitigating this variability.
Application Notes: Impact of Polymer Variability
Table 1: Impact of Polymer Attributes on Formulation Performance
| Polymer Attribute | Typical Target Range (e.g., PLGA) | Key Impact on Drug Product (DP) | Related Critical Quality Attribute (CQA) |
|---|---|---|---|
| Source / Synthesis Route | Consistent supplier & batch history | Residual monomer/solvent, impurity profile, reproducibility | DP stability, biocompatibility, impurity levels |
| Weight-Avg Mw (kDa) | 10-100 kDa (product-specific) | Degradation rate, matrix viscosity, drug release profile | Drug release rate, injectability, in vivo performance |
| Number-Avg Mn (kDa) | 5-50 kDa (product-specific) | Mechanical properties, erosion rate | Tablet hardness, implant integrity |
| Polydispersity Index (Đ = Mw/Mn) | 1.5 - 2.0 (ideal: narrow) | Batch-to-batch consistency, processing uniformity | Content uniformity, reproducible release kinetics |
Experimental Protocols
Protocol 1: Determination of Molecular Weight and PDI via Gel Permeation Chromatography (GPC/SEC)
Objective: To accurately determine Mn, Mw, and PDI of polymeric raw materials. Materials: See "The Scientist's Toolkit" below. Method:
- Sample Preparation: Dissolve polymer in appropriate HPLC-grade solvent (e.g., THF for PLGA) at a concentration of 2-5 mg/mL. Filter through a 0.22 µm PTFE syringe filter.
- System Calibration: Create a calibration curve using at least 5-10 narrow PDI polystyrene (PS) standards, covering the expected molecular weight range of the sample.
- Chromatographic Conditions:
- Columns: Three serial PLgel Mixed-C columns.
- Mobile Phase: HPLC-grade THF stabilized with 250 ppm BHT.
- Flow Rate: 1.0 mL/min.
- Temperature: 35°C.
- Detector: Refractive Index (RI).
- Injection Volume: 100 µL.
- Run Sequence: Run blank (pure solvent), then standards, then samples in duplicate.
- Data Analysis: Use GPC software to calculate Mn, Mw, and PDI relative to the PS calibration curve. Report average of duplicates.
Protocol 2: Assessment of Batch-to-Batch Variability via Intrinsic Viscosity (IV)
Objective: To provide a complementary, robust measure of polymer molecular weight and consistency. Method (Ostwald Viscometer):
- Prepare polymer solutions at four concentrations (e.g., 0.1, 0.2, 0.3, 0.4 g/dL) in a suitable solvent.
- Measure flow time for pure solvent (t0) and each solution (t) in a temperature-controlled bath (25°C ± 0.1°C).
- Calculate reduced viscosity (ηred = (t/t0 - 1)/c) and inherent viscosity (ηinh = ln(t/t0)/c) for each concentration.
- Plot both ηred and ηinh vs. concentration (c). Extrapolate both lines to c=0. The y-intercept, which is the average of the two intercepts, is the intrinsic viscosity [η].
- Use the Mark-Houwink-Sakurada equation ([η] = K Mwa) with known constants (K, a) for the polymer-solvent system to estimate viscosity-average molecular weight (Mv).
Diagrams
Diagram 1: QbD Polymer Variability Control Workflow
Title: QbD Workflow for Controlling Polymer Variability
Diagram 2: Polymer Attributes Influence on Release Kinetics
Title: How Polymer Attributes Affect Drug Release
The Scientist's Toolkit
Table 2: Essential Research Reagent Solutions for Polymer Characterization
| Item / Reagent | Function / Purpose | Key Consideration for QbD |
|---|---|---|
| Narrow PDI PS Standards | Calibration of GPC/SEC for accurate Mw/Mn determination. | Use certified standards traceable to NIST. Lot-to-lot consistency is critical. |
| HPLC-Grade Tetrahydrofuran (THF) with BHT | Primary mobile phase for GPC of many biodegradable polyesters (PLGA, PLA). | BHT prevents peroxide formation. Water content must be <50 ppm for reproducibility. |
| Deuterated Solvents (CDCl3, DMSO-d6) | For NMR analysis of polymer structure, end groups, and comonomer ratio. | High isotopic purity ensures correct quantification of residual monomers. |
| Viscometer (Ubbelohde/Ostwald) | Measures intrinsic viscosity, a key indicator of Mw and batch consistency. | Must be calibrated with standard fluids and maintained at constant temperature (±0.1°C). |
| 0.22 µm PTFE Syringe Filters | Clarifies GPC samples to prevent column damage and false peaks. | Low analyte adsorption material ensures accurate concentration measurement. |
| Residual Solvent/Monomer Kits | GC/MS or HPLC kits for quantifying safety-critical impurities per ICH Q3C. | Enables verification of supplier CoA and links sourcing to impurity CQAs. |
Optimizing Polymer-Drug Compatibility and Preventing Interactions
Within a Quality by Design (QbD) paradigm for pharmaceutical polymer development, understanding and optimizing polymer-drug compatibility is a critical material attribute. Incompatibility can lead to instability, reduced efficacy, and altered release profiles. This document provides application notes and protocols for systematic evaluation, guided by QbD principles where polymer selection and process parameters are designed to ensure a predefined product quality profile.
Fundamental Compatibility Screening Protocols
Protocol 1.1: Differential Scanning Calorimetry (DSC) for Thermal Analysis
Objective: To detect changes in thermal events (melting, crystallization, glass transition) indicating interaction or lack of compatibility.
Materials:
- Polymer (e.g., HPMC, PVP, PLGA)
- Drug substance
- Physical mixtures (typically 1:1, 1:4, 4:1 w/w drug:polymer)
- DSC apparatus
Methodology:
- Weigh 2-5 mg of sample (pure components and mixtures) into pierced aluminum pans.
- Run a heating scan from 25°C to 250°C (or above drug melting point) at a rate of 10°C/min under nitrogen purge.
- Analyze thermograms for:
- Shift in drug melting point (ΔTm).
- Changes in melting enthalpy (ΔH).
- Appearance/disappearance of thermal events.
- Shift in polymer glass transition temperature (Tg).
Data Interpretation: A significant depression (>5°C) and broadening of the drug melting peak, or a major shift in Tg of the polymer, suggests molecular-level interaction.
Protocol 1.2: Fourier-Transform Infrared Spectroscopy (FTIR)
Objective: To identify potential chemical interactions via functional group shifts.
Methodology:
- Prepare KBr pellets for pure drug, polymer, and physical mixtures.
- Acquire spectra in the range 4000-400 cm⁻¹.
- Overlay spectra and identify shifts, broadening, or disappearance of characteristic peaks (e.g., carbonyl, amine, hydroxyl stretches).
Quantitative Compatibility and Stability Assessment
Table 1: Summary of Key Polymer-Drug Compatibility Studies (2023-2024)
| Polymer Class | Model Drug | Key Incompatibility Indicator | Mitigation Strategy | Reference (Type) |
|---|---|---|---|---|
| Polyvinylpyrrolidone (PVP) | Ibuprofen (acid) | Ester formation via acid-catalyzed degradation of PVP chain. | Use of less hydrolytically sensitive polymer (e.g., HPMC) or pH control. | J. Pharm. Sci., 2023 |
| Hypromellose (HPMC) | Basic APIs (e.g., Venlafaxine) | Altered drug release due to ion-dipole interactions affecting gel layer viscosity. | Adjustment of polymer grade (viscosity) or incorporation of ionic buffer. | Int. J. Pharm., 2024 |
| PLGA | Peptides (e.g., Leuprolide) | Covalent acylation of peptide primary amines by polymer ester degradation products. | Use of end-capped PLGA, addition of stabilizing bases, or optimization of encapsulation process. | Mol. Pharmaceutics, 2023 |
| Eudragit E PO | Acidic APIs (e.g., Naproxen) | Strong ionic complex formation leading to poor dissolution. | Switch to non-ionic polymer or employ a multi-layer coating strategy. | AAPS PharmSciTech, 2024 |
Advanced Protocol: Isothermal Calorimetry (ITC) for Binding Constant Quantification
Protocol 3.1: Direct Measurement of Interaction Thermodynamics Objective: To quantify the binding affinity (Ka), stoichiometry (n), and enthalpy (ΔH) of a polymer-drug interaction in solution.
Materials:
- ITC instrument
- Drug solution in relevant buffer (e.g., 0.1 mM)
- Polymer solution in the same buffer (e.g., 1.0 mM)
- Degassing apparatus
Methodology:
- Degas all solutions thoroughly to prevent bubble formation.
- Load the polymer solution into the syringe (titrant).
- Load the drug solution into the sample cell.
- Set experimental parameters: Temperature (25°C or 37°C), reference power, stirring speed, number of injections (20-25), injection volume, and spacing.
- Run the experiment with buffer titrated into drug solution for background subtraction.
- Fit the resulting thermogram (heat flow vs. time, integrated to μcal/injection vs. molar ratio) to a suitable binding model (e.g., "one set of sites").
QbD Application: The measured Ka informs risk assessment. A high Ka may require reformulation to prevent overly strong binding that reduces bioavailability.
Visualizing the QbD-Driven Development Workflow
Title: QbD Workflow for Polymer-Drug Compatibility
The Scientist's Toolkit: Research Reagent Solutions
Table 2: Essential Materials for Compatibility Studies
| Item | Function/Explanation | Example Vendor/Product |
|---|---|---|
| Model Polymers | Broad coverage of chemistry for screening. | Sigma-Aldrich: PVP K30, HPMC 2910, PLGA 50:50, Eudragit L100. |
| High-Sensitivity DSC | Detects subtle Tg shifts and weak interactions. | TA Instruments: Discovery DSC 250, Mettler Toledo: DSC 3+. |
| Microcalorimetry (ITC) | Gold standard for label-free quantification of binding in solution. | Malvern Panalytical: MicroCal PEAQ-ITC. |
| Forced Degradation Kits | Systematic stress testing (heat, humidity, light) for stability. | Carterra: SMITH Degradation Kit for 96-well format. |
| Molecular Modeling Software | Predicts interaction energies & binding sites in silico. | Schrodinger: Maestro, BIOVIA: Materials Studio. |
| Stability Chambers | Controlled ICH conditions for long-term compatibility studies. | ThermoFisher Scientific: Heratherm ICH-compliant chambers. |
Mitigation Pathways for Common Incompatibilities
Title: Polymer-Drug Incompatibility Mitigation Strategies
Within a Quality by Design (QbD) pharmaceutical polymer development thesis, understanding and controlling process-induced transformations is critical for defining the Design Space and ensuring consistent Critical Quality Attributes (CQAs). This document provides application notes and protocols for troubleshooting three key transformations: chemical degradation, physical morphology changes, and plasticization. These can arise from unit operations like hot-melt extrusion, milling, compression, or storage under stress conditions.
Table 1: Analytical Signatures of Key Process-Induced Transformations
| Transformation Type | Primary Analytical Techniques | Key Quantitative Indicators & Typical Ranges | Potential Impact on CQAs |
|---|---|---|---|
| Polymer Degradation | Size Exclusion Chromatography (SEC), HPLC, TGA-FTIR | • Mw decrease >10% from baseline.• Increase in carboxyl end groups >5 μmol/g.• Appearance of new HPLC peaks >0.1% area. | Reduced mechanical strength, altered drug release kinetics, potential toxicity. |
| Morphology Change (Crystalline/Amorphous) | Differential Scanning Calorimetry (DSC), XRPD, mDSC | • Change in % crystallinity >5% absolute.• Shift in Tg >3°C.• Appearance/disappearance of XRPD peaks. | Solubility/bioavailability shifts, instability, altered compaction behavior. |
| Plasticization (Water/Sorbed Solvents) | Dynamic Vapor Sorption (DVS), DMTA, DSC | • Tg reduction >10°C at 5% moisture uptake.• Increased moisture sorption >2% w/w at 75% RH. • Shift in viscoelastic loss peak. | Stickiness, poor flow, reduced glassy state stability, microbial growth risk. |
Table 2: Common Process Stressors and Associated Risks
| Unit Operation | Typical Stressors (Range) | Most Likely Transformation(s) |
|---|---|---|
| Hot-Melt Extrusion | High Shear (100-1000 s⁻¹), Temp (70-200°C), Residence Time (1-5 min) | Thermal/Mechanochemical Degradation, Plasticization (by melt), Amorphization. |
| Spray Drying | Inlet Temp (80-200°C), Atomization Shear, Rapid Quenching | Incomplete Solvent Removal (Residual Solvent Plasticization), Amorphization. |
| Milling/Comminution | Impact Energy, Time (5-60 min), Local Heat Generation | Mechano-crystallization or Amorphization, Surface Degradation. |
| Compression | Compaction Force (5-40 kN), Die Wall Friction | Polymorphic Transition, Particle Fracture (Morphology Change). |
Detailed Experimental Protocols
Protocol 3.1: Accelerated Shear-Thermal Stress Test for Degradation
Objective: Simulate and quantify degradation from high-shear, high-temperature processing (e.g., extrusion).
Materials:
- Torque Rheometer or Micro-compounder.
- Test polymer (dried).
- Nitrogen purge gas.
- SEC vials and solvent.
Method:
- Pre-dry polymer according to supplier specifications (e.g., 40°C under vacuum for 24 h).
- Load rheometer chamber with a defined mass (e.g., 40 g). Purge with N₂ for 5 min.
- Set temperature to a target process temperature (Tprocess) and rotor speed to induce target shear rate (γtarget).
- Process material for a defined residence time (t_residence, e.g., 5, 10, 15 min).
- At each time point, collect a small aliquot (~100 mg) via purge port. Immediately quench in liquid N₂.
- Dissolve aliquots in appropriate SEC solvent at known concentration (e.g., 2 mg/mL). Filter (0.45 μm PTFE).
- Analyze by SEC. Record Mw, Mn, and Polydispersity Index (PDI).
- Plot Mw vs. t_residence. Degradation rate can be modeled via zero-order or first-order kinetics.
Protocol 3.2: Protocol for Distinguishing Morphology Changes via mDSC
Objective: Quantify glass transition temperature (Tg), enthalpy relaxation, and subtle crystalline content.
Materials:
- Modulated DSC (mDSC) instrument.
- Tzero hermetic pans and lids.
- Analytical balance.
Method:
- Precisely weigh 5-10 mg of sample into a Tzero pan. Hermetically seal.
- Method Parameters:
- Equilibrate at 20°C below expected Tg.
- Ramp at 2°C/min to a temperature above melting/transition.
- Apply modulation: ±0.5°C every 60 seconds.
- Use N₂ purge at 50 mL/min.
- Run an empty sealed pan as reference.
- Analyze reversing heat flow signal for Tg (midpoint). Analyze non-reversing heat flow for enthalpy recovery (physical aging) or cold crystallization events.
- Compare Tg and enthalpy values to an unstressed control. A broadening or downward shift in Tg indicates heterogeneity or plasticization. An exothermic peak in the non-reversing signal indicates crystallization upon heating.
Protocol 3.3: Dynamic Vapor Sorption (DVS) Protocol for Plasticization Potential
Objective: Measure moisture/solvent uptake and its effect on Tg in a single experiment.
Materials:
- DVS instrument with integrated humidity and temperature control.
- Quartz crystal microbalance (QCM) or high-sensitivity balance.
- Dried polymer film or powder.
Method:
- Pre-dry sample in the DVS at 0% RH and 25°C until constant mass (dm/dt <0.002%/min).
- Program an isothermal (25°C) sorption cycle: 0% → 95% RH in 10% RH increments.
- At each RH step, hold until equilibrium (dm/dt <0.01%/min for 10 min) or for a maximum of 3 hours.
- Record the equilibrium mass change at each RH. Plot sorption isotherm.
- For Tg depression analysis: After equilibration at key RH steps (e.g., 30%, 60%, 90%), rapidly transfer a sub-sample to a DSC and run a rapid heat-cool-heat cycle to measure Tg. Alternatively, use DMTA on films conditioned at these RHs.
- Fit data to the Gordon-Taylor equation to model Tg depression as a function of moisture content.
Visualization: Workflow & Relationships
Title: Troubleshooting Decision Workflow for Process-Induced Failures
Title: QbD Framework for Polymer Process Transformation Studies
The Scientist's Toolkit: Key Research Reagent Solutions
Table 3: Essential Materials for Transformation Troubleshooting
| Item/Category | Example Product/Specification | Function in Troubleshooting |
|---|---|---|
| Model Polymer for Stress Studies | PVP VA64 (Vinylpyrrolidone-vinyl acetate copolymer), HPMCAS-LF, PLGA 50:50. | Well-characterized, sensitive to heat/shear/moisture; used as a benchmark in Protocol 3.1. |
| SEC/SLS Standards | Narrow dispersity PMMA or PEG standards (e.g., Agilent ReadyCal). | Essential for calibrating SEC to obtain accurate Mw, Mn, and PDI for degradation studies. |
| Hermetic Sealing DSC Pans | Tzero aluminum pans & lids (TA Instruments) or equivalent. | Ensure no mass loss during mDSC runs (Protocol 3.2), crucial for accurate Tg measurement. |
| Desiccant for Pre-Drying | Molecular sieves (3Å or 4Å), phosphorus pentoxide (P₂O₅). | Create ultra-dry environment for pre-drying polymers prior to DVS or sensitive analysis. |
| Controlled Humidity Standards | Saturated salt solutions (e.g., LiCl, MgCl₂, NaCl, K₂SO₄) for RH chambers. | Generate specific, constant RH environments for conditioning samples in plasticization studies. |
| Chemical Stabilizers (Probes) | Butylated hydroxytoluene (BHT), Tocopherol, Triphenyl phosphate. | Added in small amounts during stress tests to probe radical or hydrolytic degradation mechanisms. |
| QCM DVS Substrates | Quartz crystal sensors with gold coating. | Provide ultra-sensitive mass change measurement for thin films in vapor sorption studies. |
Application Notes: QbD Principles in Polymer Stabilization
Within a Quality by Design (QbD) framework for pharmaceutical polymer development, understanding and controlling instability is paramount. Physical instability (e.g., phase separation, crystallization, swelling) and chemical instability (e.g., hydrolysis, oxidation, de-polymerization) directly impact drug product performance, shelf life, and patient safety. Systematic risk assessment through tools like Ishikawa diagrams and Design of Experiments (DoE) is employed to identify Critical Material Attributes (CMAs) and Critical Process Parameters (CPPs) that influence stability.
Key Risk Factors:
- Polymer-Related: Molecular weight, polydispersity index (PDI), crystallinity, glass transition temperature (Tg), hydrophilicity/hydrophobicity balance, functional group reactivity.
- Drug-Related: Solubility in the polymer, molecular interactions (H-bonding, ionic), chemical stability.
- Process-Related: Shear during mixing, thermal history, residual solvent content, annealing conditions.
- Environmental: Storage temperature, relative humidity (RH), light exposure, oxygen ingress.
Quantitative Data on Instability Drivers
Table 1: Impact of Key Polymer Properties on Stability Mechanisms
| Polymer Attribute | Typical Range Analyzed | Effect on Physical Stability | Effect on Chemical Stability | Key Measurement Technique |
|---|---|---|---|---|
| Glass Transition Temp (Tg) | 40°C to 150°C | Higher Tg reduces molecular mobility, slowing phase separation & crystallization. | Reduced mobility can slow solid-state oxidation/hydrolysis. | Differential Scanning Calorimetry (DSC) |
| Molecular Weight (Mw) | 10 kDa to 500 kDa | Higher Mw increases viscosity, inhibiting drug migration/aggregation. | End-group concentration decreases with Mw, potentially reducing hydrolysis sites. | Gel Permeation Chromatography (GPC) |
| Residual Moisture | 0.1% to 5% w/w | Plasticizing agent; lowers Tg, increases mobility and risk of phase separation. | Primary driver for hydrolytic degradation of esters, carbonates. | Karl Fischer Titration |
| Crystallinity | 0% to 60% | Reduces drug diffusion; can cause brittle fracture or anisotropic swelling. | Often more chemically resistant than amorphous regions. | X-ray Diffraction (XRD) |
| Oxygen Permeability | 0.1 to 500 (cm³·mm/m²·day·atm) | Facilitates drug oxidation. Direct driver of polymer auto-oxidation. | Manometric methods, coulometric sensors. |
Table 2: Accelerated Stability Study Results for Model PLGA Formulations
| Formulation (PLGA 50:50) | Storage Condition | Time Point | Mw Retention (%) | Mass Loss (%) | Tg Shift (°C) | Drug Recovery (%) |
|---|---|---|---|---|---|---|
| Low Mw (15 kDa), Unannealed | 40°C / 75% RH | 1 Month | 65.2 ± 3.1 | 5.8 ± 0.9 | -12.5 ± 1.2 | 88.5 ± 2.4 |
| High Mw (80 kDa), Unannealed | 40°C / 75% RH | 1 Month | 89.7 ± 2.4 | 1.2 ± 0.3 | -4.2 ± 0.8 | 98.1 ± 1.1 |
| High Mw (80 kDa), Annealed | 40°C / 75% RH | 1 Month | 94.5 ± 1.8 | 0.8 ± 0.2 | -1.5 ± 0.5 | 99.3 ± 0.5 |
| High Mw, Dry (40°C / <10% RH) | 40°C / <10% RH | 1 Month | 98.9 ± 0.5 | 0.3 ± 0.1 | +0.5 ± 0.3 | 99.8 ± 0.2 |
Experimental Protocols
Protocol 1: QbD-Based Accelerated Stability Study for Hydrolytic Degradation
Objective: To model and predict the long-term chemical instability (hydrolysis) of a polyester-based matrix (e.g., PLGA, PCL) under various stress conditions. Materials: Polymer, analytical balance, controlled humidity chambers, DSC, GPC.
- DoE Setup: Define factors: Temperature (25°C, 40°C), Relative Humidity (30%, 60%, 75%), and Polymer LA:GA ratio. Use a full factorial design.
- Sample Preparation: Prepare uniform polymer films using solvent casting. Dry under vacuum to a defined initial residual moisture.
- Stress Storage: Place samples in stability chambers at predefined DoE conditions. Include sampling time points (e.g., 0, 1, 2, 4, 8 weeks).
- Analysis:
- Molecular Weight: Analyze by GPC at each time point. Plot Ln(Mw) vs. time to determine degradation rate constant (k).
- Thermal Properties: Measure Tg by DSC.
- Mass Loss: Precisely weigh samples after drying surface moisture.
- Modeling: Use statistical software to build a predictive model (e.g., polynomial equation) linking degradation rate to temperature and humidity. Calculate activation energy (Ea) via Arrhenius equation.
Protocol 2: Protocol for Assessing Physical Instability via Fluorescence Microscopy
Objective: To visualize and quantify phase separation or drug crystallization within a polymer matrix. Materials: Polymer, fluorescent dye (e.g., Nile Red), model drug, hot-stage microscope, spin coater, image analysis software.
- Labeled Matrix Preparation: Co-dissolve polymer and a minimal amount of hydrophobic fluorescent dye (e.g., 0.01% w/w Nile Red) in a common solvent.
- Film Formation: Spin-coat the solution onto a glass slide to create a thin, uniform film. Dry under inert atmosphere.
- Stress Application: Place film on a hot-stage. Program a temperature cycle (e.g., heat to 10°C above Tg, hold, cool slowly) or expose to controlled humidity.
- Image Acquisition: Capture fluorescence images at regular intervals using a consistent exposure setting. Nile Red fluorescence is sensitive to local polarity; phase separation appears as areas of differing intensity.
- Quantification: Use image analysis software to calculate heterogeneity metrics (e.g., standard deviation of pixel intensity, domain size distribution) over time.
Visualization Diagrams
Diagram Title: Root Cause Map of Polymer Matrix Instability
Diagram Title: QbD Stability Study Workflow
The Scientist's Toolkit: Research Reagent Solutions
Table 3: Essential Materials for Polymer Stability Research
| Item | Function/Application | Key Consideration |
|---|---|---|
| Polylactide-co-glycolide (PLGA) | Model biodegradable polyester for studying hydrolysis kinetics. | Vary LA:GA ratio and end-cap to modulate degradation rate. |
| Polyethylene Glycol (PEG) | Hydrophilic additive; used to study phase separation and swelling behavior. | Molecular weight and blending ratio critically impact miscibility. |
| Nile Red / Fluorescent Dyes | Polarity-sensitive probes for visualizing phase separation via microscopy. | Choose dye based on solubility in the phase of interest. |
| Butylated Hydroxytoluene (BHT) | Common antioxidant; used to study and mitigate oxidative degradation pathways. | Evaluate compatibility and potential drug-polymer interactions. |
| Deuterated Solvents (CDCl₃, DMSO-d₆) | For NMR analysis of chemical structure changes (e.g., ester bond loss, oxidation products). | Must be anhydrous for accurate hydroxyl/acid end-group analysis. |
| Controlled Humidity Salts | Saturated salt solutions (e.g., MgCl₂, NaCl, K₂SO₄) to create specific RH in desiccators for stress studies. | Ensure temperature control for consistent RH. |
| Molecular Sieves (3Å/4Å) | For in-situ control of microenvironmental humidity within packaging or sample vials. | Must be activated (dried) prior to use. |
| Oxygen Scavengers | Sachets or tablets to create anaerobic conditions for oxidation studies. | Rate of oxygen absorption is temperature and humidity dependent. |
Application Notes on Critical Scale-Up Parameters
Successful translation from lab-scale synthesis to commercial manufacturing of pharmaceutical polymers requires systematic evaluation of scale-dependent variables. These notes detail key considerations within a Quality by Design (QbD) framework, where critical quality attributes (CQAs) are linked to critical process parameters (CPPs).
Table 1: Critical Scale-Up Parameters and Their Impact on Polymer CQAs
| Scale-Up Parameter | Laboratory Scale (1-5 L) | Pilot Scale (50-100 L) | Commercial Scale (500-2000 L) | Primary Impacted CQA(s) |
|---|---|---|---|---|
| Mixing/Agitation Efficiency | High shear, rapid homogenization | Reduced shear, potential gradients | Significantly lower shear, dead zones possible | Molecular weight distribution, copolymer composition uniformity, particle size |
| Heat Transfer Rate | Fast (high surface area-to-volume) | Moderately fast | Slow (low surface area-to-volume) | Reaction kinetics, thermal degradation, end-group fidelity |
| Reagent Addition Time | Near-instantaneous (sec-min) | Longer (minutes) | Extended (tens of minutes) | Block copolymer structure, monomer sequence, dispersity (Đ) |
| Mass Transfer (Gas-Liquid) | Efficient via sparging | Less efficient | Limited without specialized design | Residual monomer in vinyl polymers, oxidation control |
| Process Analytical Technology (PAT) Feedback | Offline sampling & analysis | At-line possible | Requires robust inline PAT | Real-time control of CQAs (e.g., conversion, viscosity) |
Detailed Experimental Protocols for Scale-Down/Scale-Up Studies
Protocol 1: Mixing and Shear Stress Profiling for Emulsion Polymerization Scale-Up
Objective: To simulate and predict the impact of commercial-scale agitation on latex particle size distribution (PSD).
Materials & Equipment:
- Lab-scale reactor with programmable overhead stirrer.
- Computational Fluid Dynamics (CFD) software or a calibrated torque rheometer.
- PAT tools: Inline particle size analyzer (e.g., dynamic light scattering probe), inline viscosity probe.
- Model emulsion polymerization formulation (e.g., poly(methyl methacrylate-co-butyl acrylate)).
Procedure:
- Baseline Formation: Perform the polymerization at lab scale (2 L) under ideal, high-shear mixing (500 RPM). Record full PSD, final conversion (by gravimetry or NIR), and viscosity profile.
- Shear Stress Simulation: Using the torque rheometer or CFD models, calculate the average shear rate and maximum shear stress in the lab reactor. Systematically reduce the agitation speed in subsequent lab batches (e.g., 400, 300, 200 RPM) to mimic the progressively lower shear environments of pilot and commercial reactors.
- Data Correlation: For each batch, measure:
- PSD at 30%, 70%, and 100% conversion.
- Coagulum formation (filter and weigh).
- Viscosity throughout the reaction.
- Define Design Space: Establish a correlation model between agitation speed (as a proxy for shear), PSD (CQA), and coagulum formation. This model defines the permissible range for the CPP "Agitation Rate" at scale.
Protocol 2: Heat Transfer Scaling Study for Exothermic Polycondensation
Objective: To determine safe initiator or catalyst addition rates and cooling jacket protocols for an exothermic step-growth polymerization (e.g., poly(lactic-co-glycolic acid) PLGA synthesis).
Materials & Equipment:
- Reaction calorimeter (e.g., RC1e).
- Lab, pilot, and (simulated) commercial reactor heat transfer coefficient (U) data.
- Temperature probes at multiple points in the reaction medium.
Procedure:
- Calorimetry: In the reaction calorimeter, perform the polymerization at a 1 L scale to measure the total heat of reaction (ΔHrxn) and the maximum heat release rate (Q̇_max).
- Scale-Up Simulation: Calculate the heat removal capacity (Qremoval) for a target commercial reactor using its known heat transfer area (A) and overall heat transfer coefficient (U): Qremoval = U * A * ΔT. ΔT is the difference between reactor temp and coolant temp.
- Safe Addition Rate Calculation: To prevent thermal runaway, the rate of reagent addition must ensure that the heat generation rate does not exceed 50-80% of the reactor's cooling capacity. Use the formula: Maximum Feed Rate = (0.7 * Q_removal) / ΔHrxn.
- Verification: Perform a pilot batch (50 L) using the calculated feed rate, monitoring internal temperature gradients. Adjust the model based on pilot data before commercial campaign.
Table 2: Key Research Reagent Solutions for Scale-Up Studies
| Reagent/Tool | Function in Scale-Up Research | Example Product/Chemical |
|---|---|---|
| Process Analytical Technology (PAT) Probes | Enables real-time monitoring of CQAs (conversion, particle size, viscosity) to close the loop on scale-dependent variances. | ReactIR (FTIR), FBRM (particle size), Inline Rheometer. |
| Computational Fluid Dynamics (CFD) Software | Models fluid flow, shear, and mixing efficiency in large vessels to predict gradients before manufacturing. | ANSYS Fluent, COMSOL Multiphysics. |
| Reaction Calorimeter | Precisely measures heat flow of reactions, critical for safely scaling exothermic polymerizations. | Mettler Toledo RC1, ChemiSens CPA202. |
| Surfactant/Stabilizer Kit | Used to empirically test stabilization efficiency under low-shear (scaled) conditions to prevent coagulation. | Poloxamers, PVP, SDS, Cellulose derivatives. |
| Taguchi or DoE Software | Applies Quality by Design principles to statistically model the interaction of multiple CPPs on CQAs. | JMP, Design-Expert, Minitab. |
| Scale-Down Reactor Systems | Mimics the imperfect mixing and heat transfer of large vessels in a lab setting for risk assessment. | AM Technology Coflore AG, HEL AutoMATE. |
Visualizations
Title: QbD Framework for Polymer Scale-Up
Title: Scale-Up Risk & Mitigation Workflow
Leveraging PAT (Process Analytical Technology) for Real-Time Polymer Process Monitoring
The implementation of Process Analytical Technology (PAT) is a cornerstone of the Quality by Design (QbD) paradigm for pharmaceutical polymer development. Within a thesis focused on QbD, PAT serves as the enabling toolkit for achieving the desired state of design space understanding and real-time release. This shifts quality assurance from traditional end-product testing to continuous, science-based monitoring and control of Critical Quality Attributes (CQAs) during polymer synthesis and processing. Real-time monitoring of parameters like molecular weight, copolymer composition, particle size, and crystallinity ensures that polymer excipients or drug-polymer products (e.g., for controlled release) are consistently produced within predefined specifications, enhancing robustness and reducing batch failures.
Application Notes: PAT Tools for Polymer Process Monitoring
Table 1: Common PAT Tools for Polymer Process Monitoring and Their Applications
| PAT Tool | Principle | Measured Polymer CQAs | Typical Point of Application |
|---|---|---|---|
| In-line FTIR/NIR Spectroscopy | Molecular vibration absorption | Monomer conversion, copolymer composition, end-group concentration | Reactor, extruder, fluid-bed dryer |
| Raman Spectroscopy | Inelastic light scattering | Crystallinity, polymorphic form, molecular structure | Reactor, crystallization unit, blender |
| In-line/On-line GPC/SEC | Size-exclusion chromatography | Molecular weight (Mw, Mn) and distribution (Ð) | Reactor slip-stream |
| Focus Beam Reflectance Measurement (FBRM) | Back-scattered laser light | Particle/granule count, size, and distribution | Crystallizer, reactor, granulator |
| PVM (Particle Vision and Measurement) | Image capture & analysis | Particle morphology, shape, size | Crystallization, suspension polymerization |
| Dielectric Spectroscopy | Dielectric response | Viscosity, glass transition (Tg), cure state | Reactor, curing oven |
Table 2: Quantitative Performance Metrics for Selected PAT Tools (Representative Data)
| PAT Tool | CQA Monitored | Reported Accuracy | Typical Response Time | Key Advantage |
|---|---|---|---|---|
| In-line NIR | Copolymer Ratio | >98% correlation to reference | 30-60 seconds | Non-contact, fiber-optic probes |
| Raman | Crystallinity | ±2% absolute | 1-2 minutes | Insensitive to water, robust probes |
| In-line GPC | Weight Avg. Mw (Mw) | ±3% vs. offline | 15-20 minutes | Direct, absolute measurement |
| FBRM | Chord Length (size) | High precision (tracking) | <1 second | Real-time particle dynamics |
Experimental Protocols
Protocol 3.1: Real-Time Monitoring of Copolymer Composition Using In-line NIR Spectroscopy
Objective: To monitor and control the monomer feed ratio and final composition of a poly(lactide-co-glycolide) (PLGA) copolymer synthesis in real-time. Materials: See Scientist's Toolkit below. Method:
- Calibration Model Development:
a. Produce a series of calibration batches with varying lactide/glycolide ratios (e.g., 50:50 to 85:15) under controlled conditions.
b. Acquire NIR spectra (e.g., 1100-2200 nm) in-line at the reactor using a fiber-optic immersion probe at 1-minute intervals.
c. Analyze final product composition for each batch using validated
¹H-NMRas a reference method. d. Use multivariate analysis (e.g., Partial Least Squares, PLS) to correlate spectral data (X-matrix) to the reference composition (Y-matrix). Validate model using cross-validation. - Real-Time Monitoring: a. Install the calibrated NIR probe into a new polymerization reactor. b. Initiate monomer feed and polymerization according to the design space parameters. c. Continuously collect and pre-process (e.g., SNV, derivative) NIR spectra. d. In real-time, apply the PLS model to predict the lactide/glycolide ratio from the spectral data. e. Use the predicted composition as feedback for a control system to adjust monomer feed pumps, maintaining the ratio within the target range (±2%).
- Verification: Take periodic grab samples for off-line
¹H-NMRanalysis to confirm the accuracy of the in-line predictions.
Protocol 3.2: Monitoring Polymer Crystallization Kinetics Using In-line Raman Spectroscopy
Objective: To track the crystallinity development of a polymeric film coating (e.g., polyethylene oxide) in a fluid-bed dryer in real-time. Materials: See Scientist's Toolkit below. Method:
- Probe Installation: Mount a non-contact Raman probe window into the side port of the fluid-bed dryer, ensuring a clear view of the moving bed.
- Spectral Acquisition: Start continuous Raman acquisition (e.g., 785 nm laser, 5s integration time) upon initiation of the drying/crystallization phase.
- Data Analysis: Focus on the characteristic crystalline and amorphous band regions (e.g., ~850-950 cm⁻¹ for PEO). Calculate the peak height or area ratio of crystalline to amorphous bands.
- Kinetic Modeling: Plot this ratio against time. Fit the data to an appropriate crystallization model (e.g., Avrami equation) to determine the rate constant and degree of crystallinity endpoint.
- Process Endpoint Determination: Define the process endpoint as the time when the crystallinity ratio plateaus, indicating completion of solid-state transformation. Use this signal to automatically trigger the cooling cycle.
The Scientist's Toolkit: Key Research Reagent Solutions & Materials
| Item | Function/Application | Example/Notes |
|---|---|---|
| Fiber-Optic Immersion Probe (NIR/FTIR) | Direct in-situ spectral measurement in reactors or vessels. | Reactor flange mounting, diamond-tip for abrasion resistance. |
| Non-Contact Raman Probe | Remote measurement through sight glass; ideal for dryers/blenders. | 785 nm laser minimizes fluorescence from polymers. |
| Flow Cell for In-line GPC | Interfaces reactor slip-stream to the GPC system for automated sampling. | Must be compatible with high-temperature polymer solutions. |
| FBRM C Probe | Provides real-time chord length distribution for particles in suspension. | Used in polymerization, crystallization, and granulation. |
| PAT Data Acquisition & Multivariate Analysis Software | Unifies data streams, builds calibration models, and enables real-time prediction. | Essential for implementing QbD and advanced process control. |
| Chemometric Calibration Standards | Well-characterized polymer samples for PAT model development. | Requires primary characterization by NMR, GPC, DSC, etc. |
Visualizations
Title: PAT-Enabled QbD Polymer Development Workflow
Title: Closed-Loop Control Using PAT for Polymer Synthesis
Assuring Robustness: Validation Strategies and Comparative Analysis of QbD vs. Traditional Approaches
Design Space Verification and Continuous Process Verification for Polymer Processes
The development of polymer-based drug products, including amorphous solid dispersions, controlled-release matrices, and polymeric nanoparticles, necessitates a rigorous Quality by Design (QbD) approach. This mandates the systematic definition of a Design Space (ICH Q8 R2) and its subsequent verification, followed by the implementation of Continuous Process Verification (CPV) as per ICH Q10. This document provides application notes and protocols for these critical activities within a pharmaceutical polymer development thesis.
Design Space Verification (DSV): Protocols and Application Notes
Design Space Verification is the formal, documented confirmation that the multidimensional combination of input variables and process parameters demonstrated to provide assurance of quality operates as intended under commercial manufacturing conditions.
Protocol 2.1: Multivariate Verification of a Hot-Melt Extrusion (HME) Design Space
Objective: To verify the edges of failure and proven acceptable ranges (PARs) for Critical Process Parameters (CPPs) in the manufacture of an itraconazole-HPMCAS solid dispersion.
Background: The prior QbD study defined a design space for barrel temperature (T), screw speed (SS), and feed rate (FR) with CQAs of dissolution rate (Q+30min), amorphous content (%), and degradation products.
Materials & Equipment:
- Twin-screw hot-melt extruder (e.g., Leistritz Nano-16).
- Itraconazole (API).
- HPMCAS-LG polymer.
- HPLC system, DSC, XRD, USP Apparatus II (paddle).
Experimental Design for Verification: A fractional factorial design with center points focusing on the edges of the established design space.
| Verification Run | Barrel Temp. (°C) | Screw Speed (rpm) | Feed Rate (kg/hr) | Purpose |
|---|---|---|---|---|
| V-1 | 155 (Low edge) | 350 (High edge) | 0.8 (Low edge) | Verify lower thermal/mechanical energy boundary |
| V-2 | 175 (High edge) | 250 (Low edge) | 1.2 (High edge) | Verify upper thermal energy boundary |
| V-3 | 165 (Center) | 300 (Center) | 1.0 (Center) | Confirm robustness at nominal conditions |
| V-4 | 175 (High edge) | 350 (High edge) | 0.8 (Low edge) | Verify high shear, high temp, low feed combination |
| V-5 | 155 (Low edge) | 250 (Low edge) | 1.2 (High edge) | Verify low shear, low temp, high feed combination |
Procedure:
- Pre-blend API and polymer geometrically for 15 minutes.
- Pre-set extruder zones to target temperatures and equilibrate for 30 min.
- Initiate feeding and screw rotation per run parameters.
- Allow process to stabilize (≥ 3 residence times), then collect extrudate for 10 minutes.
- Mill extrudate using a screen size of 0.5 mm.
- Analyze samples for all pre-defined CQAs.
Acceptance Criteria for Verification: All CQAs for all verification runs must remain within their predefined acceptance ranges (e.g., Q+30min ≥ 80%; amorphous content ≥ 95%; degradant ≤ 0.5%).
| Run ID | Dissolution Q+30min (%) | Amorphous Content (%) | Max. Degradant (%) | Torque (N·m) | Melt Temp. (°C) | Status |
|---|---|---|---|---|---|---|
| V-1 | 82 | 96.5 | 0.12 | 78 | 158 | PASS |
| V-2 | 85 | 95.1 | 0.48 | 65 | 178 | PASS |
| V-3 | 89 | 98.7 | 0.08 | 70 | 167 | PASS |
| V-4 | 81 | 94.8 | 0.52 | 82 | 180 | PASS (at limit) |
| V-5 | 84 | 96.2 | 0.15 | 60 | 156 | PASS |
Continuous Process Verification (CPV): Protocols and Application Notes
CPV is an alternative to traditional process validation (Stage 3). It involves continuous monitoring and evaluation of manufacturing process performance using multivariate statistical process control (MSPC) to ensure ongoing state of control.
Protocol 3.1: Establishing a CPV Plan for a Poly(Lactide-co-Glycolide) (PLGA) Nanoparticle Process
Objective: To implement a CPV system for a solvent-evaporation based PLGA nanoparticle manufacturing process post-Design Space approval.
CPV Strategy: A three-tiered approach monitoring Critical Process Parameters (CPPs), Critical Material Attributes (CMAs), and Critical Quality Attributes (CQAs).
Table 2: CPV Monitoring Plan for PLGA Nanoparticle Process
| Tier | Parameter / Attribute | Method/Frequency | Control Strategy |
|---|---|---|---|
| 1 | CPPs: Homogenization pressure, time, organic phase addition rate. | PLC data logging / Every batch. | Real-time alarms on PAR excursions. |
| 2 | CMAs: PLGA Mw, inherent viscosity, lactide:glycolide ratio. | GPC, viscometry, NMR / Per polymer lot. | Material specification. Multivariate batch release model. |
| 3 | CQAs: Particle size (PS), PDI, Zeta Potential, Drug Load. | Dynamic Light Scattering / Every batch. | Statistical Process Control (SPC) charts (e.g., X-bar, R). Annual product review trend analysis. |
Procedure for MSPC Model Development (Pre-CPV):
- Collect historical data from at least 20 successful development and pilot batches.
- Compile data into a matrix (batches x variables), including CPPs, CMAs, and in-process measurements.
- Pre-process data (autoscale, mean-center).
- Develop a Principal Component Analysis (PCA) model using multivariate statistical software (e.g., SIMCA, JMP).
- Establish control limits for Hotelling's T² and SPE (Squared Prediction Error) charts.
- Validate the model with subsequent batches not used in model construction.
Ongoing CPV Execution:
- For each new batch, collect all process data.
- Project the new batch data onto the established PCA model.
- Calculate its T² and SPE values.
- Flag any batch that exceeds the established control limits for investigation using a pre-defined root cause analysis protocol.
The Scientist's Toolkit: Key Research Reagent Solutions
Table 3: Essential Materials for QbD Polymer Process Development & Verification
| Item | Function / Relevance | Example(s) |
|---|---|---|
| pH-Sensitive Polymers | Enable targeted drug release in specific GI tract regions. Critical for design space of dissolution. | HPMCAS, Eudragit L100/S100, CAP. |
| Polymer Plasticizers | Modify glass transition temperature (Tg) and processability in HME. Key CMA affecting CPPs. | Triethyl citrate, PEG, Dibutyl sebacate. |
| Biodegradable Polyesters | Formulation of long-acting injectables or implants. Design space for erosion-based release. | PLGA, PLA, PCL. |
| Stabilizers/Surfactants | Control particle size and stability in nanoprecipitation/emulsion processes. | PVA, Poloxamers (e.g., F68), Vitamin E TPGS. |
| Model API Compounds | Used in feasibility and robustness studies due to well-characterized properties. | Itraconazole (poorly soluble), Metformin HCl (soluble), Diclofenac sodium. |
| Process Analytical Technology (PAT) Probes | Enable real-time monitoring for CPV (e.g., NIR for blend uniformity, FBRM for particle size). | In-line NIR, Raman, Focused Beam Reflectance Measurement. |
Visualizations
Design Space Verification Protocol Workflow
Continuous Process Verification MSPC Logic Flow
Within the Quality by Design (QbD) framework for pharmaceutical polymer development, post-approval lifecycle management is a systematic approach to maintaining product quality while enabling continuous improvement. The interplay between established design spaces and regulated post-approval changes is critical. This document provides application notes and protocols for managing changes to polymer-based drug products after initial approval, with a focus on design space verification and regulatory pathways.
Application Notes on Post-Approval Change Management
Regulatory Framework for Changes
The management of post-approval changes is guided by regional regulatory documents. The following table summarizes key guidelines.
Table 1: Regulatory Guidelines for Post-Approval Changes
| Region/Agency | Guideline Reference | Key Scope for Polymer Products | Reporting Category Examples (Change Level) |
|---|---|---|---|
| U.S. FDA | SUPAC-IR/MR, Guidance for Industry: Changes to an Approved NDA or ANDA | Changes in polymer excipient supplier, grade, or specification; manufacturing process changes. | Prior Approval Supplement (PAS), Changes Being Effected in 30 days (CBE-30), Annual Report (AR) |
| EU EMA | Guideline on details of the various categories of variations (EC) No 1234/2008 | Changes within approved design space vs. outside; changes to polymer molecular weight distribution. | Type IA (Notification), Type IB (Do & Tell), Type II (Prior Approval) |
| ICH | ICH Q12: Technical and Regulatory Considerations for Pharmaceutical Product Lifecycle Management | Established Conditions (ECs), Post-Approval Change Management Protocols (PACMPs) for design space elements. | Defined per approved PACMP |
Design Space Management Post-Approval
A validated design space for a polymer-based formulation provides flexibility. Changes within the approved design space are typically managed via lower-reporting categories. The following table outlines a decision logic.
Table 2: Post-Approval Change Classification Relative to Design Space
| Change Description | Relation to Approved Design Space | Typical Regulatory Reporting | Required Supporting Data |
|---|---|---|---|
| Shift in polymer viscosity within approved range (e.g., 40-60 cP to 45-55 cP) | Within Design Space | Annual Report (FDA) / Type IA (EU) | Batch records, routine QC testing. |
| Change in polymer supplier, but all CQAs remain within design space boundaries | Within Design Space (if supplier qualification is part of space) | CBE-30 / Type IB | Comparative dissolution, stability (3 months accelerated). |
| Increase in polymer concentration to a value outside the studied/approved range | Outside Design Space | Prior Approval Supplement / Type II | Full justification, new risk assessment, enhanced dissolution/stability (6 months accelerated). |
| Change in polymer drying method (e.g., tray → fluid bed) affecting particle morphology | May impact linkage to design space (new parameter) | Prior Approval Supplement / Type II | New multivariate studies to verify CQAs, updated risk assessment, full stability. |
Experimental Protocols for Change Support
Protocol: Verification of Design Space Robustness for a Polymer Supplier Change
Objective: To verify that a change in polyvinylpyrrolidone (PVP) supplier does not adversely affect the Critical Quality Attributes (CQAs) of an immediate-release tablet within the approved design space.
Materials:
- APIs & Excipients: Active Pharmaceutical Ingredient (API), PVP from Original Supplier (Kollidon 30), PVP from New Supplier (Proposed Equivalent), Microcrystalline Cellulose, Magnesium Stearate.
- Equipment: High-shear granulator, fluid bed dryer, oscillating mill, rotary tablet press, dissolution apparatus (USP II), HPLC system, texture analyzer.
Methodology:
- Risk Assessment: Update the prior risk assessment (e.g., FMEA) focusing on material attributes of the new PVP (e.g., residual solvents, heavy metals, particle size distribution, viscosity).
- Comparative Characterization: Fully characterize the new PVP against the original specification and the approved design space input ranges.
- Bracketing Batch Manufacture: Manufacture three validation batches at the worst-case conditions within the design space (e.g., lower binder concentration, shorter granulation time) using the new PVP.
- CQA Testing: Analyze all batches for CQAs:
- Content Uniformity: Per USP <905>.
- Dissolution Profile: Use f2 similarity factor comparison to original bio-batch.
- Tablet Hardness/Friability: Standard USP methods.
- Stability Study: Place batches on accelerated stability (40°C/75% RH) for 3 months, testing at 0, 1, 2, 3 months.
Acceptance Criteria:
- All CQAs must remain within approved design space output ranges.
- f2 similarity factor vs. reference ≥ 50.
- No significant degradation or physical changes on stability.
Protocol: Assessing Impact of a Manufacturing Process Change (Scale-Up)
Objective: To assess the impact of scaling up the wet granulation process for a sustained-release matrix tablet containing hydrophilic polymer (HPMC) from 10kg to 50kg batch size and support a PAS submission.
Methodology:
- Scale-Down Model Qualification: First, qualify the small-scale model (e.g., 1kg) that can predict performance at 10kg commercial scale using historical data.
- Multivariate Studies at Pilot Scale: Using the qualified small-scale model, conduct a Design of Experiment (DoE) to study interactions between new scale-dependent parameters (e.g., impeller tip speed, spray rate) and CQAs (e.g., release profile, tablet strength).
- Engineering Runs: Execute three engineering runs at the 50kg scale to calibrate equipment and finalize parameters.
- Exhibit Batch Manufacture & Testing: Manufacture three consecutive exhibit batches at 50kg. Perform extensive testing:
- In-process controls: Granule particle size distribution, bulk/tapped density, LOD.
- Final Product: Full compendial testing, dissolution profile comparison (model-dependent or independent analysis), and 6-month accelerated stability.
- Statistical Comparison: Use multivariate analysis (e.g., PCA, equivalence testing) to demonstrate comparability of the 50kg product to the original 10kg bio-batch across all CQAs.
Visualizations
Post-Approval Change Decision Logic
Design Space Lifecycle: Development to Management
The Scientist's Toolkit: Key Research Reagent Solutions
Table 3: Essential Materials for Post-Approval Change Studies
| Item / Reagent | Function in Post-Approval Change Studies | Example Supplier / Product |
|---|---|---|
| Polymer Reference Standards | Serves as the benchmark for comparability testing when changing polymer source or grade. Essential for spectroscopic and chromatographic comparisons. | USP Povidone RS, HPMC Pharmacoat Reference Standard |
| Dissolution Calibrators | Validates dissolution apparatus performance for critical profile comparisons (f2 factor calculation) between pre- and post-change batches. | USP Prednisone, Salicylic Acid, Water-soluble Calibration Tablets |
| Stability-Indicating HPLC Methods | Reagents and columns specifically qualified to separate degradants from API and polymer-related impurities, crucial for stability studies supporting changes. | Waters XBridge C18 Column, Thermo Scientific Hypersil GOLD |
| Particle Size Analyzer Standards | Calibrates particle size distribution instruments for characterizing polymer or granule changes, a key material attribute. | NIST Traceable Polystyrene Latex Spheres |
| Traceable Analytical Standards | For elemental impurities (ICH Q3D) testing, required when changing polymer supplier or synthesis route. | ICP-MS Calibration Standard Mix (As, Cd, Pb, Hg, etc.) |
Application Notes
The development of pharmaceutical-grade polymers for applications such as controlled-release coatings, bioadhesives, or amorphous solid dispersions is a critical path in modern drug development. This comparative analysis evaluates the impact of a systematic Quality by Design (QbD) framework against a traditional empirical approach on project timelines, resource allocation, and scientific outcomes. The study is contextualized within a broader thesis advocating for QbD as a paradigm for robust, science-based polymer development.
Key Findings Summary:
- QbD-Driven Approach: Employs a systematic, risk-based methodology. It begins with defining a Target Product Profile (TPP) and Critical Quality Attributes (CQAs) of the polymer system. Through initial risk assessment and Design of Experiments (DoE), a multidimensional design space linking Material Attributes (MAs) and Process Parameters (PPs) to CQAs is established. This knowledge space facilitates first-principles formulation, predictive modeling, and defines a control strategy.
- Empirical Approach: Relies on sequential, one-factor-at-a-time (OFAT) experimentation guided by prior experience and literature. The process is often iterative and reactive, with formulation adjustments made in response to failed specifications. The knowledge gained is primarily linear and specific to the tested conditions.
Quantitative outcomes from simulated development projects for a model enteric coating polymer system are summarized below.
Table 1: Comparative Development Timelines and Milestones
| Development Phase | Empirical Approach (Weeks) | QbD-Driven Approach (Weeks) | Notes |
|---|---|---|---|
| 1. Pre-formulation & Planning | 2 | 6 | QbD invests more in upfront QTPP/CQA definition & risk assessment. |
| 2. Initial Prototype Screening | 12 | 10 | OFAT requires more cycles. QbD uses parallel DoE for screening. |
| 3. Optimization | 14 | 8 | OFAT is sequential. QbD uses definitive DoE for design space. |
| 4. Robustness Testing | 6 | (Integrated into Phase 3) | QbD robustness is evaluated within DoE. |
| 5. Control Strategy Definition | 4 | 3 | QbD control strategy is derived from design space. |
| 6. Regulatory Documentation Prep | 8 | 6 | QbD submission includes design space justification, reducing queries. |
| Total Project Timeline | 46 Weeks | 33 Weeks | QbD shows ~28% reduction in timeline. |
Table 2: Comparative Experimental & Outcome Metrics
| Metric | Empirical Approach | QbD-Driven Approach |
|---|---|---|
| Number of Batches Produced | 45 | 28 |
| Formulation Success Rate (Meets CQAs) | 55% | 92% |
| Understood Critical Factors | 3 (Limited interactions) | 6 + 2 key interactions |
| Design Space Established? | No | Yes (Defined region of proven control) |
| Likelihood of Scale-up Failure | High | Low (Mitigated by knowledge space) |
| Overall Resource Efficiency | Low | High |
Protocols
Protocol 1: QbD-Driven Development of an Enteric Coating Polymer Dispersion
Objective: To define a design space for a methacrylic acid copolymer (Type C) dispersion where critical quality attributes (Film Tensile Strength, Dissolution at pH 6.8, and Mean Particle Size) are consistently met.
I. Materials & Reagents (The Scientist's Toolkit)
| Item | Function / Rationale |
|---|---|
| Methacrylic Acid Copolymer (Type C) | pH-dependent polymer, core material for enteric coating. |
| Plasticizer (e.g., Triethyl Citrate) | Modifies polymer chain mobility, improves film formation and mechanical properties. |
| Anti-tack Agent (e.g., Talc) | Prevents agglomeration of coated units during processing. |
| Aqueous Ammonia Solution | Neutralizing agent for polymer dispersion, critical for particle size and stability. |
| Purified Water | Dispersion medium. |
| Design of Experiments (DoE) Software | For statistical experimental design, modeling, and design space visualization (e.g., JMP, Design-Expert). |
II. Experimental Workflow
- Define Quality Target Product Profile (QTPP): Coating must prevent release in acidic media (pH <5) and release ≥80% in 45 min at pH 6.8, with robust mechanical integrity.
- Identify CQAs: Film Tensile Strength (≥2.0 MPa), Dissolution at pH 6.8 (T80% ≤45 min), Dispersion Mean Particle Size (Dv50: 0.5-1.5 µm for sprayability).
- Risk Assessment & Factor Selection: Using an Ishikawa diagram and prior knowledge, select Critical Material Attributes (CMAs) and Critical Process Parameters (CPPs) for study: CMA1: Polymer Solid Content (%), CMA2: Plasticizer Concentration (%), CPP1: Neutralization pH, CPP2: Homogenization Shear Time (min).
- Design of Experiments: Execute a 2^4 Full Factorial Design with 3 center points (19 total experiments). Prepare dispersions per the design matrix.
- Analysis & Modeling: Measure CQAs for each batch. Fit multivariate regression models to the data. Perform ANOVA to identify significant factors and interactions.
- Design Space Definition: Using the models, overlay contour plots for all CQAs meeting their respective limits. The region of overlap is the multivariate design space.
- Control Strategy: Define normal operating ranges (NORs) within the proven acceptable ranges (PARs) of the design space. Implement real-time monitoring of CPPs (e.g., pH) and testing of CMAs.
Protocol 2: Empirical (OFAT) Optimization of the Same Dispersion
Objective: To find a working formulation for an enteric coating dispersion through sequential experimentation.
I. Materials & Reagents: Same as Protocol 1.
II. Experimental Workflow
- Literature/Experience-Based Starting Point: Begin with a baseline formula (e.g., 15% polymer, 10% plasticizer, neutralized to pH 6.0).
- Sequential Variation: Hold all factors constant except one.
- Step A: Vary Plasticizer (8%, 10%, 12%) while fixing polymer at 15% and pH at 6.0. Select best (e.g., 10%) based on film flexibility.
- Step B: With plasticizer at 10%, vary Neutralization pH (5.8, 6.0, 6.2). Select best (e.g., 6.2) based on particle size.
- Step C: With plasticizer 10% and pH 6.2, vary Polymer Solid Content (12%, 15%, 18%). Select best (e.g., 15%) based on viscosity.
- Iterative Troubleshooting: Test the "optimized" formula (15%, 10%, pH 6.2). If dissolution fails, return to Step B to adjust pH again, potentially destabilizing the previously selected particle size.
- Finalization: After multiple cycles, finalize a formula that passes all CQA tests for the current batch. Scale-up is treated as a new optimization problem.
Visualizations
Title: QbD Systematic Development Workflow
Title: Empirical OFAT Development Workflow
Title: QbD Links Risk to Proactive Control
Within the paradigm of modern pharmaceutical development, Quality by Design (QbD) is a systematic, scientific, and risk-based approach to product development. For drug products utilizing novel polymeric excipients or delivery systems, demonstrating deep product understanding to regulatory agencies via submissions is paramount. This application note, framed within a thesis on QbD-driven polymer development, outlines specific protocols and analytical strategies. The goal is to transform empirical development into a knowledge-rich process that satisfies regulatory expectations for defined quality, robust manufacturing, and ultimately, patient safety and efficacy.
Application Note: Defining the Quality Target Product Profile (QTPP) and Critical Quality Attributes (CQAs) for a Polymeric Matrix Tablet
The foundation of any QbD submission is a clear definition of the Quality Target Product Profile (QTPP)—a prospective summary of the quality characteristics necessary for the intended product. For a sustained-release formulation using a pH-sensitive polymer (e.g., Eudragit), the QTPP and derived CQAs must be explicitly linked.
Table 1: QTPP and Derived CQAs for a Model Sustained-Release Tablet
| QTPP Element | Target | Rationale | Derived CQAs |
|---|---|---|---|
| Dosage Form | Oral Matrix Tablet | Patient compliance, route of administration. | Tablet hardness, friability, identity. |
| Pharmacokinetics | 24-hour sustained release | Therapeutic requirement. | Drug Release Profile (at pH 1.2, 4.5, 6.8), associated kinetics (e.g., Korsmeyer-Peppas ‘n’ value). |
| Drug Product Quality | Assay: 95-105% LC; Uniformity: AV ≤15 | Regulatory standards (ICH Q6A). | Assay, Content Uniformity, Degradation Impurities. |
| Stability | ≥24 months shelf-life at 25°C/60% RH | Commercial viability. | Related substances, dissolution profile stability, moisture content. |
Experimental Protocol: Conducting a Risk Assessment & Designing Experiments
Protocol 2.1: Initial Risk Assessment Using an Ishikawa (Fishbone) Diagram
- Objective: To identify material attributes and process parameters potentially impacting the CQAs of a polymeric film coating.
- Materials: Coating polymer (e.g., HPMC, Eudragit), plasticizer, pigment, API core, fluid-bed coater.
- Methodology:
- Assemble a multidisciplinary team (Formulation, Process Engineering, Analytics).
- Place the CQA (e.g., "Coating Integrity/Release Profile") as the "head" of the fishbone.
- Brainstorm potential causes along the major bones: Materials (polymer grade, viscosity), Method (spray rate, atomization pressure), Machine (inlet air temperature, pan speed), Measurement (end-point determination), Environment (RH during coating), and People (training on setup).
- Score each factor for severity, occurrence, and detectability (e.g., on a 1-3 scale). Calculate a Risk Priority Number (RPN).
- Output: A prioritized list of factors for investigation in Design of Experiments (DoE).
Diagram 1: Ishikawa Diagram for Film Coating Defects
Protocol 2.2: Executing a Design of Experiments (DoE) for Polymer-based Formulation
- Objective: To model the relationship between Critical Material Attributes (CMAs), Critical Process Parameters (CPPs), and the CQA of drug release.
- Design: A 2^3 Full Factorial Design with 2 center points (for a total of 10 runs).
- Independent Variables (Factors):
- X1: Polymer-to-Drug Ratio (Low: 1:1, High: 3:1)
- X2: Compression Force (Low: 10 kN, High: 20 kN)
- X3: Curing Time (Low: 0 hrs, High: 4 hrs at 40°C)
- Dependent Variable (Response):
- Y1: % Drug Released at 8 hours (USP Apparatus II, pH 6.8).
- Procedure:
- Manufacture tablets according to the randomized run order provided by the DoE software (e.g., JMP, Design-Expert).
- For each run, characterize the response (Y1) in triplicate.
- Input data into statistical software to generate a polynomial model (e.g., Y = β0 + β1X1 + β2X2 + β3X3 + β12X1X2 + ...).
- Analyze ANOVA (p-values), model adequacy (R², adjusted R²), and contour plots to define the Design Space.
Table 2: Example DoE Results and Model Analysis
| Run Order | X1:Polymer Ratio | X2:Force (kN) | X3:Cure (hr) | Y1:% Release (8h) Mean±SD |
|---|---|---|---|---|
| 1 | 1 (Low) | -1 (Low) | -1 (Low) | 95.2 ± 1.5 |
| 2 | 1 (High) | -1 (Low) | -1 (Low) | 65.3 ± 2.1 |
| ... | ... | ... | ... | ... |
| 10 | 0 (Center) | 0 (Center) | 0 (Center) | 78.9 ± 0.8 |
| Model Term | Coefficient | p-value | Conclusion | |
| Intercept | 79.05 | <0.0001 | Significant Model | |
| X1 (Polymer) | -12.45 | <0.0001 | Most significant factor | |
| X2 (Force) | -2.10 | 0.032 | Significant factor | |
| X3 (Cure) | -5.20 | 0.001 | Significant factor | |
| X1*X3 | -3.15 | 0.015 | Significant interaction | |
| R² / Adj R² | 0.978 / 0.964 | Model is predictive |
Diagram: QbD Knowledge Management in Regulatory Submissions
Diagram 2: QbD Knowledge Management Lifecycle
The Scientist's Toolkit: Research Reagent Solutions for Polymeric QbD
Table 3: Essential Materials for QbD-based Polymer Formulation Research
| Item / Reagent Solution | Function / Relevance in QbD |
|---|---|
| pH-Sensitive Polymers (e.g., Eudragit L100, S100) | Critical Material Attribute (CMA). Used to design colon-targeted or sustained-release profiles. Polymer grade and ratio are key DoE factors. |
| Hydrophilic Matrix Polymers (e.g., HPMC K4M, K100M) | CMA for sustained-release. Viscosity grade and concentration directly impact drug release rate, a primary CQA. |
| Plasticizers (e.g., Triethyl Citrate, PEG 400) | Modifies film-forming properties of polymeric coatings. A key variable for optimizing coating processability and performance. |
| Dissolution Media (pH 1.2, 4.5, 6.8, 7.4) | For simulating gastrointestinal tract conditions. Essential for characterizing the drug release profile CQA under diverse conditions. |
| Statistical Software (e.g., JMP, Design-Expert) | Enables DoE design, statistical modeling of factor-response relationships, and graphical definition of the Design Space. |
| Process Analytical Technology (PAT) e.g., NIR Probe | For real-time monitoring of CPPs (e.g., coating thickness, blend uniformity). Supports real-time release and continuous verification. |
| Stability Chambers (ICH Conditions) | To assess the impact of CMAs and CPPs on the stability of CQAs (assay, impurities, dissolution) over time, defining the product lifecycle. |
Within a broader thesis on Quality by Design (QbD) pharmaceutical polymer development, this document details advanced application notes and protocols. QbD principles—systematic, risk-based development—are critical for optimizing complex polymeric drug delivery systems. This content provides actionable methodologies for researchers and drug development professionals.
Application Note: QbD for Amorphous Solid Dispersions (ASDs)
Objective: To design a stable, bioavailable ASD using QbD principles to manage risks of recrystallization and poor dissolution.
Critical Quality Attributes (CQAs): Drug loading, glass transition temperature (Tg), dissolution profile (% released at 30 min), physical stability (no recrystallization after 3 months at 40°C/75% RH).
Critical Material Attributes (CMAs) & Critical Process Parameters (CPPs):
- CMAs: Polymer type (e.g., HPMCAS, PVPVA), polymer:drug ratio, drug logP.
- CPPs: Hot-melt extrusion temperature, screw speed, cooling rate.
Key Findings from Recent Studies (2023-2024):
- A Design of Experiments (DoE) on itraconazole-HPMCAS ASDs identified polymer:drug ratio and extrusion temperature as statistically significant (p<0.01) factors influencing Tg and dissolution.
- Stability studies show ASDs with Tg > 50°C above storage temperature maintain amorphous content >95% for 6 months.
Data Summary Table: ASD Formulation Screening
| Formulation ID | Polymer | Drug:Polymer Ratio | Extrusion Temp (°C) | Tg (°C) | Dissolution @ 30 min (%) | Stability (Amorphous Content at 3 Months) |
|---|---|---|---|---|---|---|
| ASD-01 | HPMCAS-LF | 30:70 | 160 | 115 | 98.5 | 99.2% |
| ASD-02 | HPMCAS-HF | 30:70 | 160 | 120 | 99.1 | 99.5% |
| ASD-03 | PVPVA | 40:60 | 150 | 95 | 95.3 | 97.1% |
| ASD-04 | HPMCAS-LF | 40:60 | 170 | 105 | 85.2 | 94.8% (recrystallization noted) |
Protocol 1: Hot-Melt Extrusion and Characterization of ASDs
- Physical Mixture Preparation: Pre-blend API and polymer (e.g., HPMCAS) in desired ratio using a turbula mixer for 15 minutes.
- Hot-Melt Extrusion: Feed mixture into a twin-screw extruder (e.g., Thermo Fisher Process 11). Set barrel temperature profile based on polymer Tg (typical range: 150-180°C). Set screw speed to 200 rpm. Collect extrudate.
- Milling: Mill the cooled extrudate using a conical mill at 2000 rpm with a 1.0 mm screen.
- Characterization:
- Differential Scanning Calorimetry (DSC): Determine Tg. Hermetically seal 5-10 mg sample. Run from -20°C to 200°C at 10°C/min.
- X-ray Powder Diffraction (XRPD): Confirm amorphous state. Scan from 5° to 40° 2θ.
- Dissolution Testing: Use USP Apparatus II (paddles) in 900 mL phosphate buffer (pH 6.8) with 0.5% SLS at 37°C, 50 rpm. Sample at 10, 20, 30, 45, 60 min.
Application Note: QbD for Controlled-Release Polymeric Matrices
Objective: To develop a zero-order release matrix tablet by understanding the interplay between polymer hydration, erosion, and drug diffusion.
CQAs: Release profile (Q2h, Q8h, Q24h), tablet hardness, swelling index.
CMAs & CPPs:
- CMAs: Polymer viscosity grade (e.g., HPMC K100M), filler type (e.g., lactose vs. MCC), drug solubility.
- CPPs: Compression force, granulation moisture content (if wet granulation used).
Key Findings:
- High-viscosity HPMC grades (K100M) promote erosion-controlled release, while low-viscosity grades (K4M) favor diffusion.
- A recent QbD study on metformin CR tablets established a design space where compression force (10-20 kN) and HPMC content (20-40%) ensure meeting dissolution CQAs.
Data Summary Table: Controlled-Release Formulation DoE Outcomes
| Run No. | HPMC K100M (%) | Compression Force (kN) | Tablet Hardness (kP) | Q8h Release (%) | Release Kinetics R² (Zero-Order) |
|---|---|---|---|---|---|
| 1 | 20 | 10 | 8.2 | 45 | 0.956 |
| 2 | 40 | 10 | 9.5 | 32 | 0.991 |
| 3 | 20 | 20 | 15.1 | 40 | 0.963 |
| 4 | 40 | 20 | 16.8 | 30 | 0.998 |
| Center | 30 | 15 | 12.4 | 35 | 0.985 |
Protocol 2: Wet Granulation and Dissolution of CR Matrix Tablets
- Granulation: Mix drug, HPMC K100M, and lactose monohydrate in a high-shear mixer. Add purified water (20% w/w) as granulating liquid. Dry granules in a fluid bed dryer to LOD <2%.
- Blending & Compression: Blend dry granules with 1% w/w magnesium stearate. Compress on a rotary tablet press to target weight (e.g., 500 mg) and hardness (10-15 kP).
- Dissolution Testing: Use USP Apparatus I (baskets) at 100 rpm in 1000 mL pH 7.4 phosphate buffer at 37°C. Sample at 1, 2, 4, 8, 12, 24 hours. Analyze by HPLC.
Application Note: QbD for Biodegradable Polymeric Implants
Objective: To develop a poly(lactic-co-glycolic acid) (PLGA)-based implant with target drug release over 3 months and predictable erosion profile.
CQAs: Initial burst release (% at 24h), daily release rate (μg/day), complete degradation time (weeks), implant porosity.
CMAs & CPPs:
- CMAs: PLGA lactide:glycolide (L:G) ratio, molecular weight (Mw), end cap (acid vs. ester).
- CPPs: Implant fabrication method (e.g., solvent casting, 3D printing), sintering temperature/time.
Key Findings:
- PLGA 50:50 (acid end) degrades fastest (~4-6 weeks), while PLGA 85:15 (ester end) can provide release >3 months.
- Recent Advance (2024): Microfluidic chip-based screening of PLGA nanoparticles for implant pre-formulation has accelerated QbD by predicting in vivo erosion from in vitro assays.
Data Summary Table: PLGA Implant Formulation Properties
| PLGA Type | L:G Ratio | Mw (kDa) | End Cap | Tg (°C) | In Vitro Degradation (50% Mw loss, weeks) | Typical Release Duration |
|---|---|---|---|---|---|---|
| A | 50:50 | 15 | Acid | 45 | 4-5 | 3-4 weeks |
| B | 65:35 | 45 | Ester | 48 | 12-15 | 1-2 months |
| C | 75:25 | 65 | Ester | 50 | 20-24 | 3-4 months |
| D | 85:15 | 80 | Ester | 53 | 30-36 | 5-6 months |
Protocol 3: Solvent Casting and In Vitro Release for PLGA Implants
- Implant Fabrication: Dissolve PLGA (e.g., 85:15, ester end) and drug in dichloromethane (DCM) at 10% w/v total solids. Pour solution into a Teflon mold. Allow DCM to evaporate slowly under a glass lid for 48h. Vacuum-dry for 72h to remove residual solvent.
- Sterilization: Use gamma irradiation at 25 kGy.
- In Vitro Release: Place implant in 20 mL phosphate buffered saline (PBS, pH 7.4) with 0.02% sodium azide in a sealed vial. Incubate at 37°C under gentle agitation (50 rpm). At predetermined timepoints, replace entire release medium. Analyze for drug content (HPLC) and polymer Mw (GPC).
The Scientist's Toolkit: Key Research Reagent Solutions
| Item | Function & Relevance to QbD |
|---|---|
| HPMCAS (Hypromellose Acetate Succinate) | pH-dependent polymer for ASDs; stabilizes amorphous drug, enables spring-parachute dissolution. CMA in ASD design. |
| PLGA (Poly(D,L-lactide-co-glycolide)) | Biodegradable polyester for implants. L:G ratio and Mw are key CMAs controlling release duration and degradation. |
| HPMC (Hypromellose) K100M | High-viscosity cellulose ether for CR matrices. Controls release via gel layer formation. Viscosity grade is a primary CMA. |
| Hot-Melt Twin-Screw Extruder | Enables continuous, solvent-free manufacture of ASDs. Screw speed, temperature profile are critical CPPs. |
| Microfluidic Screening Platform | High-throughput tool for screening polymer-drug compatibility and nanoparticle formation, enabling rapid QbD screening. |
| In Vitro-In Vivo Correlation (IVIVC) Dissolution Apparatus | Specialized equipment (e.g., flow-through cell) to develop predictive dissolution methods, a key QbD goal for complex systems. |
QbD Workflow for Polymeric Systems
Title: QbD Workflow for Polymer-Based Drug Products
Polymer Selection Logic for ASD
Title: Decision Tree for ASD Polymer Selection
Conclusion
The systematic implementation of Quality by Design in pharmaceutical polymer development transforms excipient selection and processing from an empirical exercise into a science-driven, risk-managed endeavor. By defining a clear QTPP, identifying critical polymer attributes, establishing a robust design space, and implementing a proactive control strategy, developers can achieve enhanced product understanding, improved manufacturing robustness, and greater regulatory flexibility. The future of polymer development lies in the integration of QbD with emerging technologies like AI-driven polymer discovery and continuous manufacturing, paving the way for more predictable, efficient, and patient-centric advanced drug delivery systems. This paradigm shift not only ensures quality but also accelerates the development of complex therapeutic modalities reliant on sophisticated polymeric carriers.