FTIR Spectroscopy: The Essential Guide to Analyzing Functional Groups in Biodegradable Polymers for Biomedical Applications
This comprehensive article provides researchers, scientists, and drug development professionals with an in-depth guide to Fourier-Transform Infrared (FTIR) spectroscopy for characterizing functional groups in biodegradable polymers.
FTIR Spectroscopy: The Essential Guide to Analyzing Functional Groups in Biodegradable Polymers for Biomedical Applications
Abstract
This comprehensive article provides researchers, scientists, and drug development professionals with an in-depth guide to Fourier-Transform Infrared (FTIR) spectroscopy for characterizing functional groups in biodegradable polymers. Covering foundational principles, advanced methodologies, and practical applications, it explores how FTIR serves as a critical tool for verifying polymer chemistry, monitoring degradation processes, ensuring batch-to-batch consistency, and validating material performance in biomedical devices and drug delivery systems. The content addresses both standard protocols and advanced techniques for troubleshooting, optimization, and comparative analysis against other characterization methods.
Understanding the FTIR Fingerprint: Core Principles for Biodegradable Polymer Analysis
Fourier Transform Infrared (FTIR) Spectroscopy is a cornerstone analytical technique for polymer science. Its principle is based on the absorption of infrared radiation by chemical bonds within a material. When IR light passes through a sample, specific functional groups absorb characteristic frequencies, causing molecular vibrations. An interferometer modulates the IR beam, and the resulting interferogram is Fourier-transformed to produce a spectrum plotting absorbance versus wavenumber (cm⁻¹). This spectral fingerprint allows for the identification of functional groups, quantification of components, and investigation of polymer structure, degradation, and interactions. Within the context of research on biodegradable polymers, FTIR is indispensable for tracking the presence and transformation of key functional groups (e.g., esters, ethers, carbonyls, hydroxyls) during synthesis, processing, and degradation.
Application Notes: Monitoring Biodegradable Polymer Hydrolysis
Objective: To quantitatively monitor the hydrolytic degradation of poly(lactic-co-glycolic acid) (PLGA) by tracking the evolution of carbonyl (C=O) and hydroxyl (O-H) bands.
Key Findings from Current Literature (2023-2024): Recent studies emphasize the use of FTIR for real-time, in-situ degradation monitoring. The carbonyl ester peak (~1750 cm⁻¹) decreases relative to emerging carboxylic acid (~1710 cm⁻¹) and hydroxyl (~3450 cm⁻¹) peaks as hydrolysis proceeds. New chemometric models enable more precise quantification of degradation kinetics directly from spectral data.
Table 1: Characteristic FTIR Bands for Common Biodegradable Polymer Functional Groups
| Polymer | Functional Group | Wavenumber Range (cm⁻¹) | Peak Assignment |
|---|---|---|---|
| Polylactic Acid (PLA) | C=O (ester) | 1740-1760 | Carbonyl Stretch |
| C-O (ester) | 1080-1100, 1180-1260 | C-O-C Stretch | |
| Polyglycolic Acid (PGA) | C=O (ester) | 1710-1750 | Carbonyl Stretch |
| O-H (acid) | 2500-3300 (broad) | Hydroxyl Stretch | |
| Polycaprolactone (PCL) | C=O (ester) | 1720-1740 | Carbonyl Stretch |
| C-O (ester) | 1160-1240 | C-O-C Stretch | |
| PLGA | C=O (ester) | 1740-1760 | Carbonyl Stretch |
| C-O (ester) | 1080-1100, 1180-1260 | C-O-C Stretch | |
| Polyhydroxyalkanoates (PHA) | C=O (ester) | 1720-1740 | Carbonyl Stretch |
| CH₃ | 1370-1390 | Methyl Bend |
Table 2: Quantitative Changes in Carbonyl Index During PLGA Hydrolysis (Simulated Data)
| Degradation Time (Weeks) | Carbonyl Index (I₍₁₇₅₀₎/I₍₁₄₅₀₎) | Relative Area of O-H Band (%) | Notes |
|---|---|---|---|
| 0 | 3.45 ± 0.12 | 5.2 ± 0.8 | Initial film |
| 2 | 3.20 ± 0.15 | 12.5 ± 1.2 | Surface erosion begins |
| 4 | 2.78 ± 0.18 | 28.7 ± 2.1 | Bulk erosion evident |
| 8 | 1.95 ± 0.20 | 52.3 ± 3.5 | Significant mass loss |
| 12 | 1.23 ± 0.22 | 78.9 ± 4.0 | Near-complete hydrolysis |
Experimental Protocol: Tracking Ester Hydrolysis in PLGA Films
Protocol 1: Sample Preparation and In-Vitro Degradation Study
Materials:
- PLGA (50:50 Lactide:Glycolide): The biodegradable polymer substrate.
- Dichloromethane (ACS Grade): Solvent for casting thin polymer films.
- Phosphate Buffered Saline (PBS, pH 7.4): Degradation medium simulating physiological conditions.
- Sodium Azide (0.02% w/v): Added to PBS to prevent microbial growth.
- Polished Potassium Bromide (KBr) Windows: For transmission FTIR analysis of degraded films.
- Vacuum Desiccator: For drying films to constant weight.
Procedure:
- Film Casting: Dissolve 500 mg of PLGA in 10 mL of dichloromethane. Pour solution onto a leveled glass Petri dish. Cover loosely and allow solvent to evaporate for 24h. Further dry under vacuum for 48h.
- Baseline FTIR: Cut a 1 cm x 1 cm piece from the cast film. Acquire FTIR spectrum in ATR mode (64 scans, 4 cm⁻¹ resolution). Record the initial carbonyl (C=O) and reference (e.g., C-H at ~1450 cm⁻¹) peak intensities.
- Degradation Setup: Weigh remaining films (W₀). Immerse individual films in 20 mL of PBS (with 0.02% sodium azide) in sealed vials. Incubate at 37°C under gentle agitation (60 rpm).
- Sampling: At predetermined intervals (e.g., 0, 2, 4, 8, 12 weeks), remove triplicate samples. Rinse thoroughly with deionized water and dry to constant weight in a vacuum desiccator (Wₜ).
- FTIR Analysis: Place the dried, degraded film directly on the ATR crystal. Acquire spectrum using identical instrument settings as baseline.
- Data Processing: Calculate the Carbonyl Index as the ratio of the peak height or area of the ester C=O band (~1750 cm⁻¹) to that of an internal reference band (C-H bend at ~1450 cm⁻¹). Plot CI versus degradation time.
Protocol 2: Attenuated Total Reflectance (ATR)-FTIR Mapping of Heterogeneous Degradation
Objective: To visualize spatial chemical changes across a degrading polymer scaffold.
Procedure:
- Sample: Prepare a porous PLGA scaffold via salt leaching.
- Degradation: Subject scaffold to PBS medium for a set period.
- Mapping: Mount a cross-section of the wet or dried scaffold on the ATR stage.
- Acquisition: Define a grid (e.g., 50 x 50 µm step size). At each point, collect a full FTIR spectrum.
- Analysis: Use software to generate chemical maps based on the distribution of key functional groups (e.g., ester C=O vs. acid O-H).
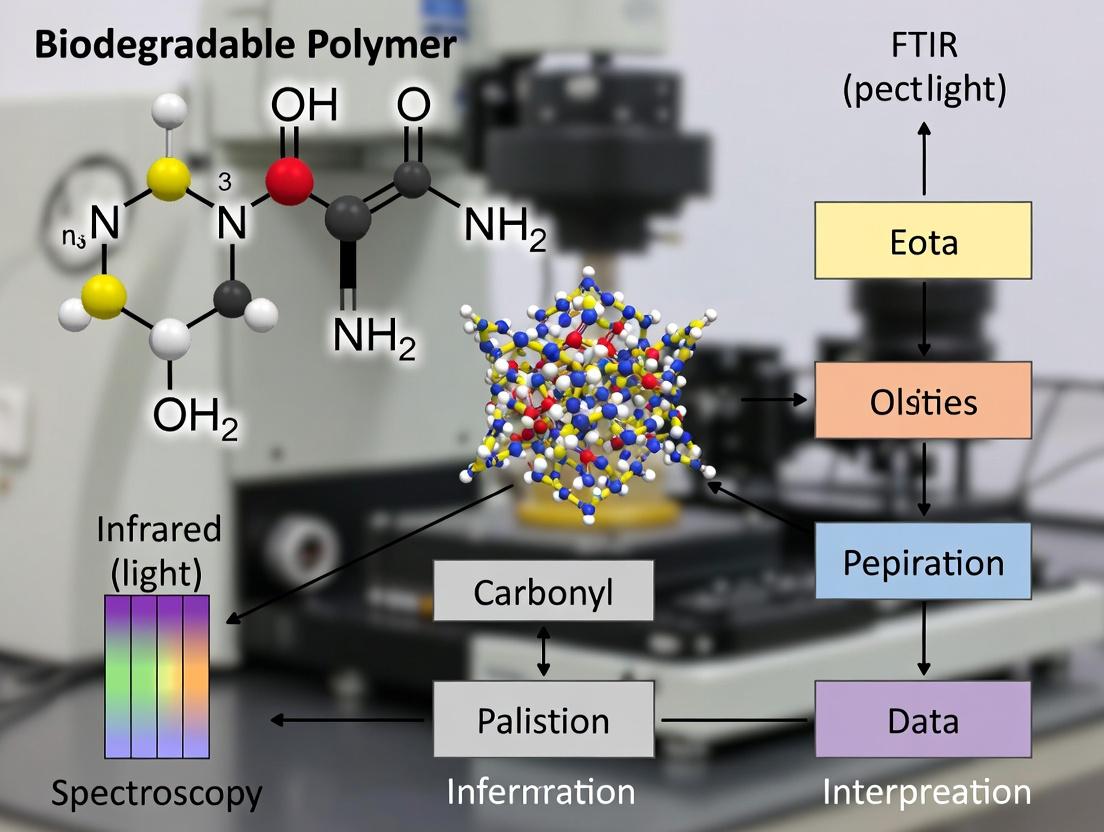
Title: FTIR Workflow for Polymer Degradation Analysis
Title: FTIR Instrument Principle and Data Flow
The Scientist's Toolkit: Key Research Reagent Solutions
Table 3: Essential Materials for FTIR Analysis of Biodegradable Polymers
| Item | Function in Research | Key Consideration for Biodegradable Polymers |
|---|---|---|
| ATR Crystal (Diamond/ZnSe) | Enables direct, non-destructive analysis of solid samples without preparation. | Chemically inert; essential for analyzing wet/degrading samples and mapping. |
| High-Purity Potassium Bromide (KBr) | For preparing pellets for transmission FTIR of powders or micro-samples. | Must be thoroughly dried to avoid interference from O-H in water. |
| Deuterated Triglycine Sulfate (DTGS) Detector | Standard mid-IR detector for routine analysis. | Suitable for stability in quantifying gradual changes over long-term studies. |
| Mercury Cadmium Telluride (MCT) Detector | High-sensitivity, cooled detector for rapid scanning or mapping. | Essential for high-resolution ATR mapping of degradation gradients. |
| ATR-FTIR Flow Cell | Allows in-situ, real-time monitoring of polymer-solution interactions. | Ideal for tracking hydrolysis kinetics without removing sample from medium. |
| Spectroscopic Software with Chemometrics | For spectral processing, baseline correction, peak fitting, and multivariate analysis. | Required for deconvoluting overlapping bands (e.g., ester vs. acid C=O). |
| Calibrated Thickness Gauge | To ensure consistent film thickness for quantitative transmission studies. | Critical for accurate comparison of absolute absorbance values between samples. |
Within the broader thesis on FTIR spectroscopy for biodegradable polymer functional groups research, this application note details the characteristic infrared absorption bands of major hydrolytically and enzymatically degradable polymers. Identifying these signatures is critical for researchers and drug development professionals to verify polymer composition, assess purity, monitor degradation, and ensure batch-to-batch consistency in applications ranging from medical devices to controlled-release matrices.
FTIR Spectral Signatures: Key Functional Groups and Band Assignments
The following table consolidates the primary FTIR absorption bands for the most common biodegradable polyesters, based on current spectroscopic literature.
Table 1: Characteristic FTIR Absorption Bands of Common Biodegradable Polyesters
| Polymer | Full Name | Key Functional Group | Characteristic FTIR Bands (cm⁻¹) & Assignments |
|---|---|---|---|
| PLA | Poly(lactic acid) | Aliphatic ester, -CH₃ | 1740-1760 (C=O stretch, ester), 1180-1210 & 1080-1130 (C-O-C stretch), 1360-1380 & 1450-1470 (CH bend, -CH₃), 2950-3000 (CH stretch) |
| PGA | Poly(glycolic acid) | Aliphatic ester (no side chain) | 1740-1760 (C=O stretch, ester), 1140-1190 & 1080-1130 (C-O-C stretch, strong), ~1420 (CH₂ bend) |
| PCL | Poly(ε-caprolactone) | Aliphatic ester, -(CH₂)₅- | 1720-1740 (C=O stretch, ester), 1160-1240 (C-O-C stretch, asymmetric), 1290-1320 (C-O & C-C stretch), 2865 & 2945 (CH₂ stretch) |
| PHB | Poly(3-hydroxybutyrate) | Aliphatic ester, -CH₃ | 1720-1740 (C=O stretch, ester), 1275-1280 (CH bend), 1225-1235 (C-O-C stretch), 1375-1380 (CH₃, symmetric bend), 2975-2980 (CH₃ stretch) |
| PLGA | Poly(lactic-co-glycolic acid) | Aliphatic ester copolymer | 1740-1760 (C=O stretch, ester). Band positions and relative intensities shift predictably with LA:GA ratio; e.g., ~1420 cm⁻¹ (GA) & ~1380 cm⁻¹ (LA) bends used for composition analysis. |
Experimental Protocols
Protocol 1: FTIR Sample Preparation and Analysis of Bulk Biodegradable Polymers
Objective: To obtain a high-quality FTIR spectrum for the identification of functional groups in a solid, non-water-soluble biodegradable polymer sample (e.g., PLA, PCL pellets or film).
Materials: See "The Scientist's Toolkit" below. Procedure:
- Sample Preparation (KBr Pellet Method): a. Dry approximately 1-2 mg of the polymer sample in a vacuum oven at 40°C for 24 hours to remove residual moisture. b. Mix the dried polymer with 100-200 mg of pre-dried, spectroscopic-grade potassium bromide (KBr) in an agate mortar. c. Grind the mixture thoroughly for 2-3 minutes to create a fine, homogeneous powder with particle sizes < 2 µm to reduce scattering. d. Transfer the mixture to a pellet die set (13 mm diameter). Apply a pressure of 8-10 tons under vacuum for 2-3 minutes to form a transparent pellet.
- Instrument Setup: a. Initialize the FTIR spectrometer and allow the source and detector to stabilize for 15 minutes. b. Collect a background spectrum using a pure KBr pellet under identical conditions (resolution, scans). c. Set parameters: Resolution = 4 cm⁻¹, Number of scans = 64, Spectral range = 4000-400 cm⁻¹.
- Data Acquisition: a. Place the sample pellet in the holder. b. Acquire the sample spectrum. c. Use the instrument software to convert the raw interferogram to an absorbance spectrum, subtracting the background.
- Data Analysis: a. Identify the dominant carbonyl (C=O) stretching band (~1720-1760 cm⁻¹). b. Examine the fingerprint region (1500-900 cm⁻¹) for C-O-C stretches and other polymer-specific bands. c. Compare peak positions and relative intensities to reference spectra (e.g., Table 1) for polymer identification.
Protocol 2: MonitoringIn VitroHydrolytic Degradation by FTIR
Objective: To track changes in ester bond concentration and polymer backbone integrity during hydrolytic degradation.
Materials: Polymer film samples, phosphate-buffered saline (PBS, pH 7.4), incubation oven, vacuum desiccator. Procedure:
- Initial Characterization: Record the FTIR spectrum (using Protocol 1 or ATR-FTIR) of the pristine polymer film (Day 0).
- Degradation Study: a. Submerge pre-weighed polymer films (n=3) in PBS (10 mL per film) in sealed vials. b. Incubate vials at 37°C under constant agitation (e.g., 60 rpm). c. At predetermined time points (e.g., 1, 7, 14, 28 days), remove a sample vial.
- Post-Degradation Analysis: a. Rinse the retrieved film with deionized water and dry to constant weight in a vacuum desiccator. b. Record the FTIR spectrum of the dried, degraded film. c. Monitor changes in: i) The intensity of the ester C=O stretch (~1740 cm⁻¹) relative to an internal reference band (e.g., C-H stretch at ~2950 cm⁻¹). A decrease indicates ester bond cleavage. ii) The appearance of new broad bands in the 3200-3600 cm⁻¹ (O-H stretch) and 1600-1650 cm⁻¹ (carboxylate C=O stretch) regions, indicating formation of carboxylic acid end groups.
- Data Interpretation: Plot the normalized carbonyl index (AC=O / Aref) against degradation time. A downward trend confirms hydrolytic degradation of the ester backbone.
Diagram Title: In Vitro Polymer Degradation FTIR Workflow
The Scientist's Toolkit
Table 2: Essential Research Reagents and Materials for FTIR Analysis of Biodegradable Polymers
| Item | Function/Benefit |
|---|---|
| FTIR Spectrometer | Core instrument for measuring infrared absorption. Equipped with DTGS or MCT detector for high sensitivity. |
| Attenuated Total Reflectance (ATR) Accessory | Enables direct, non-destructive analysis of solid films and surfaces without extensive sample prep. |
| Potassium Bromide (KBr), Spectroscopy Grade | Hygroscopic salt used to create transparent pellets for transmission FTIR; IR transparent in mid-IR range. |
| Hydraulic Pellet Press & Die Set | Applies high pressure to KBr/powder mixtures to form pellets for transmission measurements. |
| Vacuum Oven/Desiccator | Removes absorbed water from polymers and KBr, preventing spectral interference from O-H bands (~3300 cm⁻¹). |
| Agate Mortar and Pestle | For grinding polymer samples without introducing IR-active contaminants. |
| Spectrum Database Software (e.g., KnowItAll, OMNIC) | Contains libraries of reference spectra for polymer identification and comparison. |
Within the context of FTIR spectroscopy for biodegradable polymer functional groups research, precise interpretation of the mid-infrared spectrum is paramount. The spectrum is conventionally divided into two critical regions: the Functional Group Region (1500-4000 cm⁻¹), where key stretching vibrations provide direct evidence of specific functional groups, and the Fingerprint Region (400-1500 cm⁻¹), characterized by complex, unique patterns resulting from skeletal vibrations and bending modes. This guide details the application of these regions for characterizing polymers like poly(lactic acid) (PLA), poly(ε-caprolactone) (PCL), and polyhydroxyalkanoates (PHAs).
Core Spectral Regions: Quantitative Band Assignments
The following tables summarize characteristic absorption bands for common biodegradable polymers and their functional groups.
Table 1: Functional Group Region (1500-4000 cm⁻¹) - Key Assignments
| Wavenumber Range (cm⁻¹) | Vibrational Mode | Functional Group / Polymer Assignment | Example Polymer |
|---|---|---|---|
| 3200-3600 (broad) | O-H stretching | Hydroxyl end groups, absorbed water | PLA, PHA |
| 2800-3000 | C-H stretching (asym/sym) | Methylene (CH₂), Methine (CH) | All aliphatic polyesters |
| ~1720-1750 | C=O stretching | Ester carbonyl | PLA (~1750), PCL (~1720) |
| 1640-1670 | C=O stretching (conjugated) | Amide I (in proteins) | Protein-based polymers |
| 1500-1600 | N-H bending, C-N stretching | Amide II | Protein-based polymers |
Table 2: Fingerprint Region (400-1500 cm⁻¹) - Key Assignments for Polymer Identification
| Wavenumber Range (cm⁻¹) | Vibrational Mode | Polymer-Specific Assignment |
|---|---|---|
| 1450-1470 | CH₂ bending | Crystallinity indicator |
| 1360-1390 | CH bending (sym) | -CH₃ in PLA |
| 1300-1000 | C-O-C stretching | Ester linkage asymmetry (strong in PLA: ~1180, 1090 cm⁻¹) |
| ~960-920 | C-C backbone stretching, CH rocking | Polymer crystallinity phase (e.g., α vs. β forms) |
| 400-800 | Skeletal vibrations, ring deformations | Unique polymer "fingerprint" |
Experimental Protocols
Protocol 1: Sample Preparation for Biodegradable Polymer FTIR Analysis
Objective: To obtain a high-quality FTIR spectrum of a biodegradable polymer film with minimal interference. Materials: Hydraulic press, temperature controller, KBr pellets (if applicable), polymer granules, solvent (e.g., chloroform for solution casting). Procedure:
- Hot Press Film Method (Preferred for Thermoplastics): a. Place 5-10 mg of polymer granules between two polished stainless steel plates lined with Teflon sheets. b. Use a hydraulic press to apply 2-5 metric tons of pressure. c. Heat plates to 20°C above the polymer's glass transition (Tg) or melting point (Tm) (e.g., 180°C for PLA) for 2 minutes. d. Apply pressure for 1 minute, then cool rapidly under pressure to create a thin, uniform film.
- Solution Casting Method (For soluble polymers): a. Dissolve 0.5% w/v of polymer in a suitable volatile solvent (e.g., chloroform for PCL). b. Pipette the solution onto a clean, infrared-transparent window (e.g., KBr or NaCl). c. Allow solvent to evaporate fully under a fume hood, forming a thin film.
- Mount the prepared film directly in the FTIR spectrometer sample holder.
Protocol 2: Spectral Acquisition and Baseline Correction
Objective: To acquire a reproducible spectrum and correct for light scattering effects. Procedure:
- Purge the spectrometer with dry, CO₂-free nitrogen for at least 5 minutes to minimize atmospheric water vapor and CO₂ bands.
- Collect a background spectrum with an empty sample holder.
- Insert the prepared polymer film and collect the sample spectrum. Use 32 scans at a resolution of 4 cm⁻¹ for optimal signal-to-noise ratio.
- Perform baseline correction using instrument software (e.g., concave rubber-band correction or linear points method between 4000 and 500 cm⁻¹).
- Apply atmospheric suppression algorithms to remove residual H₂O/CO₂ peaks if necessary.
Protocol 3: Monitoring Hydrolytic Degradation via FTIR
Objective: To track the hydrolysis of ester linkages in a biodegradable polymer over time. Procedure:
- Prepare identical polymer films (Protocol 1). Weigh each film accurately (initial mass, m₀).
- Immerse films in phosphate-buffered saline (PBS, pH 7.4) at 37°C in sealed vials.
- At predetermined time points (e.g., 1, 7, 14, 28 days), remove a sample, rinse with deionized water, and dry to constant weight in a vacuum desiccator (record dry mass, mₜ).
- Acquire FTIR spectra of the dried film following Protocol 2.
- Data Analysis:
a. Calculate mass loss:
% Mass Loss = [(m₀ - mₜ) / m₀] * 100. b. Track changes in the C=O stretching band (~1720-1750 cm⁻¹): peak broadening or shifting indicates changes in the ester environment. c. Monitor the C-O-C stretching region (~1300-1000 cm⁻¹) for intensity reduction, indicating bond scission. d. Observe the O-H stretching region (3200-3600 cm⁻¹) for an increase in intensity, signifying the formation of carboxylic acid and alcohol end groups from hydrolysis.
Visualizing FTIR Analysis Workflow
FTIR Workflow for Polymer Analysis
The Scientist's Toolkit: Essential Research Reagent Solutions
Table 3: Key Materials for FTIR Analysis of Biodegradable Polymers
| Item | Function in Research | Example/Note |
|---|---|---|
| FTIR Spectrometer | Core instrument for measuring infrared absorption. | Must have DTGS or MCT detector, resolution ≤4 cm⁻¹. |
| Hydraulic Hot Press | Prepares uniform, thin polymer films for transmission mode. | Temperature range up to 300°C, 10-ton capacity. |
| Infrared-Transparent Windows | Substrate for film preparation or for liquid analysis. | KBr, NaCl, or ZnSe. KBr is hygroscopic; store desiccated. |
| Spectroscopic Grade Solvents | For solution casting or cleaning. | Chloroform, Tetrahydrofuran (THF), dried and stabilizer-free. |
| Atmospheric Purge Gas | Removes H₂O and CO₂ vapor from the optical path. | Dry, CO₂-scrubbed Nitrogen supply. |
| Polystyrene Film Standard | Validates instrument wavenumber accuracy and resolution. | Certified reference material (e.g., NIST SRM 1921). |
| pH-Buffered Saline Solution | Hydrolytic degradation medium. | Phosphate Buffered Saline (PBS, pH 7.4) at 37°C. |
| ATR Accessory (Diamond/ZnSe) | Enables direct analysis of solids, gels, without film prep. | Essential for surface analysis and rapid screening. |
The Role of FTIR in Confirming Polymer Synthesis, Identity, and Chemical Structure.
Within the context of a broader thesis on FTIR spectroscopy for biodegradable polymer functional groups research, Fourier Transform Infrared (FTIR) spectroscopy is an indispensable analytical tool. It provides a molecular fingerprint, enabling researchers to confirm successful polymerization, verify polymer identity against standards, and elucidate detailed chemical structure, including the presence of characteristic functional groups in biodegradable polymers like poly(lactic acid) (PLA), poly(glycolic acid) (PGA), and poly(ε-caprolactone) (PCL). This technique is non-destructive, requires minimal sample preparation, and yields rapid results critical for research and development timelines.
Application Notes
Confirmation of Polymer Synthesis (Polymerization)
FTIR is used to monitor the disappearance of monomer-specific peaks and the emergence of polymer-specific bonds. For instance, in the ring-opening polymerization (ROP) of ε-caprolactone to PCL, the disappearance of the monomer's carbonyl peak at ~1730 cm⁻¹? and the appearance of the ester C-O-C stretch at ~1160 cm⁻¹? in the polymer confirm conversion.
Table 1: Key FTIR Bands for Monitoring Biodegradable Polymer Synthesis
| Polymerization Reaction | Monomer Key Band (cm⁻¹) | Polymer Key Band (cm⁻¹) | Functional Group Change |
|---|---|---|---|
| ε-Caprolactone → PCL | C=O: ~1730 (sharp) | C-O-C: ~1160 (strong) | Lactone → Aliphatic Ester |
| Lactide → PLA | C=O: ~1750 (sharp) | C-O-C: ~1085, 1130 | Lactide → Aliphatic Ester |
| Glycolide → PGA | C=O: ~1770 (sharp) | C-O-C: ~1145 | Glycolide → Aliphatic Ester |
| Condensation (e.g., Diacid + Diol) | -COOH: ~1710 (broad), -OH: ~2500-3500 (broad) | Ester C=O: ~1735-1740, loss of -OH broad band | Acid/OH → Ester Linkage |
Verification of Polymer Identity and Purity
Comparing the FTIR spectrum of a synthesized polymer to a reference spectrum from a certified standard library is a primary identity test. Contaminants or residual solvents are identified by unexpected peaks.
Table 2: Characteristic FTIR Absorbance Ranges for Common Biodegradable Polymers
| Polymer | Key Functional Groups | Characteristic FTIR Absorbance (cm⁻¹) |
|---|---|---|
| PLA | Ester C=O, C-O-C | C=O: 1740-1760, C-O-C: 1085-1130, -CH3: ~1450, ~1380 |
| PGA | Ester C=O, C-O-C | C=O: ~1740-1760, C-O-C: ~1145, -CH2-: ~1420, ~2940 |
| PCL | Aliphatic Ester C=O, C-O-C | C=O: ~1720, C-O-C: ~1160, -CH2-: ~2865, 2945 |
| PHB | Ester C=O, -CH3 | C=O: ~1720, -CH3: ~1380, -CH: ~2980 |
Elucidation of Chemical Structure and Functional Groups
FTIR helps identify specific functional groups introduced via copolymerization or surface modification. For example, adding hydrophilic PEG blocks to PCL introduces a broad -OH stretch (~3400 cm⁻¹) and strong C-O-C ether stretches (~1100 cm⁻¹).
Experimental Protocols
Protocol 1: FTIR Analysis of Synthesized PCL for Conversion Verification
Objective: To confirm the successful ring-opening polymerization of ε-caprolactone to poly(ε-caprolactone) and estimate monomer conversion. Materials: See "The Scientist's Toolkit" below. Method:
- Sample Preparation (KBr Pellet Method): a. Dry approximately 1 mg of the purified synthesized polymer in a vacuum oven at 40°C overnight. b. Mix the dried polymer with approximately 200 mg of spectroscopic-grade potassium bromide (KBr) in an agate mortar. Grind thoroughly to a fine, homogeneous powder. c. Transfer the mixture to a pellet die. Apply a pressure of 8-10 tons under vacuum for 2-3 minutes to form a clear, transparent pellet.
- Background Scan: Place a pure KBr pellet in the FTIR spectrometer sample holder. Acquire a background spectrum across 4000-400 cm⁻¹ with 32 scans and 4 cm⁻¹ resolution.
- Sample Scan: Replace the background pellet with the sample-containing KBr pellet. Acquire the sample spectrum using identical parameters.
- Data Analysis: a. Examine the spectrum for the characteristic strong ester carbonyl stretch at ~1720 cm⁻¹. b. Check for the presence of the C-O-C asymmetric stretch at ~1240 cm⁻¹ and symmetric stretch at ~1160 cm⁻¹. c. Critical: Inspect the region around ~1730 cm⁻¹ for a sharp shoulder or peak, which may indicate residual ε-caprolactone monomer. Use peak deconvolution software if necessary. d. Calculate approximate monomer conversion using the peak height ratio of the monomer carbonyl (if detectable) to a stable polymer methylene peak (e.g., ~2945 cm⁻¹) compared to a calibration curve from standard mixtures.
Protocol 2: Identity Verification and Contaminant Screening for PLA
Objective: To verify the identity of a synthesized PLA sample and check for residual catalyst or solvent. Materials: As in Protocol 1, plus ATR accessory if available. Method (ATR-FTIR for Rapid Screening):
- ATR Crystal Cleaning: Clean the ATR crystal (e.g., diamond) with isopropanol and lint-free wipes. Perform a background scan with the clean crystal in place.
- Sample Application: Place a small, solid piece of the PLA sample directly onto the ATR crystal. Use the pressure clamp to ensure firm, uniform contact.
- Spectral Acquisition: Acquire the spectrum from 4000-650 cm⁻¹ with 32 scans at 4 cm⁻¹ resolution.
- Data Analysis: a. Overlay the obtained spectrum with a reference spectrum of standard PLA from a database (e.g., Hummel Polymer Library). b. Perform a correlation analysis or directly compare peak positions and relative intensities of key bands: C=O (~1750 cm⁻¹), -CH3 (~1450, ~1380 cm⁻¹), and C-O-C (~1085, ~1130 cm⁻¹). c. Screen for contaminants: Look for broad -OH stretches (~3400 cm⁻¹) from moisture, sharp peaks from residual solvent (e.g., chloroform at ~760 cm⁻¹), or peaks from tin-based catalysts (broad bands below 700 cm⁻¹).
Visualizations
Title: FTIR Analysis Workflow for Polymers
Title: FTIR Peaks to Polymer Structure Logic
The Scientist's Toolkit: Key Research Reagent Solutions & Materials
| Item | Function in FTIR Polymer Analysis |
|---|---|
| FTIR Spectrometer | Core instrument for measuring infrared absorption spectra. Equipped with DTGS or MCT detectors. |
| ATR Accessory (Diamond/ZnSe) | Enables direct, non-destructive analysis of solid and liquid samples without extensive preparation. |
| Potassium Bromide (KBr), Spectroscopy Grade | Hygroscopic salt used to create transparent pellets for transmission FTIR analysis of solid samples. |
| Hydraulic Pellet Press & Die | Applies high pressure to KBr/powder mixtures to form pellets for transmission measurement. |
| Agate Mortar and Pestle | For grinding and homogenizing polymer samples with KBr to ensure uniform pellet clarity. |
| Vacuum Oven | For drying polymer samples and KBr to remove absorbed water, which creates interfering -OH peaks. |
| Reference Polymer Libraries (Digital) | Databases of known polymer spectra (e.g., Hummel, Sadler) essential for identity verification. |
| Spectral Analysis Software | Software for peak picking, baseline correction, deconvolution, and quantitative analysis (e.g., Omnic, Spectrum, OPUS). |
| Certified Polymer Standards (PLA, PCL, PGA) | High-purity materials for generating in-house reference spectra and calibration curves. |
| Lint-Free Wipes & HPLC-Grade Solvents (e.g., IPA) | For cleaning ATR crystals and accessories to prevent cross-contamination between samples. |
Within the broader thesis on applying Fourier-Transform Infrared (FTIR) spectroscopy to characterize functional groups in biodegradable polymers, the construction of a robust, in-house spectral library is a foundational step. Such a library serves as a critical reference for identifying unknown materials, quantifying components in blends, and monitoring degradation-induced chemical changes. This protocol details the standardized methodology for acquiring, processing, and cataloging reference spectra for common biodegradable polymers, ensuring consistency and reproducibility for researchers, scientists, and drug development professionals working in biomaterials and controlled release formulations.
Core Polymers for Initial Library Construction
The following table summarizes the key standard biodegradable polymers recommended for the inaugural library build, along with their characteristic IR bands.
Table 1: Standard Biodegradable Polymers and Key FTIR Absorbance Bands
| Polymer Name (Abbreviation) | Characteristic FTIR Bands (cm⁻¹) | Primary Functional Groups |
|---|---|---|
| Poly(lactic acid) (PLA) | ~1750 (C=O stretch), ~1180-1080 (C-O stretch) | Ester |
| Poly(glycolic acid) (PGA) | ~1750 (C=O stretch), ~1145 (C-O stretch) | Ester |
| Poly(lactic-co-glycolic acid) (PLGA) | ~1750 (C=O stretch), ~1180-1080 (C-O blend) | Ester |
| Poly(ε-caprolactone) (PCL) | ~1720 (C=O stretch), ~1295-1240 (C-O-C stretch) | Aliphatic Ester |
| Polyhydroxyalkanoates (PHA), e.g., PHB | ~1725 (C=O stretch), ~1280-1225 (C-O stretch) | Ester |
| Poly(butylene succinate) (PBS) | ~1715 (C=O stretch), ~1150 (C-O stretch) | Ester |
| Chitosan | ~1650 (Amide I), ~1590 (N-H bend), ~1070 (C-O-C stretch) | Amine, Ether |
| Cellulose Acetate | ~1745 (C=O ester), ~1235 (C-O stretch), ~1370 (CH₃) | Ester, Hydroxyl |
Detailed Experimental Protocol for Spectral Acquisition
1. Sample Preparation Protocols
A. Film Casting (for soluble polymers)
- Materials: Analytical balance, glass vial, volatile solvent (e.g., chloroform for PLGA, PCL; acetone for some PHAs), glass slide or potassium bromide (KBr) window, fume hood.
- Procedure:
- Prepare a 2-5% (w/v) polymer solution in a suitable, high-purity solvent.
- Using a pipette, deposit a few drops onto a clean, polished KBr window or glass slide.
- Allow the solvent to evaporate slowly under a covered dish to form a uniform, thin film.
- For complete solvent removal, dry the film under vacuum for a minimum of 24 hours.
B. Potassium Bromide (KBr) Pellet Method (for solid powders)
- Materials: Hydraulic press, KBr powder (FTIR grade), agate mortar and pestle, vacuum die.
- Procedure:
- Dry approximately 1 mg of polymer powder and 100 mg of KBr at 60°C for 1 hour to remove moisture.
- Mix thoroughly using an agate mortar and pestle.
- Transfer the mixture to a vacuum die and apply a pressure of 8-10 tons for 2-3 minutes under vacuum to form a clear, translucent pellet.
C. Attenuated Total Reflectance (ATR) Method (for bulk/solid samples)*
- Materials: ATR-FTIR spectrometer with diamond or ZnSe crystal, torque stand, cleaning supplies (isopropanol, lint-free wipes).
- Procedure:
- Clean the ATR crystal thoroughly with isopropanol and allow it to dry.
- Place a small piece of the solid polymer directly onto the crystal.
- Using the torque stand, apply consistent, firm pressure to ensure optimal contact between the sample and the crystal.
- Acquire the spectrum.
2. FTIR Instrumentation & Data Acquisition Parameters
- Instrument: FTIR Spectrometer with DTGS detector.
- Mode: Transmission (for films/pellets) or ATR.
- Spectral Range: 4000 - 650 cm⁻¹.
- Resolution: 4 cm⁻¹.
- Scans per Spectrum: 64 for background, 64 for sample.
- Apodization: Happ-Genzel.
- Note: For ATR measurements, apply the instrument-specific correction algorithm to compensate for the depth-of-penetration effect and generate spectra comparable to transmission libraries.
3. Spectral Processing & Library Entry Creation
- Background Subtraction: Always subtract a background spectrum (acquired under identical conditions without the sample).
- ATR Correction (if applicable): Apply the corrected for penetration depth.
- Baseline Correction: Use a concave rubber-band or linear method to correct baseline drift.
- Normalization: Normalize all spectra to the intensity of their most intense band (e.g., C=O stretch at ~1750 cm⁻¹) to enable comparative analysis.
- Metadata Tagging: Each library entry must include: Polymer name, abbreviation, supplier, lot number, molecular weight, sample preparation method, acquisition date, operator, and instrument ID.
Visualization of Workflow and Spectral Analysis Logic
FTIR Spectral Library Construction Workflow
Spectral Matching for Polymer ID & Degradation Analysis
The Scientist's Toolkit: Essential Research Reagent Solutions
Table 2: Key Materials and Reagents for FTIR Spectral Library Construction
| Item | Function/Benefit |
|---|---|
| FTIR-Grade Potassium Bromide (KBr) | Hygroscopic salt used to create transparent pellets for transmission analysis of powder samples. |
| Polished KBr Windows | Inert substrates for casting thin polymer films for transmission FTIR. |
| High-Purity Solvents (Chloroform, Acetone, HFIP) | For dissolving polymers to create uniform thin films without residue interference. |
| ATR Crystal Cleaner Kit (Isopropanol, Lint-Free Wipes) | Ensures crystal cleanliness to prevent spectral contamination between samples. |
| Hydraulic Pellet Press with Vacuum Die | Creates uniform, clear KBr pellets for reproducible transmission measurements. |
| Certified Reference Polymer Standards (e.g., PLA, PCL, PLGA) | Provides known, high-purity materials to build the core reference library. |
| Background Reference Materials (e.g., Dried Air, Empty ATR) | Essential for collecting the background spectrum to correct for instrument/environment. |
| Vacuum Oven | For complete removal of residual solvent and moisture from samples prior to analysis. |
Practical Protocols: From Sample Prep to Advanced FTIR Techniques in Biomaterial Science
Within the research for a thesis on FTIR spectroscopy of biodegradable polymer functional groups, sample preparation is the critical determinant of spectral quality and interpretability. The choice between transmission (cast films, KBr pellets) and reflectance (ATR) techniques dictates the information depth, sensitivity to specific functional groups (e.g., ester C=O in PLGA, hydroxyls in PVA), and suitability for polymer physical state. This note details best-practice protocols for these three core methods, emphasizing their application in biodegradable polymer analysis for drug delivery systems and environmental science.
Methodologies & Protocols
Solvent-Cast Film Preparation for Transmission FTIR
This method is ideal for soluble, film-forming biodegradable polymers (e.g., PCL, PLA, PLGA) and provides excellent spectra for quantitative analysis of bulk composition.
Protocol:
- Dissolution: Precisely weigh 0.1-0.5 g of polymer sample. Dissolve completely in 5-10 mL of a suitable volatile, spectroscopic-grade solvent (e.g., chloroform for aliphatic polyesters, acetone for some PHAs) in a sealed vial with stirring. Ensure complete dissolution.
- Casting: Using a pipette, evenly spread the solution onto a clean, level infrared-transparent substrate (e.g., polished NaCl or KBr window, or a disposable PTFE sheet). For reproducible thickness, use a calibrated casting knife.
- Drying: Cover loosely to allow slow, uniform solvent evaporation (ambient or in a vacuum desiccator). Rapid drying can cause cloudiness or crystallization.
- Final Drying: Place the film in a vacuum oven at a temperature below the polymer's glass transition temperature (Tg) for 12-24 hours to remove residual solvent, evidenced by the absence of solvent peaks in the FTIR spectrum.
- Mounting: Carefully peel the free-standing film and mount it in a standard transmission holder. For films cast directly on windows, analyze in situ.
KBr Pellet Preparation for Transmission FTIR
Best suited for powdered or insoluble biodegradable polymer samples, or for blending with other powdered components (e.g., drugs, fillers).
Protocol:
- Drying: Dry polymer powder and spectroscopic-grade KBr powder separately at 105°C for 1-2 hours to minimize water interference.
- Grinding & Mixing: Mix 1-2 mg of dried polymer with 100-200 mg of dried KBr (a 1:100 ratio is typical). Grind thoroughly in an agate mortar or a vibratory mill (e.g., Wig-L-Bug) for 1-2 minutes to a homogeneous, sub-micron dispersion.
- Pellet Formation: Transfer the mixture to a 13 mm pellet die. Apply a pressure of 8-10 tons/cm² (e.g., ~10 metric tons for a 13 mm die) under vacuum for 2-3 minutes. Vacuum is crucial to remove air and minimize scattering.
- Handling: Remove the clear pellet carefully. Store in a desiccator if not analyzed immediately. Always handle with gloves to avoid moisture and fingerprint contamination.
Attenuated Total Reflectance (ATR) Method
The most common modern technique for direct analysis of solid biodegradable polymer surfaces, gels, or viscous liquids with minimal preparation. Ideal for monitoring surface hydrolysis or drug distribution.
Protocol:
- Sample Requirement: A flat, clean sample surface (≥ 3x the ATR crystal area) that makes intimate optical contact with the ATR crystal.
- Crystal Selection: Choose crystal based on sample hardness and pH. Diamond is universal and robust; ZnSe is for softer materials; Ge provides high surface selectivity.
- Sample Presentation: For films/rigid sheets, place the sample directly onto the crystal and clamp firmly using the uniform pressure tower. For powders, compress into a fine, flat layer against the crystal. For gels/liquids, apply directly.
- Data Acquisition: Ensure good crystal contact (check via interferogram quality). Collect spectra (typically 16-64 scans at 4 cm⁻¹ resolution). Apply the appropriate ATR correction algorithm (based on crystal material and incidence angle) to all spectra for valid comparison to transmission libraries.
Table 1: Comparative Analysis of FTIR Sample Preparation Methods for Biodegradable Polymers
| Parameter | Cast Film Transmission | KBr Pellet Transmission | ATR (Diamond Crystal) |
|---|---|---|---|
| Typical Sample Amount | 10-50 mg (for film) | 1-2 mg | 1-100 mg (surface only) |
| Preparation Time | High (Hours to Days) | Medium (30-60 mins) | Low (< 5 mins) |
| Primary Skill Requirement | High (solvent choice, casting) | Medium (grinding, pressing) | Low |
| Spectral Quality | Excellent, sharp bands | Very Good, can have scattering | Good, bands at lower wavenumbers attenuated |
| Information Depth | Bulk (µm to mm thickness) | Bulk (powder composite) | Surface (0.5 - 5 µm) |
| Best for Polymer Form | Soluble, film-forming | Powders, insoluble solids | All solids, gels, pastes |
| Key Artifact Risks | Residual solvent peaks, thickness fringes | Moisture, inhomogeneous dispersion, scattering | Pressure-sensitive bands, poor contact |
| Quantitative Suitability | Excellent (controlled pathlength) | Good (consistent dilution) | Good (with careful correction) |
Experimental Workflow Visualization
Diagram Title: FTIR Sample Prep Workflow for Biodegradable Polymers
The Scientist's Toolkit
Table 2: Essential Research Reagents & Materials for FTIR Polymer Prep
| Item | Function & Relevance |
|---|---|
| Spectroscopic-Grade KBr | Hygroscopic salt pressed into transparent pellets; acts as a diluent and matrix for powder analysis in transmission. |
| Volatile IR-Grade Solvents (Chloroform, Acetone, TFE) | For dissolving polymers to create uniform cast films; purity is critical to avoid interfering absorbance bands. |
| ATR Crystal (Diamond/ZnSe/Ge) | High-refractive-index material enabling surface-sensitive ATR measurement; diamond provides durability for hard polymers. |
| Pellet Die & Hydraulic Press | To compress KBr/polymer mixture into a solid, transparent disk under high pressure (8-10 tons/cm²). |
| Agate Mortar & Pestle / Vibratory Mill | For fine, homogeneous grinding of polymer powders with KBr to reduce light scattering in pellets. |
| Vacuum Oven | For removal of residual solvent from cast films and moisture from KBr/powders to eliminate spectral interference from water. |
| IR-Transparent Windows (NaCl, KBr) | Substrates for casting films or for liquid cell analysis; NaCl is common but hygroscopic. |
| Uniform Pressure ATR Clamp | Ensures consistent, reproducible optical contact between sample and ATR crystal, vital for quantitative comparison. |
Within a broader thesis investigating biodegradable polymer functional groups using Fourier-Transform Infrared (FTIR) spectroscopy, acquiring high-quality spectra is foundational. Degradation studies rely on detecting subtle changes in absorbance, peak shifts, and the emergence of new bands. This protocol outlines a systematic method to ensure spectral fidelity, reproducibility, and quantitative reliability for tracking hydrolysis, oxidation, and enzymatic breakdown in polymers like polylactic acid (PLA), polyglycolic acid (PGA), and polycaprolactone (PCL).
Key Reagent Solutions & Materials
Table 1: Essential Research Reagent Solutions for FTIR Sample Preparation
| Item | Function | Example & Notes |
|---|---|---|
| Potassium Bromide (KBr) | Hydroscopic salt for preparing transmission pellets; must be of spectroscopic grade and thoroughly dried. | FTIR Grade, 99.9%, stored at 120°C. |
| Attenuated Total Reflectance (ATR) Crystal | Enables direct measurement of solid/liquid samples via internal reflection. | Diamond crystal (durable, broad range), ZnSe (for mid-IR, less robust). |
| Deuterated Triglycine Sulfate (DTGS) Detector | A thermal detector for general-purpose, room-temperature FTIR measurements. | Standard for benchtop instruments; provides good sensitivity for routine degradation studies. |
| Mercury Cadmium Telluride (MCT) Detector | A cooled, photoconductive detector for high-sensitivity and rapid-scan applications. | Requires liquid N₂ cooling; essential for detecting weak signals from minor degradation products. |
| Spectroscopic Grade Solvents | For cleaning crystals and preparing solvent-cast polymer films. | Chloroform, Tetrahydrofuran (THF), dried and stored over molecular sieves. |
| Background Reference Material | For single-beam instruments, a clean crystal surface or empty sample chamber is used. | High-purity nitrogen atmosphere is optimal for background collection. |
| Polymer Degradation Reagents | To induce controlled degradation for study. | Phosphate Buffered Saline (PBS, pH 7.4), specific enzymes (e.g., Proteinase K for PLA), H₂O₂ for oxidative studies. |
Pre-Experimental Instrument Calibration & Validation
Protocol 3.1: Daily Instrument Performance Check
- Collect a background spectrum under the exact conditions (resolution, scans, aperture) to be used for samples.
- Acquire a reference polystyrene film spectrum (standard provided by manufacturer).
- Validate by checking key peak positions: 3026.5 cm⁻¹ (aromatic C-H stretch) and 1601.2 cm⁻¹ (C=C stretch). Peak positions should be within ±1 cm⁻¹ of certified values.
- Check signal-to-noise ratio (SNR) by measuring the peak-to-peak noise in the 2100-2000 cm⁻¹ region (typically devoid of peaks). SNR should exceed 20,000:1 for high-quality work.
Core Protocol: Sample Preparation & Spectral Acquisition
Protocol 4.1: ATR-FTIR for Solid Polymer Degradation Samples (Primary Method) Objective: To obtain high-quality, surface-specific spectra of polymer films or particles before and during degradation.
Materials: FTIR spectrometer with ATR accessory, diamond/ZnSe crystal, fine-tipped tweezers, Kimwipes, spectroscopic grade isopropanol, torque knob or consistent pressure device.
Procedure:
- Crystal Cleaning: Clean the ATR crystal thoroughly with isopropanol-dampened Kimwipe. Dry with a clean Kimwipe. Acquire a fresh background spectrum.
- Sample Positioning: Place the polymer sample (film, fragment) squarely over the crystal. Ensure full, intimate contact.
- Apply Consistent Pressure: Use the instrument's torque knob to apply a standardized, consistent pressure. Note: Excessive pressure can shift peaks.
- Spectral Acquisition Parameters (Optimized):
- Resolution: 4 cm⁻¹ (optimal balance between signal and feature definition).
- Number of Scans: 64-128 scans (improves SNR; 32 may suffice for strong absorbers).
- Spectral Range: 4000-600 cm⁻¹.
- Apodization Function: Happ-Genzel (standard for general use).
- Acquisition: Initiate scan. Visually inspect real-time interferogram for stability.
- Post-Acquisition: Immediately clean the crystal after measurement.
Protocol 4.2: Transmission FTIR via KBr Pellet (For Homogeneous Bulk Analysis) Objective: To analyze the bulk composition of powdered degradation products or blended polymers.
Materials: Hydraulic pellet press, KBr powder, agate mortar and pestle, ~1-2 mg polymer sample, vacuum die.
Procedure:
- Dry Components: Dry KBr and polymer sample at 50-60°C under vacuum for >2 hours.
- Homogenize: Grind 1-2 mg sample with 150-200 mg KBr in mortar until homogeneous and fine (1-2 minutes).
- Pellet Formation: Transfer mix to vacuum die. Apply 8-10 tons of pressure for 2-3 minutes under vacuum.
- Mounting & Acquisition: Place clear pellet in holder. Collect spectrum with parameters as in 4.1, but increase scans to 128 due to scattering losses.
Data Processing & Quality Metrics
Raw spectra require minimal but consistent processing for comparative degradation studies.
Protocol 5.1: Essential Processing Steps
- Atmospheric Suppression: Subtract a pre-recorded water vapor/carbon dioxide spectrum if bands interfere (common around 2400-2300 cm⁻¹ and 1600-1500 cm⁻¹).
- Baseline Correction: Apply a concave rubber-band correction or linear baseline to anchor key peak valleys to zero absorbance.
- Normalization: Normalize spectra to a stable internal reference peak (e.g., C-H stretch at ~2900 cm⁻¹) to compare relative changes in carbonyl (C=O) region (~1750 cm⁻¹).
Table 2: Quantitative Metrics for Spectral Quality Assessment
| Metric | Target Value | Purpose in Degradation Studies |
|---|---|---|
| Signal-to-Noise Ratio (SNR) | > 20,000:1 (for key peaks) | Enables detection of weak new peaks from minor degradation products. |
| Peak Position Reproducibility | ± 1 cm⁻¹ | Critical for identifying subtle bond environment shifts (e.g., crystalline to amorphous C=O). |
| Absorbance Linearity | R² > 0.999 for Beer's Law plot | Essential for accurate carbonyl index calculations tracking hydrolysis. |
| Spectral Resolution | 4 cm⁻¹ (confirmed via peak separation) | Resolves overlapping peaks (e.g., ester vs. acid C=O). |
| Water Vapor Interference | Absent or consistently subtracted | Prevents false assignment of O-H bands from degradation. |
Workflow Diagram
Diagram 1: FTIR Acquisition & Analysis Workflow
Key Analysis: Tracking Degradation via Carbonyl Index
Protocol 7.1: Calculating Carbonyl Index (CI) for Polyesters The CI monitors hydrolysis by tracking the increase in carbonyl absorbance relative to a stable reference.
- Define Peaks: Identify the carbonyl (C=O) peak area (~1710-1760 cm⁻¹) and a reference C-H stretch peak area (~2840-2950 cm⁻¹).
- Baseline Correct: Apply a linear baseline between defined valley points on either side of each peak.
- Integrate Areas: Calculate the area under each peak (AC=O and AC-H).
- Calculate CI: CI = (AC=O / AC-H). Report as a function of degradation time.
Table 3: Example Carbonyl Index Data for PLA in PBS (37°C)
| Degradation Time (Weeks) | Carbonyl Index (CI) | Std. Deviation (±) | Notes |
|---|---|---|---|
| 0 | 1.00 | 0.05 | Initial film, amorphous |
| 2 | 1.05 | 0.07 | Slight increase, surface hydrolysis |
| 8 | 1.45 | 0.12 | Significant bulk erosion |
| 16 | 1.80 | 0.15 | Peak broadening indicates acid end groups |
Application Notes
Within the broader thesis on utilizing FTIR spectroscopy for tracking functional group transformations in biodegradable polymers, this protocol details the application of FTIR for real-time, non-destructive monitoring of degradation kinetics. Degradation, whether hydrolytic or enzymatic, cleaves ester, anhydride, or amide bonds in polymers like PLGA, PCL, or polyurethanes, producing characteristic spectral changes. Monitoring these changes allows for the quantitative determination of degradation rates, crucial for tailoring material performance in drug delivery systems and tissue engineering scaffolds.
Key Spectral Indicators:
- Ester Bond Hydrolysis: Decrease in C=O stretch (~1750 cm⁻¹) and C-O-C stretch (~1180-1100 cm⁻¹) intensities relative to an internal reference band (e.g., C-H stretch at ~2950 cm⁻¹).
- Acid End-Group Formation: Increase in broad O-H stretch (~3500-2500 cm⁻¹) and C=O of carboxylic acid (~1710 cm⁻¹).
- Enzymatic Cleavage: Similar changes, but kinetics and potential new bands from enzyme-polymer interactions can be observed.
Quantitative Data Summary:
Table 1: Characteristic FTIR Bands for Monitoring Degradation of Common Biodegradable Polymers
| Polymer | Bond Type | Wavenumber (cm⁻¹) | Band Assignment | Change During Degradation |
|---|---|---|---|---|
| PLGA | C=O stretch | 1740-1760 | Ester carbonyl | Decrease |
| PLGA | C-O-C stretch | 1080-1130 | Ester linkage | Decrease |
| PLGA | O-H stretch | 3500-2500 | Carboxylic acid (end-group) | Increase |
| PCL | C=O stretch | 1720 | Ester carbonyl | Decrease |
| PCL | C-O-C stretch | 1165, 1240 | Ester linkage | Decrease |
| PHA | C=O stretch | 1740 | Ester carbonyl | Decrease |
| Chitosan | C-O-C stretch | 1150 | Glycosidic linkage | Decrease |
| Chitosan | N-H bend | 1590 | Amine | Shift/Change |
Table 2: Calculated Degradation Rate Constants from FTIR Data (Exemplary Data)
| Polymer | Degradation Medium | Temperature (°C) | Monitored Band (cm⁻¹) | Apparent Rate Constant (k) | Method |
|---|---|---|---|---|---|
| PLGA 50:50 | PBS (pH 7.4) | 37 | C=O @ 1750 | 0.012 day⁻¹ | Peak Height Ratio |
| PCL | Lipase Solution | 37 | C=O @ 1720 | 0.045 hr⁻¹ | Peak Area Loss |
| PLA | 0.1M NaOH | 50 | C-O-C @ 1185 | 1.2 x 10⁻³ min⁻¹ | Ester Bond Index |
Experimental Protocols
Protocol 1: In-situ Hydrolytic Degradation Monitoring via ATR-FTIR
Objective: To monitor the hydrolysis kinetics of a polyester film in phosphate-buffered saline (PBS) without sample retrieval.
Materials: See "The Scientist's Toolkit" below.
Methodology:
- Baseline Acquisition: Mount a sterile, dry polymer film on the ATR crystal. Acquire a background spectrum of air, then collect the FTIR spectrum of the dry film (32 scans, 4 cm⁻¹ resolution).
- Degradation Initiation: Carefully pipette pre-warmed PBS (pH 7.4, 37°C) onto the film, ensuring complete coverage without air bubbles. Immediately seal the liquid cell to prevent evaporation.
- Kinetic Data Collection: Program the spectrometer software for time-course measurement. Collect spectra at predetermined intervals (e.g., every 30 minutes for 24 hours, then daily). Maintain temperature at 37°C using a connected circulator.
- Data Analysis:
- Normalize all spectra to a stable internal reference band (e.g., C-H stretch).
- For the key degradation band (e.g., ester C=O), calculate the normalized peak height or area at each time point (At).
- Plot (At / A0) versus time, where A0 is the initial normalized area.
- Fit the data to an appropriate kinetic model (e.g., pseudo-first order) to determine the rate constant.
Protocol 2: Ex-situ Enzymatic Degradation Assay with FTIR Analysis
Objective: To quantify enzymatic degradation kinetics using retrieved samples for high-sensitivity analysis.
Methodology:
- Sample Preparation: Prepare identical polymer films (n≥3 per time point). Weigh each precisely (W_0).
- Degradation Incubation: Immerse each film in vials containing buffered enzyme solution (e.g., 1 mg/mL Lipase in Tris-HCl buffer, pH 7.5). Incubate at 37°C under gentle agitation. Include enzyme-free buffer controls.
- Sample Retrieval: At each time point, remove triplicate samples from both test and control groups. Rinse thoroughly with deionized water and freeze-dry to constant weight. Record final dry weight (W_t).
- FTIR Measurement: Acquire FTIR spectra of the dried samples using transmission or ATR mode.
- Data Analysis:
- Calculate mass loss: % Mass Loss = [(W0 - Wt) / W_0] * 100.
- In spectra, calculate the "Ester Bond Index" (EBI) as the ratio of the carbonyl peak area (AC=O) to the methylene peak area (ACH2).
- Plot % Mass Loss and EBI versus time. Correlate gravimetric and spectroscopic data to establish a predictive model.
Mandatory Visualization
Diagram 1: Hydrolytic Degradation Pathway
Diagram 2: FTIR Degradation Monitoring Workflow
The Scientist's Toolkit: Research Reagent Solutions
Table 3: Essential Materials for FTIR-Based Degradation Kinetics
| Item | Function/Benefit |
|---|---|
| ATR-FTIR Spectrometer | Enables non-destructive, in-situ analysis of solid/liquid interfaces without extensive sample prep. |
| Liquid Cell with Sealing | Contains aqueous or enzymatic degradation medium over the sample for controlled in-situ studies. |
| Temperature Controller | Maintains physiological (37°C) or accelerated degradation temperatures for kinetic studies. |
| Biodegradable Polymer Films | Test substrates (e.g., PLGA, PCL) of known thickness and crystallinity. |
| Phosphate Buffered Saline (PBS) | Standard hydrolytic degradation medium simulating physiological pH and ionic strength. |
| Enzyme Solutions (e.g., Lipase, Protease) | Catalyze specific enzymatic degradation; require precise buffer (Tris, phosphate) for activity. |
| Freeze Dryer (Lyophilizer) | Removes water from retrieved samples without heating, preserving chemical state for ex-situ FTIR. |
| Spectral Analysis Software | For baseline correction, normalization, peak fitting, and time-series analysis of spectral data. |
This application note, framed within a broader thesis on FTIR spectroscopy for biodegradable polymer research, details quantitative methodologies for analyzing polymer structure and stability. Accurate determination of crystallinity, degradation kinetics, and functional group conversion is critical for researchers, scientists, and drug development professionals working with biodegradable polymers for drug delivery and tissue engineering.
Key Experimental Protocols
Protocol 1: FTIR-Based Crystallinity Index (CI) Calculation for Poly(L-lactic acid) (PLLA)
Principle: The Crystallinity Index is calculated from the ratio of crystalline to amorphous absorbance bands in the FTIR spectrum.
- Prepare thin, uniform PLLA films via solvent casting.
- Acquire FTIR spectra in absorbance mode (e.g., 64 scans, 4 cm⁻¹ resolution) from 4000-400 cm⁻¹.
- Perform baseline correction on the spectral region of interest (e.g., 1300-800 cm⁻¹).
- Identify the crystalline band at ~956 cm⁻¹ and a reference amorphous band at ~870 cm⁻¹ or ~1185 cm⁻¹.
- Measure the peak height (A) or area of each band after baseline subtraction.
- Calculate CI using the formula: CI (%) = [A₉₅₆ / (A₉₅₆ + k * Aᵣₑf)] * 100, where k is a normalization constant determined from a fully amorphous sample.
Protocol 2: In Vitro Hydrolytic Degradation Rate Monitoring
Principle: Degradation is quantified by measuring mass loss or molecular weight change over time in phosphate-buffered saline (PBS).
- Pre-weigh (W₀) and measure initial molecular weight (Mₙ₀, Mₜ₀) of polymer samples (n≥3).
- Immerse samples in PBS (pH 7.4, 0.1M) at 37°C under sterile conditions.
- At predetermined time points (e.g., 1, 2, 4, 8, 12 weeks), remove samples, rinse with deionized water, and dry to constant weight.
- Measure dry weight (Wₜ) and determine residual mass: Mass Remaining (%) = (Wₜ / W₀) * 100.
- Analyze molecular weight at key time points via gel permeation chromatography (GPLC).
- Fit mass loss/Mn data to a kinetic model (e.g., first-order) to determine the degradation rate constant (k).
Protocol 3: Quantifying Functional Group Conversion via FTIR Peak Integration
Principle: The conversion of reactive groups (e.g., acrylates, epoxies) during polymerization is tracked by the disappearance of monomer peaks.
- Obtain FTIR spectra of the monomer mixture and polymerized sample.
- Select a characteristic monomer peak (e.g., C=C stretch at ~1635 cm⁻¹ for acrylates) and an internal reference peak unaffected by the reaction (e.g., C-H stretch at ~1450 cm⁻¹).
- Integrate the area under both peaks (A_reactive, A_reference) for both spectra.
- Calculate the degree of conversion (DC) using: DC (%) = [1 - (Areactive/Areference)polymer / (Areactive/Areference)monomer] * 100.
Data Presentation
Table 1: Quantitative Analysis of PLLA Samples
| Sample ID | Crystallinity Index (CI %) | Degradation Rate Constant k (week⁻¹) | Ester Conversion DC (%) | Final Mn (kDa) after 8 wk |
|---|---|---|---|---|
| PLLA-Amorphous | 12.5 ± 2.1 | 0.085 ± 0.010 | 98.7 ± 0.5 | 42.1 |
| PLLA-Semicrystalline | 65.8 ± 3.5 | 0.032 ± 0.005 | 99.1 ± 0.3 | 78.5 |
| PLLA-PEG Copolymer | 18.4 ± 1.8 | 0.120 ± 0.015 | 97.5 ± 1.2 | 31.8 |
Table 2: Key FTIR Absorption Bands for Common Biodegradable Polymers
| Polymer | Functional Group | Wavenumber (cm⁻¹) | Band Assignment & Use |
|---|---|---|---|
| Poly(lactic acid) (PLA) | C=O stretch | 1740-1760 | Crystallinity, degradation |
| C-O-C stretch | 1180-1210, 1080-1100 | Crystallinity, composition | |
| Poly(ε-caprolactone) (PCL) | C=O stretch | 1720-1725 | Degradation monitoring |
| C-O-C stretch | 1293, 1240, 1165 | ||
| Poly(glycolic acid) (PGA) | C=O stretch | ~1745 | Degradation, crystallinity |
| CH₂ bend | ~1420, ~1455 | Crystallinity |
The Scientist's Toolkit
Table 3: Essential Research Reagents & Materials
| Item | Function in Analysis |
|---|---|
| FTIR Spectrometer (ATR accessory) | Non-destructive surface analysis of polymer functional groups and crystallinity. |
| Phosphate Buffered Saline (PBS), pH 7.4 | Standard medium for simulating physiological hydrolytic degradation. |
| Gel Permeation Chromatography (GPC) System | Determines molecular weight (Mn, Mw) and its distribution to track chain scission. |
| Vacuum Oven | Dries polymer samples to constant weight for accurate mass loss measurements. |
| Analytical Balance (µg sensitivity) | Precisely measures initial and residual sample mass for degradation studies. |
| KBr or NaCl Transmission Cells | For preparing liquid or solid samples in transmission FTIR mode. |
| Spectroscopic Grade Solvents (CHCl₃, THF) | Used for polymer dissolution for GPC and film casting. |
Visualization of Methodologies
FTIR Quantitative Analysis Workflow
Polymer Degradation Rate Determination Protocol
Application Notes: Integrating Advanced FTIR Techniques for Biodegradable Polymer Research
Within the scope of a thesis on FTIR spectroscopy for biodegradable polymer functional groups, advanced techniques move beyond static spectral acquisition. They provide dynamic, spatial, and temporal resolution critical for understanding complex degradation mechanisms, polymer blend miscibility, and drug release kinetics in pharmaceutical formulations.
1. 2D Correlation Spectroscopy (2D-COS) FTIR This technique enhances spectral resolution by spreading peaks over a second dimension. It identifies sequential order of molecular events (e.g., which functional group changes first during degradation) and differentiates between overlapping bands (e.g., carbonyls from ester vs. acid end-groups).
Key Application: Monitoring the hydrolytic degradation of poly(lactic-co-glycolic acid) (PLGA). 2D-COS can deconvolute the overlapping C=O stretching regions (~1750 cm⁻¹) to reveal if crystalline or amorphous regions degrade first, and the sequence of ester bond cleavage vs. carboxylic acid formation.
2. FTIR Imaging/Mapping This method involves collecting spectra across a defined grid on a sample, generating chemical maps based on functional group distribution.
Key Application: Visualizing phase separation in polymer-drug blends or inhomogeneous degradation. For instance, mapping the distribution of the carbonyl peak (1712 cm⁻¹) in a poly(ε-caprolactone) (PCL) film exposed to enzyme solution reveals localized pitting and erosion fronts.
3. In-Situ FTIR Degradation Monitoring Real-time acquisition of spectra under controlled environmental conditions (pH, temperature, enzymatic activity) allows for kinetic analysis of degradation without sample removal.
Key Application: Quantifying real-time hydrolysis rates of polyesters in a flow-through cell simulating physiological conditions, directly correlating the decrease in ester bond peak area with mass loss over time.
Table 1: Representative Spectral Band Assignments for Common Biodegradable Polymers
| Polymer | Key Functional Group | FTIR Band Position (cm⁻¹) | Band Assignment |
|---|---|---|---|
| PLGA | Ester C=O | 1740-1760 | C=O Stretch |
| PLGA | Ether C-O-C | 1080-1130 | C-O-C Stretch |
| PCL | Ester C=O | 1720-1740 | C=O Stretch |
| PCL | Aliphatic CH₂ | 2865-2945 | CH₂ Stretch |
| Poly(lactic acid) (PLA) | Ester C=O | 1750-1780 | C=O Stretch |
| Poly(glycolic acid) (PGA) | Ester C=O | ~1710-1760 | C=O Stretch |
Table 2: Comparative Outputs from Advanced FTIR Techniques for PLGA (50:50) Hydrolysis
| Technique | Primary Measurable | Temporal Resolution | Spatial Resolution | Key Insight Generated |
|---|---|---|---|---|
| In-Situ Monitoring | Peak Area (C=O) vs. Time | Minutes to Hours | N/A (Bulk) | Hydrolysis rate constant (k) = 0.012 day⁻¹ (at pH 7.4, 37°C) |
| FTIR Mapping | Distribution of C=O Intensity | Post-mortem (e.g., weekly) | 5-25 µm | Erosion front depth increases from 50 µm to 200 µm over 4 weeks. |
| 2D-COS | Correlation Peak Sequence | Series of Time-Points | N/A (Bulk) | Sequential Order: Hydration (O-H stretch @ 3400 cm⁻¹) → Ester cleavage (C=O @ 1750 cm⁻¹) → Acid formation (COOH @ 1710 cm⁻¹). |
Experimental Protocols
Protocol 1: In-Situ ATR-FTIR Monitoring of Enzymatic Degradation Objective: To monitor real-time surface hydrolysis of a PCL film by Pseudomonas cepacia lipase. Materials: PCL film spin-coated on ATR crystal, FTIR spectrometer with flow cell, peristaltic pump, 0.1 M phosphate buffer (pH 7.4), lipase solution (1.0 mg/mL in buffer). Procedure:
- Mount PCL-coated ATR crystal in flow cell. Acquire background spectrum of dry film.
- Initiate buffer flow (1 mL/min) and collect spectra (4 cm⁻¹ resolution, 32 scans) every 5 minutes for 1 hour to establish baseline.
- Switch inflow to lipase solution. Continuously collect spectra under identical parameters for 24-48 hours.
- For each spectrum, integrate the area of the ester carbonyl peak (~1725 cm⁻¹).
- Plot normalized peak area versus time. Fit the exponential decay region to determine the apparent first-order degradation rate constant.
Protocol 2: FTIR Chemical Mapping of a Degraded Polymer Blend Objective: To map the spatial distribution of degradation products in a PLA/PGA blend film after in vitro immersion. Materials: PLA/PGA (70:30) film, FTIR imaging system with focal plane array (FPA) detector, CaF₂ windows, phosphate-buffered saline (PBS). Procedure:
- Immerse film samples in PBS (pH 7.4, 37°C) for predetermined times (0, 2, 4 weeks). Rinse and dry.
- Place a film section between two CaF₂ windows. Mount in the imaging stage.
- Define a map area (e.g., 500 x 500 µm) with a pixel resolution of ~5 µm.
- Collect spectra in transmission/reflection mode (8 cm⁻¹ resolution, 64 scans/pixel).
- Using analysis software, generate chemical maps by integrating the carbonyl band (1750-1710 cm⁻¹) and a reference band (e.g., CH stretch at 2940 cm⁻¹) for normalization.
- Generate a ratio map (C=O/CH) to visualize relative changes in ester concentration, highlighting degraded regions.
Protocol 3: 2D-COS FTIR Analysis of Thermal-Induced Transitions Objective: To study the order of structural changes in a thermally responsive polymer hydrogel (e.g., poly(N-isopropylacrylamide)). Materials: Hydrogel thin film, temperature-controlled FTIR stage. Procedure:
- Place hydrogel film in the temperature stage. Equilibrate at 25°C.
- Collect spectra while ramping temperature from 25°C to 45°C at 1°C/min intervals.
- Pre-process spectra: baseline correct, normalize (e.g., against a stable band).
- Select the spectral region of interest (e.g., 1500-1700 cm⁻¹ for amide I/II).
- Input the series of spectra into 2D-COS software (e.g., 2D Shige). Generate synchronous (Φ) and asynchronous (Ψ) correlation maps.
- Interpret maps: Cross-peaks in Φ indicate correlated changes. The sign of Ψ peaks, interpreted using Noda's rules, reveals the sequence of changes at different wavenumbers (e.g., whether backbone dehydration precedes side-chain rearrangement).
Visualizations
Title: Sequential Degradation Pathway Revealed by 2D-COS
Title: FTIR Imaging/Mapping Workflow for Polymer Films
The Scientist's Toolkit: Essential Research Reagent Solutions
Table 3: Key Materials for Advanced FTIR Studies of Biodegradable Polymers
| Item | Function & Relevance |
|---|---|
| ATR Crystals (Diamond, ZnSe) | Provides robust, chemically inert surface for in-situ analysis and mapping of degrading polymer surfaces. |
| Temperature/Humidity Controlled Stage | Enables in-situ monitoring under simulated physiological or accelerated aging conditions. |
| Flow-Through Liquid Cells | Allows real-time circulation of buffer/enzyme solutions for kinetic degradation studies. |
| Focal Plane Array (FPA) Detector | Essential for high-speed FTIR imaging, capturing thousands of spectra simultaneously to create chemical maps. |
| CaF₂ or BaF₂ Windows | Infrared-transparent windows for transmission mapping of thin film samples. |
| Deuterated Triglycine Sulfate (DTGS) Detector | Standard, room-temperature detector for high-sensitivity time-series studies where FPA is not required. |
| 2D Correlation Analysis Software (e.g., 2D Shige) | Specialized software for generating and interpreting synchronous/asynchronous correlation maps from spectral series. |
| Phosphate Buffered Saline (PBS), pH 7.4 | Standard immersion medium for simulating physiological hydrolysis conditions. |
| Specific Enzymes (e.g., Lipase, Proteinase K) | Used to study enzyme-catalyzed degradation pathways relevant to biomedical applications. |
| Calibration Polymers (e.g., Polystyrene) | Provides known IR bands for frequency accuracy validation and spatial resolution checks in imaging. |
Solving Spectral Mysteries: Troubleshooting Common FTIR Issues with Biodegradable Polymers
1. Introduction and Thesis Context
Within the broader thesis on "Advanced FTIR Spectroscopy for Tracking Functional Group Evolution in Biodegradable Polymers," the accurate identification of spectral artifacts is paramount. Biodegradable polymer research, particularly for drug delivery systems, relies on precise functional group analysis to monitor hydrolysis, ester cleavage, and microbial degradation. Artifacts such as moisture interference, scattering, and saturation can obscure or mimic these critical chemical changes, leading to erroneous conclusions about degradation kinetics and mechanism. This application note provides detailed protocols for identifying and correcting these three pervasive artifacts to ensure data fidelity in functional group analysis.
2. Artifact Identification and Quantitative Impact
The following table summarizes the characteristic signs, affected spectral regions, and potential quantitative impact on biodegradable polymer analysis.
Table 1: Summary of Key FTIR Artifacts in Biodegradable Polymer Analysis
| Artifact | Primary Spectral Regions Affected | Characteristic Signature | Impact on Biodegradable Polymer Analysis |
|---|---|---|---|
| Moisture Interference | 3700-3500 cm⁻¹ (O-H stretch), ~1640 cm⁻¹ (H-O-H bend) | Sharp, narrow peaks (vapor) or broad bands (liquid); changes under purge. | Obscures O-H stretch from hydrolytic cleavage; interferes with amide/acid analysis in functionalized polymers. |
| Scattering | High-wavenumber side of bands (>1500 cm⁻¹); overall sloping baseline. | Increased upward or downward baseline slope; band distortions. | Distorts C-H, C=O stretch intensities; complicates quantitative crystallinity (e.g., PLA) or carbonyl index calculations. |
| Saturation | Any strong absorbance band (e.g., C=O ~1750 cm⁻¹). | Flat-topped, non-Lorentzian bands; loss of peak fine structure. | Renders primary functional group bands (ester C=O) quantitatively useless; loss of info on hydrogen bonding shifts. |
3. Experimental Protocols for Identification and Correction
Protocol 3.1: Mitigating Moisture Interference Objective: To obtain spectra free from atmospheric water vapor and adsorbed water contributions. Materials: FTIR spectrometer with environmental purge kit (dry air or N₂), desiccator, humidity indicator. Procedure:
- System Purge: Activate the spectrometer's purge system for a minimum of 30 minutes prior to data collection. Verify low humidity levels using the instrument's internal sensor (<5% relative humidity preferred).
- Sample Preparation: For polymer films cast from solution, dry in a vacuum desiccator over P₂O₅ for 24 hours. For solid powders, use a hydraulic press to create KBr pellets, and dry the pellets in a desiccator for 1 hour.
- Background Acquisition: Collect a fresh background spectrum with the empty sample chamber under continuous purge immediately before sample measurement.
- Validation: Scan an empty sample holder or a blank KBr pellet as a "sample." The spectrum should show no sharp peaks in the 3700-3500 cm⁻¹ region. A small, broad residual O-H band may indicate polymer-bound water. Data Correction: If residual vapor peaks persist, use spectrometer software to perform a vapor subtraction function, using a library water vapor spectrum.
Protocol 3.2: Correcting for Scattering Artifacts (ATR-FTIR) Objective: To correct sloping baselines in ATR spectra of rough or crystalline polymer surfaces. Materials: ATR accessory (diamond or ZnSe crystal), polymer film or degradation fragment, pressure clamp. Procedure:
- Ensure Good Contact: Clean the ATR crystal. Place the polymer sample on the crystal and apply consistent, firm pressure using the instrument's clamp.
- Collect Sample Spectrum: Acquire spectrum at 4 cm⁻¹ resolution, 64 scans.
- Apply Scattering Correction: Process the spectrum using a baseline correction algorithm. For broad, linear slopes, use a concave rubberband correction (e.g., 10-20 baseline points). For more complex scattering, use a derivative-based correction (e.g., Norris derivative gap segment) prior to multivariate analysis.
- Verification: Compare the corrected spectrum's baseline between 2000-1800 cm⁻¹ (a region typically free of polymer absorbances). It should be flat and near zero absorbance.
Protocol 3.3: Avoiding and Diagnosing Spectral Saturation Objective: To acquire spectra within the linear response range of the detector. Materials: Polymer sample, ATR or transmission cell. Procedure:
- Preliminary Scan: Perform a rapid scan (e.g., 16 scans) of the sample.
- Peak Check: Inspect the strongest absorbance band (typically C=O stretch ~1750 cm⁻¹). If the peak is flat at the top or has a maximum absorbance >1.2 AU (for DTGS detectors) or near the detector's non-linear range (for MCT detectors), saturation is likely.
- Corrective Action (ATR): Reduce the number of scans to 16-32. If saturation persists, slightly reduce the pressure of the clamp to decrease effective contact, or prepare a thinner film.
- Corrective Action (Transmission): Dilute the sample in KBr (for pellets) or prepare a solution in a volatile solvent and cast a thinner film.
- Validation: Re-acquire the spectrum. The strongest peak should have a smooth, Lorentzian/Gaussian shape with a clear maximum point.
4. Visualization of Workflows
Title: FTIR Artifact Diagnosis and Correction Workflow
Title: How Artifacts Lead to Misinterpretation of Polymer Degradation
5. The Scientist's Toolkit: Essential Research Reagents & Materials
Table 2: Key Reagents and Materials for Artifact-Free FTIR Analysis of Biodegradable Polymers
| Item | Function/Application in Protocol |
|---|---|
| High-Purity Potassium Bromide (KBr) | For preparing transmission pellets; must be anhydrous and IR-grade to avoid introducing moisture or scattering artifacts. |
| Desiccant (P₂O₅ or molecular sieves) | For rigorous drying of polymer samples and KBr in a desiccator to remove adsorbed water (Protocol 3.1). |
| Dry Air or Nitrogen Purge Gas | Essential for purging the spectrometer optics to eliminate atmospheric water vapor and CO₂ from spectra. |
| ATR Crystal Cleaning Kit | Isopropanol, lint-free wipes, and specialized polishing paste to maintain crystal clarity and ensure optimal sample contact, reducing scattering. |
| Hydraulic Pellet Press | For creating uniform, clear KBr pellets from polymer powders, minimizing light scattering. |
| Certified Polymer Reference Standards | (e.g., Polylactide (PLA), Polycaprolactone (PCL)) for validating instrument performance and correction protocols. |
| Humidity Indicator Card | Placed inside sample compartment or desiccator to visually monitor ambient moisture levels. |
Overcoming Challenges with Highly Crystalline vs. Amorphous Polymer Samples
This application note addresses a pivotal experimental challenge within a broader thesis investigating the functional group evolution of biodegradable polymers (e.g., PLLA, PCL, PHBV) via FTIR spectroscopy. The degree of crystallinity profoundly impacts FTIR spectra, influencing band position, intensity, and width. Misinterpretation can lead to incorrect conclusions about chemical structure, degradation pathways, or polymer-drug interactions. Differentiating crystalline-sensitive bands from true chemical changes is essential for accurate analysis in materials science and drug delivery system development.
Core Challenges & Spectral Manifestations
| Spectral Feature | Highly Crystalline Sample | Amorphous / Less Ordered Sample | Primary Challenge |
|---|---|---|---|
| Band Sharpness | Sharper, more resolved bands. | Broader, more diffuse bands. | Obscured functional group identification; overlapping peaks. |
| Band Position | May shift due to restricted chain motion (e.g., C=O stretch). | Often at higher wavenumbers. | Misassignment of chemical environment. |
| Relative Intensity | Significant changes for crystallinity-sensitive modes (e.g., 921 cm⁻¹ in PLLA). | These bands are weak or absent. | Quantitative analysis errors if bands used for normalization. |
| Baseline | Generally stable. | Can exhibit sloping or scattering artifacts. | Complicates integration and quantitative comparison. |
Experimental Protocols
Protocol 1: Sample Preparation for Reliable FTIR Analysis
Aim: To prepare comparable samples that minimize scattering and thickness artifacts.
- Solution Casting (For Amorphous-Rich Films):
- Dissolve 50-100 mg of polymer in 5-10 mL of appropriate solvent (e.g., chloroform for PLLA).
- Cast solution onto a leveled, optically flat KBr window or Teflon dish.
- Cover loosely to allow slow evaporation over 24h.
- Dry under vacuum at 40°C for 48h to remove residual solvent.
- Hot-Pressing (For Controlled Crystallinity):
- Place ~10 mg polymer between two Teflon sheets or aluminum foil.
- Use a hydraulic press. Heat to 20°C above Tg (or Tm for semi-crystalline).
- Apply 2-5 metric tons pressure for 2 minutes.
- Quench-cool: Rapidly move to ice water for amorphous films.
- Annealed-cool: Hold at a crystallization temperature (e.g., 100°C for PLLA) for 1h, then cool slowly to induce crystallinity.
- Microtomy (For Bulk Samples):
- Embed the polymer sample, if necessary.
- Use a glass or diamond knife to cut thin sections (5-20 µm thickness) at room temperature or cryogenically.
- Float sections onto a KBr window and dry.
Protocol 2: FTIR Data Acquisition & Processing for Crystallinity Assessment
Aim: To acquire spectra that enable differentiation of crystallinity effects from chemical changes.
- Instrument Setup: Use an FTIR spectrometer in transmission or ATR mode (ensure consistent pressure for ATR). Resolution: 4 cm⁻¹. Scans: 64 minimum.
- Background & Sample Collection: Collect background under identical conditions. For transmission, ensure sample absorbance is between 0.2-0.8 AU.
- Spectral Processing Workflow:
- Baseline Correction: Apply a linear or concave rubber-band correction.
- Normalization: Critical Step. Use an internal standard band insensitive to crystallinity. For polyesters, the C-H stretch band (~2950 cm⁻¹) is often suitable. Normalize all spectra to this band's peak height or area.
- Deconvolution: For overlapping bands (e.g., C=O region ~1750 cm⁻¹), apply Fourier self-deconvolution or second-derivative analysis to identify sub-bands.
- Crystallinity Index Calculation: Calculate the ratio of crystalline-sensitive band area to reference band area. E.g., for PLLA: Crystallinity Index = (A₉₂₁ / A₉₅₆) or similar.
Visualization: Experimental & Analytical Workflow
Title: FTIR Workflow for Polymer Crystallinity
Title: Spectral Deconvolution Challenge
The Scientist's Toolkit: Research Reagent Solutions
| Material / Reagent | Function in Experiment |
|---|---|
| Potassium Bromide (KBr), Optically Pure | For preparing transmission pellets or as a substrate for casting films. Hygroscopic; must be dried. |
| Diamond ATR Crystal | Durable, chemically inert crystal for ATR-FTIR sampling of hard or uneven polymer surfaces. |
| Anhydrous Chloroform or DCM | Common solvent for solution casting of many biodegradable polyesters. Anhydrous grade prevents hydrolysis. |
| Hydraulic Heat Press | For hot-pressing protocol to create films with controlled thermal history and thickness. |
| Microtome with Cryo-Attachment | To create thin, consistent cross-sections from bulk polymer samples for transmission FTIR. |
| Spectral Deconvolution Software (e.g., Fityk, PeakFit) | Essential for mathematically resolving overlapping bands in the carbonyl region to assess contributions. |
| Crystallinity Reference Standards | Well-characterized 100% amorphous and highly crystalline samples of the polymer for calibration. |
In the context of a broader thesis investigating the functional groups of biodegradable polymers, Fourier Transform Infrared (FTIR) spectroscopy stands as a critical analytical tool. The precise identification of carbonyl (C=O), ester (C-O-C), and hydroxyl (O-H) groups, and monitoring their changes during degradation, hinges entirely on the quality of the acquired spectra. Suboptimal instrument parameters yield data with ambiguous peak positions, reduced signal-to-noise ratios (SNR), and diminished resolution, leading to incorrect functional group assignment and flawed kinetic models. This application note provides detailed protocols for optimizing resolution, number of scans, and apodization functions to generate clear, reliable data for polymer analysis.
Key Parameters: Definitions and Impact on Spectral Data
Resolution: Defined as the minimum wavenumber separation at which two peaks can be distinguished, typically reported in cm⁻¹. Higher resolution (e.g., 2 cm⁻¹ vs. 8 cm⁻¹) is crucial for separating overlapping bands common in polymer blends or complex degradation products. Number of Scans: The repeated co-addition of interferograms to improve the Signal-to-Noise Ratio (SNR). SNR improves with the square root of the number of scans. Apodization: A mathematical function applied to the interferogram to reduce truncation artifacts (sidelobes) and shape the instrumental line function (ILF). The choice involves a trade-off between resolution and SNR.
Table 1: Quantitative Impact of Parameter Changes on Spectral Data
| Parameter | Typical Range for Polymers | Effect on SNR | Effect on Resolution | Effect on Acquisition Time | Recommended for Polymer Functional Groups |
|---|---|---|---|---|---|
| Spectral Resolution | 1 - 8 cm⁻¹ | Lower resolution improves SNR. | Directly set by parameter. Lower value = higher resolution. | Higher resolution increases time. | 4 cm⁻¹: Routine screening. 2 cm⁻¹: Detailed analysis of overlapping bands (e.g., crystalline vs. amorphous C=O). |
| Number of Scans | 16 - 256 | SNR ∝ √(Number of Scans). | No direct effect. | Linear increase with scan number. | 32 scans: Initial survey. 64-128 scans: Standard for publication-quality data of thin films. |
| Apodization Function | Boxcar, Happ-Genzel, Norton-Beer | Varies by function. | Affects apparent resolution and sidelobe suppression. | No effect. | Happ-Genzel (Medium): General-purpose for polymer films. Norton-Beer (Strong): When maximizing SNR is critical. |
Experimental Protocol: Systematic Optimization for Polymer Analysis
Objective: To determine the optimal FTIR parameters for monitoring the hydrolysis-induced carbonyl peak shift in a polylactic acid (PLA) film.
Materials:
- FTIR Spectrometer with DTGS or MCT detector.
- Transmission cell holder.
- Thin film of PLA (~50-100 µm thickness).
- Software capable of controlling resolution, scans, and apodization.
Procedure:
Sample Mounting: Securely mount the PLA film in the transmission holder. Ensure the film is taut and free of wrinkles.
Baseline Acquisition: Collect a background spectrum under the same humidity conditions as the sample measurement. Use a moderately high setting (e.g., 4 cm⁻¹ resolution, 32 scans, Happ-Genzel apodization).
Resolution Optimization Experiment: a. Set scans to 32 and apodization to Happ-Genzel. b. Collect spectra of the same sample spot at 8, 4, 2, and 1 cm⁻¹ resolution. c. In the carbonyl region (1750-1700 cm⁻¹), observe the full width at half maximum (FWHM) and the separation of any shoulder peaks. Note the increase in acquisition time.
Scan Number Optimization Experiment: a. Set resolution to the chosen optimal value from step 3 (e.g., 4 cm⁻¹). b. Collect spectra at 8, 16, 32, 64, and 128 scans. c. In a region with minimal absorbance (e.g., 2200-2000 cm⁻¹), measure the peak-to-peak noise. Plot SNR (or 1/noise) versus √(scan number) to confirm the relationship.
Apodization Function Comparison: a. Set resolution and scans to optimal values (e.g., 4 cm⁻¹, 64 scans). b. Collect spectra using Boxcar, Happ-Genzel (Weak, Medium, Strong), and Norton-Beer (Medium) functions. c. Examine a sharp, isolated peak (e.g., ~1450 cm⁻¹ CH₂ bend). Compare the FWHM and the presence of negative sidelobes adjacent to the peak.
Final Data Acquisition for Degradation Study: Using the optimized parameters (e.g., 4 cm⁻¹, 64 scans, Happ-Genzel Medium), acquire spectra of PLA films at controlled degradation time points. Precisely monitor the position and shape of the C=O stretch (~1750 cm⁻¹) and C-O-C stretches (~1180, 1130 cm⁻¹).
Data Interpretation: The optimized parameters should yield spectra where the key functional group peaks are sharp, well-defined, and have a high SNR, enabling accurate peak fitting and tracking of subtle shifts (< 2 cm⁻¹) indicative of chemical changes during biodegradation.
Visualization of FTIR Parameter Optimization Workflow
FTIR Parameter Optimization Workflow
The Scientist's Toolkit: Key Research Reagent Solutions
Table 2: Essential Materials for FTIR Analysis of Biodegradable Polymers
| Item | Function & Relevance to Polymer Research |
|---|---|
| Polylactic Acid (PLA) Reference Film | A well-characterized, pure polymer standard for instrument calibration, verifying wavenumber accuracy, and as a control in degradation studies. |
| Potassium Bromide (KBr), Spectroscopy Grade | For preparing pellets of polymer powders or micro-samples, allowing transmission analysis of materials not easily cast as films. |
| Attenuated Total Reflection (ATR) Crystal (Diamond/ZnSe) | Enables direct, non-destructive surface analysis of thick or opaque polymer samples without preparation. Critical for in-situ degradation monitoring. |
| Deuterated Triglycine Sulfate (DTGS) Detector | A robust, room-temperature detector ideal for routine analysis of polymer films with strong signals. Standard for most lab environments. |
| Mercury Cadmium Telluride (MCT) Detector | A liquid nitrogen-cooled detector with极高 sensitivity and fast response. Essential for time-resolved degradation studies or microscopic FTIR mapping. |
| Dynamic Humidity Control Chamber | For controlling environmental humidity during degradation studies, as hydrolysis rates of polyesters (PLA, PHA) are humidity-dependent. |
| Spectrum Subtraction Software | To digitally subtract reference spectra (e.g., pure polymer) from degraded sample spectra, isolating the spectral signatures of degradation products. |
Deconvolution and Peak Fitting Strategies for Overlapping Absorption Bands
Within a thesis on FTIR spectroscopy for biodegradable polymer functional groups research, accurate interpretation of overlapping absorption bands is critical. Polymers like poly(lactic-co-glycolic acid) (PLGA), polycaprolactone (PCL), and polyhydroxyalkanoates (PHAs) exhibit complex, overlapping bands in their FTIR spectra. Deconvolution and peak fitting are essential to deconstruct these envelopes into constituent peaks, enabling precise identification and quantification of functional groups, crystallinity, degradation products, and copolymer composition, which are vital for drug delivery system development.
Table 1: Common Overlapping Band Regions in Biodegradable Polymers
| Polymer | Spectral Region (cm⁻¹) | Overlapping Functional Groups |
|---|---|---|
| PLGA | 1750-1700 | C=O stretch (ester), C=O stretch (acid end groups) |
| PCL | 1725-1700 | Crystalline C=O, Amorphous C=O |
| PHA | 1300-1000 | C-O-C stretch, C-OH stretch, CH₃ deformation |
| Polyesters (General) | 1200-1000 | Multiple C-O stretching modes from ester linkages |
Table 2: Key Peak Fitting Parameters for Band Deconvolution
| Parameter | Typical Value/Setting | Explanation/Impact on Fit |
|---|---|---|
| Peak Function | Gaussian, Lorentzian, Voigt (70% Gaussian) | Models peak shape. Voigt often best for polymers. |
| Baseline Type | Linear, Polynomial (2nd-4th order) | Removes background drift; crucial for quantitation. |
| FWHM (Full Width at Half Max) | Varies (8-40 cm⁻¹) | Indicates homogeneity, crystallinity, and hydrogen bonding. |
| R² Value | >0.995 | Goodness-of-fit benchmark. |
| Number of Peaks | Determined by 2nd Derivative & Residual Analysis | Minimum needed to avoid over/under-fitting. |
Experimental Protocols
Protocol 1: FTIR Spectral Acquisition for Deconvolution Analysis
- Sample Preparation: Prepare polymer films via solvent casting (e.g., chloroform) onto potassium bromide (KBr) windows or use attenuated total reflectance (ATR) on neat, flat samples.
- Instrument Setup: Use FTIR spectrometer with resolution set to ≤ 4 cm⁻¹ (2 cm⁻¹ preferred). Accumulate 32-64 scans to ensure high signal-to-noise ratio.
- Background Collection: Collect background spectrum under identical conditions (empty ATR crystal or clean KBr window).
- Spectral Processing: Acquire sample spectrum. Apply atmospheric suppression (CO₂, H₂O) and perform baseline correction (Concave Rubberband method) across the entire spectrum before targeting specific regions for deconvolution.
Protocol 2: Systematic Workflow for Peak Deconvolution
- Region Selection: Isolate the spectral region containing the overlapping band of interest (e.g., 1800-1680 cm⁻¹ for carbonyl).
- Baseline Definition: Apply a linear or polynomial (2nd order) baseline specifically to the selected, isolated region.
- Initial Peak Identification: Calculate the second derivative of the spectrum to identify hidden inflection points, suggesting underlying peak positions (centers).
- Peak Assignment: Tentatively assign identified peak centers to known functional groups based on literature (see Table 1).
- Model Building: In peak fitting software (e.g., Origin, OPUS, Fityk), input the number of peaks and their initial centers. Use a Voigt profile for each peak.
- Iterative Fitting: Execute the fitting algorithm (e.g., Levenberg-Marquardt). Constrain peak positions within a narrow range (±2-5 cm⁻¹) of initial values. Allow FWHM and height to vary.
- Validation: Assess fit quality via residual plot (should be random noise) and R² value. Adjust model if systematic deviations are observed.
- Quantification: For a validated fit, report peak center, height, area, and FWHM. The area percentage of each component peak is the primary quantitative metric (e.g., % crystallinity from C=O band).
Visualization of Methodologies
Title: FTIR Peak Deconvolution and Fitting Workflow
Title: Research Reagent Solutions for FTIR Deconvolution
The Scientist's Toolkit: Research Reagent Solutions
See the table embedded in the diagram above for the detailed list of essential materials, items, and their functions.
Article Context
This article is presented as a series of structured application notes and protocols within a broader thesis on the application of Fourier-Transform Infrared (FTIR) spectroscopy for tracking functional group transformations in biodegradable polymers. The focus is on diagnosing anomalous spectroscopic data that can arise during processing or degradation studies, which are critical for researchers and product developers in pharmaceuticals, medical devices, and sustainable materials.
Application Note 1: Unexpected Ester Peak Reduction During PLA Melt Processing
Background: During routine characterization of polylactic acid (PLA) after twin-screw extrusion, a significant and unexpected reduction in the carbonyl (C=O) ester peak intensity at ~1750 cm⁻¹ was observed, contrary to the expected minimal change.
Hypothesis: The reduction suggests potential thermo-hydrolytic degradation, where chain scission at the ester bond reduces the effective concentration of ester groups per unit mass, or the emergence of new carboxylic acid end-groups shifting absorbance.
Quantitative Data Summary:
Table 1: FTIR Peak Area Analysis for Processed PLA
| Sample Condition | Ester C=O Peak Area (a.u.) | -OH Peak Area (a.u.) | Ester/CH₃ Ratio |
|---|---|---|---|
| Virgin PLA Pellet | 145.2 ± 3.1 | 12.5 ± 1.2 | 1.00 ± 0.02 |
| Processed @ 190°C | 122.7 ± 4.5 | 28.3 ± 2.8 | 0.84 ± 0.03 |
| Processed @ 210°C | 105.8 ± 5.2 | 41.6 ± 3.5 | 0.73 ± 0.04 |
Experimental Protocol: FTIR Monitoring of Melt-Processed PLA
- Sample Preparation: Virgin PLA pellets are dried at 80°C under vacuum for 4 hours. Samples are then processed using a micro-compounder at 190°C and 210°C with a residence time of 5 minutes.
- Film Casting: Immediately after processing, approximately 10 mg of polymer is pressed between two KBr windows using a heated hand press (90°C) to create a thin, uniform film for transmission FTIR.
- FTIR Acquisition: Spectra are collected on a spectrometer with a DTGS detector. Parameters: 4000–400 cm⁻¹ range, 4 cm⁻¹ resolution, 64 scans per sample.
- Data Analysis: All spectra are baseline-corrected (concave rubberband correction, 10 points). The integrated areas for the carbonyl region (1800–1700 cm⁻¹) and the hydroxyl region (3650–3200 cm⁻¹) are normalized against the stable C-H stretching band of the CH₃ group at ~2995 cm⁻¹.
- Validation: Confirm molecular weight drop via parallel GPC analysis on the same samples.
Diagram Title: Diagnostic Pathway for PLA Ester Peak Reduction
Application Note 2: Emergence of Unexpected Amide Peak in PCL Hydrolytic Degradation
Background: Polycaprolactone (PCL) films subjected to accelerated hydrolysis in pH 7.4 buffer at 60°C showed an unexpected, gradual appearance of a weak amide I band (~1640 cm⁻¹) and amide II band (~1550 cm⁻¹) after 8 weeks.
Hypothesis: Contamination from proteinaceous matter (e.g., from laboratory enzymes or microbial growth) or, more likely, intermolecular aminolysis reaction between hydrolytically generated carboxylic acid end-groups and amine-terminated oligomers from trace impurities.
Quantitative Data Summary:
Table 2: FTIR Band Evolution for PCL in Buffered Solution
| Degradation Time (Weeks) | Ester C=O Peak Area | New Amide I Peak Area | Ester/Amide I Ratio |
|---|---|---|---|
| 0 | 100.0 ± 2.5 | 0.0 | N/A |
| 4 | 92.3 ± 3.1 | 0.0 | N/A |
| 8 | 81.4 ± 4.0 | 3.2 ± 0.5 | 25.4 |
| 12 | 70.1 ± 5.2 | 5.8 ± 0.7 | 12.1 |
Experimental Protocol: Differentiating Contamination from Reaction Product
- Controlled Degradation: Prepare sterile PCL films (10x10x0.1 mm) via solvent casting. Divide into two sets: sterile control and non-sterile. Immerse in phosphate buffer (pH 7.4, 0.1M) with 0.02% sodium azide (biocide) in sealed vials at 60°C.
- Sample Cleaning: At each time point, remove samples, rinse thoroughly with deionized water, and dry to constant weight in a vacuum desiccator.
- FTIR-ATR Acquisition: Analyze film surfaces using a single-reflection ATR diamond accessory. Parameters: 4000–650 cm⁻¹, 4 cm⁻¹ resolution, 128 scans, constant pressure applicator.
- Spectral Deconvolution: Apply second-derivative spectroscopy and Gaussian deconvolution to the 1800–1500 cm⁻¹ region to isolate overlapping amide and carboxylate peaks.
- Surface Analysis: Perform X-ray Photoelectron Spectroscopy (XPS) on the same film area to quantify surface nitrogen atomic percentage, confirming the presence of amide bonds.
Diagram Title: PCL Amide Band Investigation Workflow
The Scientist's Toolkit: Key Research Reagent Solutions
Table 3: Essential Materials for FTIR-Based Degradation Studies
| Item Name | Function & Rationale |
|---|---|
| Potassium Bromide (KBr), FTIR Grade | For preparing transparent pellets for transmission analysis of solid powders or degraded fragments. High purity is critical to avoid spectral interference. |
| Deuterated Triglycine Sulfate (DTGS) Detector | A standard, robust detector for routine FTIR, essential for quantitative comparison studies due to its linear response. |
| Diamond ATR Crystal | Enables direct, non-destructive surface analysis of films and solids. Ideal for monitoring in-situ surface changes during degradation. |
| Sodium Azide (NaN₃), 0.02% w/v | Biocide added to aqueous degradation media to suppress microbial growth, which can produce confounding protein/amide FTIR signals. |
| Phosphate Buffer Salts (Na₂HPO₄/ KH₂PO₄) | To maintain precise pH during hydrolytic degradation studies, as pH drastically affects degradation rates of polyesters. |
| Micro-Compounder / Twin-Screw Extruder (Lab Scale) | Allows precise simulation of industrial thermal and shear processing conditions for "before vs. after" FTIR analysis. |
| Gaussian Deconvolution Software | Spectral analysis tool to resolve overlapping absorption bands (e.g., ester, acid, amide) for accurate peak area quantification. |
Beyond the Spectrum: Validating FTIR Data with Complementary Analytical Techniques
Correlating FTIR Data with NMR, GPC, and DSC for Comprehensive Material Characterization
Within the broader thesis on FTIR spectroscopy for biodegradable polymer research, this application note details protocols for integrating FTIR with Nuclear Magnetic Resonance (NMR), Gel Permeation Chromatography (GPC), and Differential Scanning Calorimetry (DSC). This multi-technique approach is essential for conclusively identifying functional groups, quantifying composition, determining molecular weight, and assessing thermal properties, providing a complete characterization framework crucial for researchers and drug development professionals working with materials like poly(lactic-co-glycolic acid) (PLGA), polycaprolactone (PCL), and polyhydroxyalkanoates (PHA).
Fourier-Transform Infrared (FTIR) spectroscopy is a cornerstone for identifying chemical bonds and functional groups in biodegradable polymers. However, its standalone data can be ambiguous. For example, a carbonyl stretch (C=O) at ~1750 cm⁻¹ is common to esters, carbonates, and aldehydes. Correlation with other techniques resolves such ambiguities, enabling precise material specification essential for reproducible drug delivery systems and implantable devices.
Application Notes & Data Correlation
FTIR-NMR Correlation: Absolute Structural Elucidation
FTIR suggests the presence of functional groups, while ¹H or ¹³C NMR provides definitive structural proof and enables quantitative compositional analysis.
Table 1: Correlating FTIR Peaks with NMR Chemical Shifts for Common Biodegradable Polymers
| Polymer | Key FTIR Band (cm⁻¹) | Assignment | Correlated NMR Signal (¹H, δ ppm) | Structural Information Confirmed |
|---|---|---|---|---|
| PLGA | ~1750 (s) | C=O ester | 4.8 (q, CH lactate), 5.2 (q, CH glycolide), 1.5 (d, CH₃ lactate) | Lactide:Glycolide ratio, copolymer sequence |
| PCL | ~1720 (s) | C=O ester | 4.0 (t, O-CH₂), 2.3 (t, CO-CH₂), 1.6 (m, CH₂) | Ester linkage confirmation, end-group analysis |
| P(3HB) | ~1725 (s) | C=O ester | 5.25 (m, CH), 2.5 (m, CH₂), 1.25 (d, CH₃) | Hydroxybutyrate monomer content |
Protocol 1: Simultaneous FTIR and NMR Sample Preparation
- Objective: Prepare a single polymer sample suitable for both FTIR and solution NMR analysis.
- Materials: Lyophilized polymer, deuterated chloroform (CDCl₃), anhydrous potassium bromide (KBr).
- Procedure:
- Dissolve 5-10 mg of the purified, dry polymer in 0.6 mL of CDCl₃ in a clean NMR tube.
- Cap and gently agitate until fully dissolved (may require several hours for high Mw samples).
- For NMR: Analyze directly using standard ¹H NMR parameters (e.g., 400 MHz, 16 scans, relaxation delay 5s).
- For FTIR: Using a clean pipette, transfer ~50 µL of the NMR sample solution onto a pre-polished KBr pellet. Allow the solvent to evaporate completely in a dry atmosphere, forming a thin polymer film.
- Acquire FTIR spectrum in transmission mode (4000-400 cm⁻¹, 32 scans, 4 cm⁻¹ resolution).
- Correlation Analysis: Integrate characteristic NMR peaks (e.g., lactate CH at ~4.8 ppm) to calculate monomer ratios. Correlate this ratio with the relative intensity or area of corresponding FTIR bands (e.g., C-O-C stretches between 1300-1000 cm⁻¹) to develop a quantitative calibration model.
FTIR-GPC Correlation: Relating Structure to Molecular Weight
GPC provides molecular weight (Mw, Mn) and dispersity (Đ), while FTIR of fractionated eluents can identify compositional changes across the molecular weight distribution.
Table 2: Representative GPC Data with FTIR Insights for PLGA 75:25
| Sample ID | Mn (Da) | Mw (Da) | Đ (Mw/Mn) | FTIR Lactyl C-O Peak Ratio* (1180 cm⁻¹ / 1130 cm⁻¹) | Interpretation |
|---|---|---|---|---|---|
| PLGA-Batch-1 | 24,500 | 31,200 | 1.27 | 1.52 | Homogeneous composition across Mw distribution. |
| PLGA-Batch-2 | 32,000 | 48,600 | 1.52 | 2.15 (early eluent) → 1.05 (late eluent) | High Đ; FTIR indicates richer in lactide units in high Mw fraction. |
*Ratio is illustrative; requires calibration.
Protocol 2: FTIR Analysis of GPC Fractions
- Objective: Determine chemical composition across a polymer's molecular weight distribution.
- Materials: GPC system with fraction collector, volatile GPC solvent (e.g., THF, CHCl₃), IR-transparent windows (e.g., ZnSe).
- Procedure:
- Perform standard GPC analysis of the polymer solution (2-3 mg/mL).
- Using an automated fraction collector, collect 10-15 discrete eluent slices across the entire chromatogram.
- Carefully evaporate the solvent from each fraction under a gentle stream of dry nitrogen or in a vacuum oven.
- Re-dissolve each dried fraction in a minimal volume of a volatile solvent (e.g., 20 µL CHCl₃) and deposit it onto a ZnSe ATR crystal.
- After solvent evaporation, perform ATR-FTIR on each fraction.
- Correlation Analysis: Plot the intensity ratio of monomer-specific FTIR bands (e.g., 1180 cm⁻¹ for lactyl vs. 1130 cm⁻¹ for glycolyl in PLGA) against the elution volume or calculated molecular weight for each fraction to assess compositional homogeneity.
FTIR-DSC Correlation: Linking Chemistry to Thermal Properties
DSC measures thermal transitions (Tg, Tm, ΔH). FTIR can probe molecular-level changes (e.g., hydrogen bonding, crystallinity) associated with these transitions.
Table 3: Correlated DSC and FTIR Data for Polycaprolactone (PCL)
| Treatment | DSC Tm (°C) | ΔHm (J/g) | FTIR Crystallinity Index (CI)* | FTIR Spectral Shift (C=O stretch) |
|---|---|---|---|---|
| As-cast | 56.2 | 65.7 | 0.48 | 1722 cm⁻¹ |
| Annealed (45°C, 24h) | 59.8 | 72.3 | 0.62 | 1724 cm⁻¹ (sharpened) |
| Quenched | 52.1 | 45.5 | 0.31 | 1720 cm⁻¹ |
*CI = A₁₇₂₄/ (A₁₇₂₄ + A₁₇₃₆), where bands at ~1724 cm⁻¹ and ~1736 cm⁻¹ correspond to crystalline and amorphous C=O, respectively.
Protocol 3: In-Situ Variable-Temperature FTIR (VT-FTIR) Coupled with DSC
- Objective: Monitor real-time changes in polymer functional groups during thermal treatment.
- Materials: DSC instrument, FTIR spectrometer with temperature-controlled ATR accessory, thin polymer film.
- Procedure:
- Prepare a thin, uniform film of the polymer directly on the ATR crystal (or on a compatible thin film substrate).
- Place the ATR cell inside the temperature-controlled stage.
- Program a thermal ramp matching a typical DSC protocol (e.g., 10°C/min from 25°C to 100°C).
- At set temperature intervals (e.g., every 5°C), pause the ramp and acquire an FTIR spectrum (average of 16 scans).
- Perform a separate, standard DSC run on a separate but identically prepared sample using the same thermal protocol.
- Correlation Analysis: Plot the wavenumber or intensity of specific bands (e.g., C=O stretch, CH₂ rocking) as a function of temperature. Directly correlate inflection points or abrupt changes in these FTIR plots with the Tg or Tm observed in the DSC thermogram.
The Scientist's Toolkit: Research Reagent Solutions
Table 4: Essential Materials for Correlative Characterization of Biodegradable Polymers
| Item | Function/Application | Key Consideration |
|---|---|---|
| Deuterated Solvents (CDCl₃, DMSO-d₆) | Solvent for NMR analysis; can also be used for preparing FTIR films. | Must be anhydrous to prevent hydrolysis of polymers during analysis. |
| Anhydrous Potassium Bromide (KBr) | Matrix for preparing transmission FTIR pellets of solid samples. | Requires rigorous drying (e.g., 120°C overnight) to remove water interference. |
| High-Purity GPC Solvents (THF, CHCl₃) | Mobile phase for GPC analysis and fraction collection. | Must be HPLC-grade, stabilized, and filtered to prevent column degradation and artifacts. |
| ZnSe ATR Crystals | Substrate for ATR-FTIR analysis of solids, liquids, and films. | Chemically resistant to organic solvents but fragile; avoid acidic samples. |
| Temperature-Controlled ATR Stage | Enables VT-FTIR studies to correlate thermal events with spectral changes. | Calibration of stage temperature vs. sample temperature is critical. |
| Monodisperse Polystyrene Standards | Calibration of GPC for molecular weight determination. | Must be in the same solvent and matched to polymer conformation as closely as possible. |
| Indium Standard | Calibration of DSC for temperature and enthalpy accuracy. | Used to verify the DSC cell constant and temperature scale. |
Experimental Workflow & Pathway Diagrams
Multi-Technique Polymer Characterization Workflow
Resolving FTIR Ambiguity via Correlation Logic Tree
Within the broader thesis on Fourier-Transform Infrared (FTIR) spectroscopy for tracking biodegradable polymer functional groups, validating spectral changes against physical and mechanical degradation metrics is paramount. This application note provides integrated protocols for correlating FTIR-derived chemical group alterations with quantitative mass loss, qualitative SEM morphology, and mechanical property decay, establishing a robust framework for degradation profile validation.
Experimental Protocols
Protocol 2.1: Accelerated Hydrolytic Degradation Setup
Objective: To induce and monitor in vitro degradation under controlled, accelerated conditions.
- Sample Preparation: Die-cut polymer films (e.g., PLGA, PCL) into standardized discs (e.g., 10 mm diameter). Record initial dry mass (M₀) using a microbalance (accuracy ±0.01 mg).
- Buffer Incubation: Place individual samples in vials containing 10 mL of phosphate-buffered saline (PBS, pH 7.4, 0.1 M) with 0.02% w/v sodium azide (biocide).
- Incubation Conditions: Maintain vials in an orbital shaker incubator at 37 ± 1°C and 60 oscillations per minute.
- Sampling Time Points: Remove triplicate samples at predetermined intervals (e.g., 1, 3, 7, 14, 28, 56 days).
- Sample Recovery: Rinse retrieved samples thoroughly with deionized water and dry to constant mass in a vacuum desiccator before analysis.
Protocol 2.2: Mass Loss Determination
Objective: To quantify bulk erosion.
- Measure the constant dry mass (Mₜ) of each degraded sample.
- Calculate the percentage mass loss: Mass Loss (%) = [(M₀ - Mₜ) / M₀] × 100.
- Report mean ± standard deviation for triplicate samples.
Protocol 2.3: FTIR Spectroscopy for Functional Group Analysis
Objective: To track chemical bond scission and formation.
- Instrument: Use an FTIR spectrometer with ATR (Attenuated Total Reflectance) accessory.
- Acquisition Parameters: Resolution: 4 cm⁻¹; Scan range: 4000-650 cm⁻¹; Number of scans: 32.
- Baseline Correction: Apply a uniform linear or polynomial baseline correction to all spectra.
- Normalization: Normalize spectra to an internal reference band (e.g., C-H stretch at ~2850 cm⁻¹) that remains stable during degradation.
- Peak Monitoring: Identify and monitor key degradation-sensitive peaks (e.g., ester C=O stretch ~1750 cm⁻¹, hydroxyl O-H ~3400 cm⁻¹). Calculate relative peak area or height ratios against the reference band.
Protocol 2.4: Scanning Electron Microscopy (SEM) for Morphology
Objective: To visualize surface erosion and bulk morphological changes.
- Sample Preparation: Sputter-coat dried samples with a thin layer (5-10 nm) of gold/palladium using a sputter coater.
- Imaging: Use an SEM with an accelerating voltage of 5-10 kV. Capture images at multiple magnifications (e.g., 500x, 2000x, 5000x) to assess surface pitting, pore formation, cracks, and layer delamination.
- Analysis: Qualitatively describe erosion mode (surface vs. bulk).
Protocol 2.5: Mechanical Tensile Testing
Objective: To correlate chemical changes with functional property loss.
- Sample Preparation: Use dog-bone tensile bars (ASTM D638 Type V).
- Conditioning: Condition all samples in a controlled environment (e.g., 25°C, 50% RH) for 24h prior to testing.
- Testing: Perform uniaxial tensile testing using a universal testing machine.
- Parameters: Grip distance: as per standard; Crosshead speed: 1 mm/min or 10% strain/min; Pre-load: 0.1 N.
- Data Recorded: Record stress-strain curves until failure.
- Key Outputs: Calculate Young's Modulus (E), Ultimate Tensile Strength (UTS), and Elongation at Break (ε_b).
Data Presentation
Table 1: Correlative Degradation Data for PLGA (75:25) Over 8 Weeks
| Time Point (Weeks) | Mass Loss (%) | Ester C=O Peak Area Ratio (FTIR) | Young's Modulus (MPa) | Morphology (SEM) Description |
|---|---|---|---|---|
| 0 | 0.0 ± 0.0 | 1.00 ± 0.02 | 2200 ± 150 | Smooth, uniform surface |
| 2 | 5.2 ± 1.1 | 0.95 ± 0.03 | 2050 ± 120 | Initial surface pitting |
| 4 | 22.5 ± 3.4 | 0.82 ± 0.04 | 1450 ± 200 | Pronounced pores and cracks |
| 8 | 68.3 ± 5.7 | 0.45 ± 0.06 | 120 ± 30 | Highly porous, fragmented structure |
Table 2: Key FTIR Absorbance Bands for Degradation Monitoring
| Polymer | Key Functional Group | Wavenumber (cm⁻¹) | Trend During Hydrolysis | Interpretation |
|---|---|---|---|---|
| PLGA, PLA | Ester (C=O) Stretch | 1740-1760 | Decrease | Chain scission of backbone |
| PCL | Ester (C=O) Stretch | 1720 | Decrease | Chain scission of backbone |
| PGA | Ester (C=O) Stretch | 1740-1760 | Decrease | Chain scission |
| Most Polyesters | Aliphatic (C-H) Stretch | 2850-2950 | Stable | Internal reference peak |
| All | Hydroxyl (O-H) Stretch | 3200-3600 | Increase | Formation of carboxylic acid/alc. |
The Scientist's Toolkit: Research Reagent Solutions
| Item | Function/Application |
|---|---|
| Phosphate Buffered Saline (PBS), pH 7.4 | Simulates physiological ionic strength and pH for in vitro degradation. |
| Sodium Azide (NaN₃) | Biostatic agent to prevent microbial growth in long-term degradation studies. |
| ATR-FTIR Crystal (Diamond/ZnSe) | Enables direct, non-destructive surface analysis of solid polymer samples. |
| Gold/Palladium Sputtering Target | Provides conductive coating for non-conductive polymer samples for SEM imaging. |
| Universal Tensile Grips (Rubber-faced) | Prevents slippage and crushing of delicate, hydrated polymer films. |
| Vacuum Desiccator with P₂O₅ | Ensures complete and consistent drying of degraded samples for mass measurement. |
Diagrams
FTIR Degradation Validation Workflow
Interpreting FTIR Shifts with Physical Degradation
Comparative Analysis of Different FTIR Modes (Transmission vs. ATR) for Biomedical Polymers
This document, framed within a thesis on FTIR spectroscopy for biodegradable polymer functional group research, provides detailed application notes and protocols for the comparative analysis of Transmission and Attenuated Total Reflectance (ATR) FTIR modes. The choice of sampling technique profoundly impacts spectral quality, quantitative accuracy, and the feasibility of analyzing biomedical polymers, which range from soft hydrogels to rigid orthopedic implants.
Fundamental Principles & Comparative Framework
Transmission FTIR
In transmission mode, infrared light passes directly through a thin, uniformly prepared sample. The absorbance spectrum is calculated via the Beer-Lambert law. This method is considered the quantitative gold standard when sample thickness is known and controlled.
ATR-FTIR
ATR utilizes the phenomenon of total internal reflection. IR light travels through a high-refractive-index crystal (e.g., diamond, ZnSe) in contact with the sample. An evanescent wave penetrates a shallow depth (typically 0.5-5 µm) into the sample, absorbing its characteristic IR frequencies. This eliminates the need for extensive sample preparation.
Comparative Advantages and Limitations
The following table summarizes the core operational and analytical differences critical for biomedical polymer analysis.
Table 1: Comparative Analysis of Transmission vs. ATR FTIR Modes
| Parameter | Transmission FTIR | ATR-FTIR |
|---|---|---|
| Sample Preparation | Requires thin films (1-20 µm). KBr pellets or microtoming often needed. | Minimal. Direct contact with crystal; can analyze thick, irregular solids, gels, and liquids. |
| Sampling Depth | Bulk-dependent (entire film thickness, ~µm to mm). | Shallow, fixed by wavelength & crystal (~0.5-5 µm). Depth of Penetration (dp) = λ/[2πn₁√(sin²θ - (n₂/n₁)²)]. |
| Spectral Quality | High signal-to-noise for optimal films. Risk of scattering for uneven samples. | Weaker absorbance bands. Spectral distortion at lower wavenumbers (wavelength-dependent dp). Requires ATR correction. |
| Quantitative Analysis | Straightforward via Beer-Lambert law (A = εbc). | Complex due to depth dependence. Requires careful calibration and consistent pressure. |
| Sample Suitability | Homogeneous, soluble, or malleable polymers (e.g., PLLA, PCL films). | Surfaces, layered materials, hydrogels (e.g., collagen, pHEMA), viscous bio-inks, tissue scaffolds. |
| Key Artifacts | Absorption saturation, scattering, interference fringes. | Pressure-sensitive bands, contamination of crystal, moisture interference. |
| Typual Experiment Time | Longer (including prep). | Rapid (< minutes per sample). |
| Data Processing | Baseline correction, absorbance conversion. | ATR correction (compensates for dp∝λ), baseline correction. |
Experimental Protocols
Protocol: Transmission FTIR of a Biodegradable Polyester Film (e.g., PLLA)
Objective: To acquire a quantitative FTIR spectrum of a poly(L-lactic acid) film for carbonyl index calculation. Materials: PLLA pellets, hydraulic press, KBr powder, mortar and pestle, 13 mm die set, FTIR spectrometer with transmission cell.
- Film Preparation: Melt-press PLLA pellets between Teflon sheets at 180°C under 5 metric tons for 2 minutes, then quench-cool to create a ~50 µm film. Alternatively, cast a film from a chloroform solution onto a KBr window.
- Mounting: Secure the uniform film or KBr pellet in a standard transmission holder.
- Data Acquisition:
- Purge the spectrometer with dry air or N₂ for 10 minutes.
- Acquire a background spectrum (empty beam or clean KBr pellet).
- Insert the sample and collect spectrum over 4000-400 cm⁻¹.
- Parameters: 32 scans, 4 cm⁻¹ resolution.
- Data Processing: Convert to absorbance, subtract baseline (e.g., polynomial fit), and analyze peak heights/areas.
Protocol: ATR-FTIR of a Hydrated Polymer Hydrogel (e.g., Alginate)
Objective: To characterize the functional groups and monitor cross-linking on the surface of a calcium alginate hydrogel. Materials: Sodium alginate solution (2% w/v), CaCl₂ solution (100 mM), diamond/ZnSe ATR crystal, FTIR spectrometer with ATR accessory.
- Background Collection: Clean the ATR crystal with isopropanol and water, dry. With the clean crystal, collect a background spectrum under identical purge and parameter conditions.
- Sample Preparation: Deposit a droplet of sodium alginate solution directly onto the crystal.
- In-situ Cross-linking: Carefully add a small droplet of CaCl₂ solution at the edge, allowing diffusion to form a gel in-situ. Alternatively, analyze a pre-formed, blotted hydrogel disc.
- Data Acquisition: Apply consistent, firm pressure via the ATR clamp to ensure good optical contact.
- Parameters: 64 scans, 4 cm⁻¹ resolution. Increase scans for improved S/N in wet samples.
- Data Processing: Apply the spectrometer's ATR correction algorithm (based on crystal geometry and refractive index). Perform baseline correction. Compare alginate COO⁻ asymmetric stretch (~1600 cm⁻¹) and symmetric stretch (~1410 cm⁻¹) before/after cross-linking.
Data Interpretation & Application in Biomedical Research
Table 2: Key FTIR Band Assignments for Common Biomedical Polymers
| Polymer | Key Functional Group | Transmission Band (cm⁻¹) | ATR Band (cm⁻¹)* | Notes |
|---|---|---|---|---|
| Poly(lactic acid) (PLA) | C=O stretch | 1745-1755 | 1745-1755 | Crystallinity ratio from 955/870 cm⁻¹ bands. |
| Poly(ε-caprolactone) (PCL) | C=O stretch | 1720-1725 | 1720-1725 | |
| Poly(ethylene glycol) (PEG) | C-O-C stretch | 1100-1110 | 1100-1110 | Strong, broad band. |
| Alginate (ionic) | COO⁻ asym. stretch | ~1600 | ~1595-1605 | Shifts upon Ca²⁺ cross-linking. |
| Collagen | Amide I (C=O) | ~1650 | ~1645-1655 | Sensitive to secondary structure. |
| Chitosan | -NH₂ bend | ~1590 | ~1580-1590 | Overlaps with amide II. |
*ATR bands may show slight shifts (<10 cm⁻¹) vs. transmission due to the ATR effect and surface specificity.
Critical Consideration: ATR spectra exhibit stronger lower-wavenumber bands relative to higher ones compared to transmission. Direct spectral overlay requires application of ATR correction for valid comparison of band shapes and relative intensities.
Visualization of Workflow & Decision Logic
Title: FTIR Mode Selection Workflow for Polymer Analysis
Title: Transmission vs ATR Experimental Protocols
The Scientist's Toolkit: Research Reagent Solutions
Table 3: Essential Materials for FTIR Analysis of Biomedical Polymers
| Item | Function/Application | Key Considerations |
|---|---|---|
| Potassium Bromide (KBr), FTIR Grade | Matrix for preparing transmission pellets for solids. | Must be anhydrous; store in desiccator. Press under vacuum for clear pellets. |
| Diamond/ZnSe ATR Crystal | Internal reflection element for ATR accessory. | Diamond: durable, universal. ZnSe: avoid acidic/basic samples. Clean after each use. |
| Hydraulic Pellet Press | To prepare KBr pellets for transmission analysis. | Use with evacuable dies for optimal clarity. |
| FTIR Purge Gas Generator | Supplies dry air or N₂ to purge spectrometer. | Critical for removing atmospheric CO₂ and H₂O vapor interference. |
| Microtome (Cryo-) | To slice thin, uniform sections from polymer implants or tissue-polymer composites. | Enables transmission analysis of heterogeneous or cross-sectional samples. |
| ATR Clamp with Pressure Gauge | Applies consistent pressure to sample on ATR crystal. | Vital for reproducible ATR spectra, especially for soft polymers. |
| Spectroscopic Solvents (e.g., CDCl₃, D₂O) | For solution casting of films or analyzing polymer solutions in transmission cells. | Must be anhydrous and of spectroscopic purity. |
Introduction Within the broader research on characterizing biodegradable polymer functional groups, verifying the quality and consistency of commercial polymer feedstocks is a critical first step. Fourier-Transform Infrared (FTIR) spectroscopy serves as a primary, rapid, and non-destructive tool for this benchmarking, enabling the confirmation of polymer identity, detection of contaminants, and verification of lot-to-lot consistency from suppliers. This protocol details a systematic approach for using FTIR as part of a rigorous quality control (QC) and supplier verification system.
Experimental Protocols
Protocol 1: Standard Sample Preparation and Data Acquisition for Solid Polymers Objective: To obtain high-quality, reproducible FTIR spectra of solid polymer samples for analysis. Materials: FTIR spectrometer with DTGS or MCT detector, ATR accessory (diamond or germanium crystal), lab wipes, solvent (e.g., HPLC-grade isopropanol), forceps, scalpel or pellet press. Methodology:
- System Calibration: Perform background scan with clean ATR crystal.
- Sample Preparation:
- ATR Method (Preferred for QC): Cut a small, flat section of polymer (~2x2 mm). Clean the ATR crystal with solvent and dry. Place the sample on the crystal and use the pressure clamp to ensure firm, uniform contact.
- Transmission Method (for reference libraries): For films: Use a thin, uniform film (<100 µm). For pellets: Grind 1-2 mg of polymer with 100-200 mg of dry KBr powder; press into a clear pellet using a hydraulic press (10-15 tons for 1-2 minutes).
- Data Acquisition:
- Spectral range: 4000-400 cm⁻¹.
- Resolution: 4 cm⁻¹.
- Scans: 32-64 scans per sample to ensure a high signal-to-noise ratio.
- Ensure consistent pressure application for ATR measurements.
- Post-processing: Apply ATR correction (if required), baseline correction, and normalization (typically to a key peak at ~2915 cm⁻¹ for C-H stretch) using spectrometer software.
Protocol 2: Spectral Analysis and Benchmarking Against a Reference Library Objective: To compare acquired spectra against a validated in-house library for identity confirmation and detection of anomalies. Materials: Acquired sample spectrum, in-house FTIR spectral library of certified polymer materials, spectral analysis software (e.g., Omnic, SpectrumIR, OPUS, or open-source alternatives). Methodology:
- Library Development: Create a reference library using spectra from certified materials (e.g., from NIST) or thoroughly characterized batches from trusted suppliers. Include multiple lots to establish a acceptable spectral variance range.
- Qualitative Analysis:
- Visually inspect the sample spectrum for key functional group absorptions (see Table 1).
- Use the software’s search function to find the best match in the reference library.
- Report the Hit Quality Index (HQI) or correlation value. A value >0.95 typically indicates a high-confidence match.
- Difference Spectroscopy:
- Subtract the reference library spectrum from the sample spectrum.
- Analyze the difference spectrum for positive or negative peaks, indicating the presence of contaminants, additives, or compositional differences.
- Quantitative Analysis (for known additives or blends):
- Establish a calibration curve using peaks characteristic of the component of interest (e.g., a plasticizer ester C=O stretch at ~1740 cm⁻¹).
- Measure peak height or area and calculate concentration from the calibration curve.
Data Presentation
Table 1: Key FTIR Absorptions for Common Commercial (Bio)Polymers
| Polymer Type | Characteristic Peaks (cm⁻¹) | Functional Group Assignment |
|---|---|---|
| PLA (Polylactic Acid) | ~1749 (s), ~1180, ~1085 | Ester C=O, C-O-C |
| PHA (e.g., PHB) | ~1720 (s), ~1278, ~1057 | Ester C=O, -CH- |
| PCL (Polycaprolactone) | ~1720 (s), ~1295, ~1165 | Ester C=O, C-O-C |
| Cellulose Acetate | ~1745 (s), ~1235, ~1035 | Ester C=O, C-O-C |
| Polyethylene (PE) | ~2915, ~2848, ~1470, ~718 | -CH₂- asymmetric/symmetric stretch, bend |
| Polypropylene (PP) | ~2950, ~2915, ~2870, ~1455, ~1376 | -CH₃, -CH₂- stretches, bends |
| PVC (Polyvinyl Chloride) | ~1250-700 (broad), ~1420, ~1330 | C-Cl stretches, -CH₂- |
Table 2: Benchmarking Results for Three Supplier Lots of PLGA (75:25)
| Supplier Lot | HQI vs. Reference | C=O Peak Pos. (cm⁻¹) | Ester C-O Peak Pos. (cm⁻¹) | Notable Differences | Pass/Fail (vs. Spec) |
|---|---|---|---|---|---|
| A-001 | 0.991 | 1749.2 | 1083.5 | None detected | Pass |
| B-455 | 0.978 | 1748.9 | 1083.7 | Small peak at ~1715 cm⁻¹ (free acid?) | Flag for Review |
| C-7X2 | 0.943 | 1752.5 | 1089.1 | Broad OH stretch ~3400 cm⁻¹, shifted peaks | Fail |
Mandatory Visualization
Title: FTIR QC Workflow for Polymer Verification
The Scientist's Toolkit: Essential Research Reagent Solutions & Materials
| Item | Function in FTIR Polymer Benchmarking |
|---|---|
| ATR Accessory (Diamond Crystal) | Enables direct, minimal-prep analysis of solid polymers by measuring attenuated total reflectance. |
| Hydraulic Pellet Press | Prepares potassium bromide (KBr) pellets for transmission-mode FTIR, the gold standard for library spectra. |
| HPLC-Grade Solvents (IPA, Acetone) | For cleaning the ATR crystal and preparation tools without leaving residue. |
| Certified Reference Materials (PLA, PCL, etc.) | Provides the ground-truth spectra for building and validating the in-house reference library. |
| Background Reference Material | A non-absorbing standard (e.g., clean ATR crystal, air) for collecting the background scan. |
| Spectral Analysis Software | Performs searches, subtractions, peak picking, and quantitative calculations essential for benchmarking. |
| High-Resolution FTIR Spectrometer | Core instrument; a system with 4 cm⁻¹ resolution and a DTGS detector is typically sufficient for polymer QC. |
Establishing FTIR as a Key Tool in Regulatory Submissions for Biomedical Devices and Drug Delivery Systems
Fourier-Transform Infrared (FTIR) spectroscopy is an indispensable analytical technique for characterizing biodegradable polymers used in biomedical applications. Within regulatory frameworks (e.g., FDA, EMA), chemistry, manufacturing, and controls (CMC) documentation requires robust evidence of material identity, consistency, and degradation profiles. This application note details standardized protocols for using FTIR to generate submission-ready data, framed within ongoing research on tracking functional group evolution in poly(lactic-co-glycolic acid) (PLGA), polycaprolactone (PCL), and their composites.
Application Notes
Note 1: Polymer Identity and Batch-to-Batch Consistency FTIR provides a fingerprint for polymer identification. Regulatory submissions must demonstrate raw material consistency. Shifts in characteristic peak ratios (e.g., C=O stretch at ~1750 cm⁻¹ for polyesters) can indicate lot variations or residual monomer content.
Note 2: Monitoring In Vitro Degradation The hydrolytic degradation of aliphatic polyesters is tracked via the evolution of key functional groups. An increase in hydroxyl group absorbance (O-H stretch, 3200-3600 cm⁻¹) and a decrease in ester linkage peak area (C-O-C stretch, ~1050-1300 cm⁻¹) quantitatively signal chain scission.
Note 3: Drug-Polymer Interaction Analysis FTIR can reveal non-covalent interactions in drug delivery systems. Shifts in drug-specific peaks (e.g., amine, carbonyl) upon incorporation into a polymer matrix indicate potential hydrogen bonding or ionic interactions, critical for predicting release kinetics and stability.
Note 4: Surface Modification Verification For coated devices, FTIR in ATR (Attenuated Total Reflectance) mode confirms the presence of surface-modifying agents (e.g., PEG, peptides) by detecting unique functional groups not present in the bulk polymer.
Experimental Protocols
Protocol 1: Standardized Sample Preparation for PLGA Film Analysis
Objective: To prepare reproducible thin films for transmission FTIR analysis of PLGA. Materials: PLGA resin, dichloromethane (HPLC grade), potassium bromide (KBr) windows, vacuum desiccator. Procedure:
- Dissolve 100 mg of PLGA in 10 mL of dichloromethane to create a 1% (w/v) solution.
- Cast 200 µL of the solution onto a clean, leveled KBr window.
- Allow solvent evaporation under ambient conditions for 1 hour, followed by 24 hours in a vacuum desiccator to remove residual solvent.
- Mount the film-secured window in the FTIR transmission holder. FTIR Parameters: Resolution: 4 cm⁻¹; Scans: 64; Range: 4000-400 cm⁻¹.
Protocol 2:In VitroDegradation Monitoring of PCL Scaffolds
Objective: To quantify ester bond loss in PCL during hydrolytic degradation. Materials: PCL scaffold discs, phosphate-buffered saline (PBS, pH 7.4), incubator shaker at 37°C, vacuum oven. Procedure:
- Weigh initial mass of PCL scaffold (n=5).
- Immerse scaffolds in PBS and place in a 37°C incubator shaker.
- At predetermined time points (e.g., 1, 4, 12 weeks), remove samples, rinse with DI water, and dry to constant mass in a vacuum oven.
- Analyze each dried scaffold via ATR-FTIR.
- Integrate the area of the ester C=O stretch peak (~1720 cm⁻¹) and the aliphatic C-H stretch peak (~2940 cm⁻¹, as an internal reference). Calculate the normalized C=O peak area ratio (C=O/C-H). FTIR Parameters (ATR): Resolution: 4 cm⁻¹; Scans: 32; Contact pressure: consistent.
Protocol 3: Detecting Drug-Polymer Interactions in a Loaded Microsphere
Objective: To identify potential molecular interactions between a model drug (Dexamethasone) and PLGA. Materials: Dexamethasone, PLGA, blank PLGA microspheres, dexamethasone-loaded PLGA microspheres (prepared via emulsion), mortar and pestle. Procedure:
- Grind microsphere samples (blank and loaded) with dry KBr powder (1:100 ratio) into a fine, homogeneous mixture.
- Prepare a standard physical mixture of dexamethasone and blank microsphere powder at the theoretical load.
- Compress mixtures into KBr pellets under 10-ton pressure.
- Acquire FTIR spectra for pure dexamethasone, blank PLGA, the physical mixture, and the loaded microsphere formulation.
- Overlay spectra, focusing on the dexamethasone carbonyl (~1660 cm⁻¹) and hydroxyl regions, noting any peak shifts or broadening in the loaded formulation compared to the physical mixture.
Data Presentation: Key Quantitative Metrics
Table 1: Characteristic FTIR Peaks for Common Biodegradable Polymers
| Polymer | Key Functional Group | Wavenumber (cm⁻¹) | Peak Assignment | Regulatory Use |
|---|---|---|---|---|
| PLGA | Carbonyl (C=O) | 1740-1760 | Ester stretch | Identity, Purity |
| PLGA | Ester (C-O-C) | 1080-1300 | C-O stretch | Degradation Monitor |
| PCL | Carbonyl (C=O) | 1720 | Ester stretch | Identity, Crystallinity |
| PCL | Methylene (CH₂) | 2940, 2865 | C-H stretch | Internal Reference |
| PGA | Carbonyl (C=O) | ~1710 | Ester stretch | Copolymer Ratio |
| PLA | Carbonyl (C=O) | ~1750 | Ester stretch | Enantiomer Content |
Table 2: Example Degradation Data for PCL (12 Weeks In Vitro)
| Time Point (weeks) | Normalized C=O/C-H Ratio (Mean ± SD) | Mass Loss (%) | Visual Observation (from Search) |
|---|---|---|---|
| 0 | 1.00 ± 0.05 | 0.0 | Smooth, opaque surface |
| 4 | 0.97 ± 0.04 | 2.1 ± 0.5 | Slight surface pitting |
| 8 | 0.91 ± 0.06 | 5.8 ± 1.2 | Increased porosity |
| 12 | 0.83 ± 0.07 | 12.5 ± 2.3 | Significant erosion, fragile |
The Scientist's Toolkit: Essential Research Reagents & Materials
| Item | Function in FTIR Analysis |
|---|---|
| Potassium Bromide (KBr), FTIR Grade | Hygroscopic salt used for preparing transparent pellets for transmission analysis of powdered samples. |
| Dichloromethane (DCM), HPLC Grade | Common solvent for casting thin polymer films; high purity minimizes interfering absorbance bands. |
| ATR Crystal (Diamond/ZnSe) | Durable crystal for ATR mode sampling, enabling direct analysis of solids, gels, and surfaces without preparation. |
| Vacuum Desiccator | Removes absorbed water from samples and KBr, preventing spectral interference from broad O-H stretches. |
| Polymer Reference Standards (USP) | Certified PLGA, PCL, etc., for calibrating instruments and establishing benchmark spectra for regulatory comparisons. |
| Phosphate Buffered Saline (PBS) | Standard medium for conducting in vitro degradation studies under physiologically relevant conditions. |
Visualized Workflows & Relationships
FTIR Workflow from Sample to Regulatory Output
Connecting Research Thesis to Regulatory Applications
Conclusion
FTIR spectroscopy remains a cornerstone analytical technique for the development and quality assurance of biodegradable polymers in biomedical research. By mastering foundational spectral interpretation, robust methodological applications, and systematic troubleshooting, researchers can unlock deep insights into polymer chemistry, degradation behavior, and batch consistency. Its true power is realized when FTIR data is validated and correlated with complementary techniques like NMR, DSC, and GPC, creating a comprehensive material profile essential for regulatory approval and clinical translation. Future directions point toward increased automation, advanced computational analysis of spectral data, and the integration of in-situ FTIR for real-time monitoring of polymer performance in complex biological environments, further solidifying its role in the next generation of smart, responsive biomaterials.