Computational Design of Molecularly Imprinted Polymers: From AI-Powered Virtual Screening to Biomedical Applications
This article provides a comprehensive guide for researchers and drug development professionals on the computational design of molecularly imprinted polymers (MIPs).
Computational Design of Molecularly Imprinted Polymers: From AI-Powered Virtual Screening to Biomedical Applications
Abstract
This article provides a comprehensive guide for researchers and drug development professionals on the computational design of molecularly imprinted polymers (MIPs). We begin by exploring the fundamental principles of molecular imprinting and the critical role of computation in transitioning from trial-and-error to rational design. The core methodological section details the workflow, from virtual screening of monomers and cross-linkers using density functional theory (DFT) and molecular dynamics (MD) to the prediction of polymer morphology and binding site distribution. We address common computational pitfalls, optimization strategies for enhancing selectivity and affinity, and methods to simulate real-world conditions. Finally, the article covers the validation of computational models through experimental techniques like SPR and QCM, and compares MIP performance against natural antibodies and aptamers. The conclusion synthesizes key takeaways and outlines future directions for personalized medicine, point-of-care diagnostics, and therapeutic delivery systems.
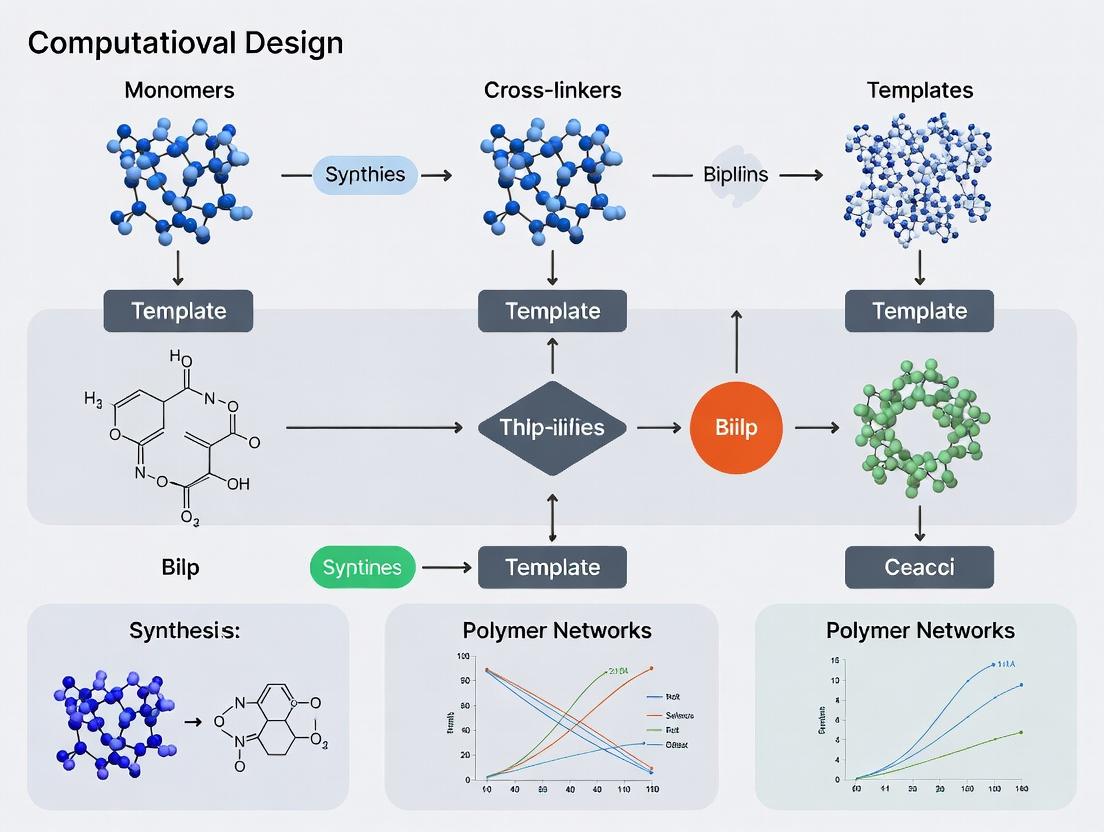
Molecular Imprinting 2.0: The Computational Foundation for Rational MIP Design
Molecularly imprinted polymers (MIPs) are synthetic polymeric networks possessing specific recognition sites complementary to a target molecule (template) in shape, size, and functional group orientation. Their synthesis involves copolymerization of functional and cross-linking monomers in the presence of the template. Subsequent template removal leaves cavities with a "memory," enabling selective rebinding. This application note details their computational design, synthesis protocols, and key applications within drug development, providing researchers with actionable methodologies.
Within the thesis on computational design, MIPs represent the tangible output of in silico predictions. Computational tools (e.g., molecular dynamics, density functional theory) are employed to screen monomers, simulate pre-polymerization complexes, and predict binding affinity and selectivity before synthesis. This rational design approach minimizes costly empirical trial-and-error, accelerating the development of MIPs as "synthetic antibodies" for sensing, separations, and drug delivery.
Application Notes & Quantitative Performance
Table 1: Comparative Performance of Computationally Designed MIPs in Analytical Applications
| Target Analyte (Template) | Computed Binding Energy (ΔG, kcal/mol) | Experimental Binding Affinity (Kd, nM) | Selectivity Factor (vs. Structural Analog) | Primary Application |
|---|---|---|---|---|
| Cortisol | -8.2 | 0.45 | 12.5 | Diagnostic Sensors |
| Enrofloxacin | -9.7 | 1.8 | 9.3 | Food Safety Assays |
| Lysozyme | -10.5 | 2.1 | 15.8 | Protein Separation |
| Theophylline | -7.5 | 85.0 | 22.0 (vs. Caffeine) | Therapeutic Monitoring |
Table 2: Key Advantages of Computational MIP Design
| Parameter | Traditional Combinatorial Screening | Computational Pre-Screening | Improvement Factor |
|---|---|---|---|
| Time to optimal monomer selection | 4-6 weeks | 1-2 weeks | ~3-4x |
| Material consumption (monomers/solvents) | High | Very Low | >10x reduction |
| Success rate (Kd < 10 nM) | ~15% | ~60% | ~4x |
| Optimal cross-linker ratio prediction accuracy | ± 25% | ± 8% | ~3x precision |
Detailed Experimental Protocols
Protocol 3.1:In SilicoMonomer Screening for a Small-Molecule Target
Objective: To identify the most promising functional monomer for MIP synthesis targeting a specific template.
- Template Preparation: Obtain the 3D structure (SDF/MOL file) of the target molecule (e.g., from PubChem). Optimize its geometry using DFT (e.g., Gaussian, B3LYP/6-31G* basis set).
- Monomer Library: Create a digital library of common functional monomers (e.g., methacrylic acid, acrylamide, vinylpyridines).
- Docking Simulation: Use molecular docking software (AutoDock Vina, GOLD) or molecular dynamics (GROMACS) to simulate template-monomer interactions in a defined virtual solvent box.
- Scoring & Ranking: Calculate the binding free energy (ΔG) for each complex. Rank monomers based on the most negative ΔG, indicating strongest interaction.
- Complex Optimization: Take the top 3 monomers and simulate pre-polymerization ternary complexes (template:monomer:cross-linker) to assess stability.
Title: Computational Monomer Screening Workflow
Protocol 3.2: Solid-Phase Synthesis of MIP Nanoparticles (Core-Shell Format)
Objective: To synthesize uniform MIP nanoparticles with high binding capacity using a solid-phase imprinting approach. Materials: See "Scientist's Toolkit" below. Procedure:
- Silica Core Functionalization: Disperse 1.0 g of amino-functionalized silica nanoparticles (200 nm) in 50 mL anhydrous DMSO. Add 2 mL of template-acrylate derivative (e.g., cortisol methacrylate). React under N₂ with gentle shaking for 24h at 25°C. Wash extensively with methanol/acetic acid (9:1 v/v) to remove physisorbed template.
- Surface-Initiated Polymerization: Re-disperse template-functionalized cores in 40 mL acetonitrile in a three-neck flask. Add the computationally pre-selected functional monomer (e.g., methacrylic acid, 4 mmol) and cross-linker (ethylene glycol dimethacrylate, 20 mmol). Degas with N₂ for 15 min.
- Initiation: Add the initiator (AIBN, 0.2 mmol). React under N₂ at 60°C for 24h with mechanical stirring.
- Core Etching & Template Removal: Recover nanoparticles by centrifugation. Re-suspend in 50 mL of 4M ammonium hydrogen fluoride solution and stir for 48h to etch the silica core. Dialyze the resulting hollow MIP shells against water for 5 days. Perform a final wash with methanol/acetic acid (8:2 v/v) to ensure complete template removal. Characterize by DLS and SEM.
Title: Solid-Phase MIP Nanoparticle Synthesis
The Scientist's Toolkit: Key Reagents & Materials
| Item & Specification | Function in MIP Development | Rationale |
|---|---|---|
| Methacrylic Acid (MAA), 99% | Primary functional monomer for H-bond/donor-acceptor templates. | Versatile, strong carboxylic acid interaction group; predicted frequently by computation for basic/neutral targets. |
| Ethylene Glycol Dimethacrylate (EGDMA), 98% | Cross-linking monomer. | Provides mechanical stability and defines cavity rigidity. Computational MD predicts optimal EGDMA ratio for porosity. |
| 2,2'-Azobis(2-methylpropionitrile) (AIBN), recrystallized | Thermal radical initiator. | Standard for polymerization in organic solvents at 60-70°C; ensures reproducible initiation. |
| Amino-functionalized Silica Nanoparticles (200nm) | Solid-phase sacrificial core. | Enables uniform spherical MIP shell formation; etched to leave controlled, accessible cavities. |
| Acetonitrile (HPLC Grade) | Porogenic solvent. | Common non-protic solvent for non-covalent imprinting; affects polymer morphology and template-monomer interaction strength. |
| Molecular Modeling Suite (e.g., Schrödinger, AutoDock Tools) | In silico screening platform. | Enables virtual screening of monomer libraries and prediction of binding site geometry prior to synthesis. |
Within the thesis on the computational design of molecularly imprinted polymers (MIPs), this application note details the quantitative and procedural limitations of the traditional, empirical development approach. The transition from this costly trial-and-error paradigm to a rational, computationally guided workflow is imperative for advancing MIP applications in diagnostics, sensing, and drug development.
Quantitative Analysis of Traditional MIP Development Costs
The traditional MIP development cycle involves iterative screening of monomers, cross-linkers, porogens, and polymerization conditions. The resource expenditure is substantial, as summarized in Table 1.
Table 1: Resource Allocation in a Traditional Empirical MIP Development Project
| Development Phase | Average Time (Weeks) | Approximate Material Cost (USD) | Number of Synthesis Iterations (Typical Range) | Success Rate for High-Performance MIPs (%) |
|---|---|---|---|---|
| Template & Monomer Selection | 2-3 | 500 - 2,000 | 10 - 30 (theoretical) | < 5 |
| Polymerization & Optimization | 6-10 | 3,000 - 8,000 | 50 - 200 | 10 - 20 |
| Characterization & Validation | 4-6 | 2,000 - 5,000 | 10 - 50 | 30 - 50 |
| Total Per Target | 12-19 | 5,500 - 15,000 | 70 - 280 | ~1-3 (Final) |
The Traditional Trial-and-Error Workflow Protocol
The following protocol exemplifies the standard empirical approach for developing a MIP for a small-molecule target (e.g., a pharmaceutical contaminant).
Protocol: Empirical Screening of Functional Monomers
Objective: To identify a suitable functional monomer for a target molecule via bulk polymerization and binding assessment.
Materials: See "The Scientist's Toolkit" (Section 6).
Procedure:
- Template-Monomer Complex Preparation:
- Dissolve the target template molecule (0.05 mmol) and one candidate functional monomer (0.2 mmol) in 5 mL of selected porogen (e.g., acetonitrile or chloroform) in a glass vial.
- Seal the vial and incubate at 4°C for 2 hours to allow pre-complexation.
- Bulk Polymerization:
- To the mixture, add cross-linker (e.g., EGDMA, 1.0 mmol) and radical initiator (e.g., AIBN, 0.02 mmol). Purge the solution with nitrogen or argon for 5 minutes to remove oxygen.
- Seal the vial and place it in a water bath or thermal block at 60°C for 18-24 hours.
- Polymer Processing:
- Crush the resulting monolithic polymer block and grind it mechanically.
- Sieve the particles to obtain a 25-50 μm fraction.
- Perform Soxhlet extraction with methanol:acetic acid (9:1, v/v) for 24 hours to remove the template molecule.
- Dry the resulting MIP particles under vacuum at 40°C overnight.
- Batch Rebinding Test:
- Weigh 10 mg of dry MIP into a 2 mL HPLC vial.
- Add 1 mL of a solution containing the template at a known concentration (e.g., 0.1 mM in the porogen).
- Agitate the suspension on a shaker for 6 hours at room temperature.
- Centrifuge and filter the supernatant. Analyze the free template concentration using HPLC-UV.
- Calculate the amount of template bound to the polymer (Q = (Cinitial - Cfree) * V / m).
- Control Experiment: Repeat steps 1-4 using the Non-Imprinted Polymer (NIP), synthesized identically but in the absence of the template.
- Analysis: Calculate the imprinting factor (IF) = QMIP / QNIP. An IF > 1.5 is typically considered indicative of successful imprinting. Repeat the entire process for each candidate monomer (e.g., MAA, 4-VP, acrylamide).
Protocol: Optimization of Polymerization Conditions
Objective: To empirically optimize the ratio of monomer:cross-linker:porogen for the best-performing monomer from Protocol 3.1.
Procedure:
- Design a factorial matrix varying:
- Monomer:Template ratio (e.g., 2:1, 4:1, 8:1)
- Cross-linker percentage (e.g., 70%, 80%, 90% mol relative to monomer)
- Porogen type (e.g., acetonitrile, toluene, dimethyl sulfoxide)
- Synthesize MIPs and NIPs for each condition in the matrix using the bulk polymerization method (Steps 2-3 from Protocol 3.1).
- Perform batch rebinding tests (Protocol 3.1, Step 4) for all polymers.
- Select the condition yielding the highest imprinting factor and binding capacity. This process typically requires 20-50 parallel syntheses and analyses.
Visualizing the Costly Empirical Cycle
The iterative, non-predictive nature of traditional MIP development leads to a resource-intensive cycle with a low probability of success.
Diagram Title: The Costly Empirical MIP Development Cycle
Key Limitations & Data on Failed Iterations
The empirical approach's inefficiency is further highlighted by data on common failure points.
Table 2: Common Failure Modes in Traditional MIP Development
| Failure Mode | Frequency (% of Iterations) | Consequence | Primary Cause |
|---|---|---|---|
| Poor Binding Affinity | 40-60% | Low imprinting factor (IF < 1.5) | Incorrect monomer-template interaction or stoichiometry |
| Inadequate Selectivity | 20-30% | High cross-reactivity with analogs | Poor spatial fidelity of imprinted cavity |
| Template Leaching/Incomplete Removal | 10-15% | High background, false positives | Irreversible binding or physical entrapment |
| Low Batch-to-Batch Reproducibility | 15-25% | Inconsistent performance data | Sensitive dependence on subtle variations in procedure |
| Poor Morphology/Kinetics | 10-20% | Slow binding, low capacity | Suboptimal porogen and cross-linker choice |
The Scientist's Toolkit: Key Reagents for Traditional MIP Development
Table 3: Essential Research Reagent Solutions for Empirical MIP Development
| Reagent / Material | Typical Function in MIP Synthesis | Notes & Common Examples |
|---|---|---|
| Functional Monomers | Provide complementary interactions with the target template (non-covalent imprinting). | Methacrylic acid (MAA, H-bond donor/acceptor), 4-Vinylpyridine (4-VP, base), Acrylamide (H-bond donor). Large libraries exist for screening. |
| Cross-linkers | Create a rigid, porous polymer network that stabilizes the imprinted cavities. | Ethylene glycol dimethacrylate (EGDMA), Trimethylolpropane trimethacrylate (TRIM). High purity (>98%) is critical for reproducibility. |
| Porogens (Solvents) | Dissolve all components and dictate polymer morphology (pore size and surface area). | Acetonitrile (polar, aprotic), Chloroform (non-polar, H-bonding), Toluene (non-polar). Choice is largely empirical. |
| Radical Initiators | Initiate the free-radical polymerization reaction. | Azoisobutyronitrile (AIBN), activated thermally (60-70°C). Must be purified by recrystallization. |
| Template Molecules | The target analyte around which the complementary cavity is formed. | Often expensive/pharmaceuticals. Must be soluble in porogen and stable during polymerization. |
| Extraction Solvents | Remove the template molecule from the polymer post-synthesis to reveal binding sites. | Methanol:Acetic Acid (9:1 v/v) is standard for breaking non-covalent interactions. |
Computational Design as the Rational Alternative
The thesis posits that integrating computational tools—such as molecular dynamics (MD) simulations and density functional theory (DFT) calculations for monomer screening, and molecular modeling for cavity design—into the workflow directly addresses the limitations outlined above. This rational approach aims to replace the initial, costly empirical cycles with in silico prediction, dramatically reducing the number of physical experiments required to arrive at an optimal MIP formulation.
The traditional development of Molecularly Imprinted Polymers (MIPs) has been plagued by a laborious, Edisonian trial-and-error approach. The broader thesis of this work posits that integrating computational chemistry at the outset of MIP design fundamentally shifts the paradigm from empirical screening to rational, first-pass design. This approach enables the in silico prediction of monomer-template interactions, polymer composition, and binding site characteristics before synthesis, drastically reducing development time and cost while improving MIP performance for applications in drug sensing, separation, and delivery.
Application Notes: Core Computational Workflows
Note 1: Virtual Screening of Functional Monomers
Objective: To identify the most promising functional monomers for a given target molecule (template) through computational screening. Protocol: Using density functional theory (DFT) or molecular mechanics, calculate the binding energy (ΔE) between the template and a library of candidate monomers (e.g., methacrylic acid, acrylamide, vinylpyridine) in a simulated solvent environment. The formation of pre-polymerization complexes is modeled, and interaction energies are ranked.
Table 1: Exemplar Virtual Screening Results for Theophylline Imprinting
| Monomer | Calculated ΔE (kJ/mol) | Primary Interaction Type | Recommended Mole Ratio (Monomer:Template) |
|---|---|---|---|
| Methacrylic Acid (MAA) | -28.5 | Hydrogen bonding | 4:1 |
| Acrylamide (AAM) | -24.1 | Hydrogen bonding | 6:1 |
| 2-Vinylpyridine (2-VP) | -19.7 | Ionic/van der Waals | 8:1 |
| Itaconic Acid (IA) | -26.8 | Hydrogen bonding | 4:1 |
| Trifluoromethylacrylic Acid (TFMAA) | -31.2 | Strong H-bond/Electrostatic | 4:1 |
Note 2: Molecular Dynamics (MD) Simulations of Polymerization
Objective: To simulate the cross-linking process and predict the morphology and stability of the polymer matrix. Protocol: Construct a simulation box containing the template-monomer complex(es), cross-linker (e.g., ethylene glycol dimethacrylate - EGDMA), initiator molecules, and solvent. Run MD simulations under periodic boundary conditions, applying a simulated temperature and pressure cycle to mimic thermo-initiated polymerization. Analyze the resulting polymer network for porosity, cross-link density, and template distribution.
Table 2: MD Simulation Parameters and Outputs for a Standard MIP System
| Parameter | Value/Description | Relevance to MIP Design |
|---|---|---|
| Force Field | GAFF2 or OPLS-AA | Describes interatomic potentials |
| Simulation Time | 50-100 ns | Allows for network formation |
| Cross-linker % (Simulated) | 70-80 mol% | Governs matrix rigidity & site stability |
| Calculated Average Pore Size | 1.5 - 3.0 nm | Indicates accessibility for target |
| Template Entrapment Efficiency (Simulated) | ~85% | Predicts success of imprinting step |
Note 3: Binding Affinity and Selectivity Prediction
Objective: To computationally assess the binding strength and selectivity of the designed MIP for the target versus structural analogs. Protocol: After simulating template removal, use molecular docking or free energy perturbation (FEP) methods to compute the binding free energy (ΔG) of the target and competing molecules to the imprinted cavity. A lower (more negative) ΔG indicates stronger binding.
Table 3: Computed Binding Free Energies for a Propranolol MIP and Analogues
| Ligand | Computed ΔG (kcal/mol) | Selectivity Factor (vs. Atenolol) | Key Interaction Residues in Cavity |
|---|---|---|---|
| Propranolol (Target) | -8.24 | 1.00 (Reference) | Carboxyl, aromatic π-stacking |
| Atenolol | -5.91 | 3.9 | Weak H-bond only |
| Metoprolol | -7.05 | 1.7 | Partial H-bond, weaker π-stack |
| Warfarin | -6.32 | 2.6 | Mismatched geometry |
Experimental Protocols for Validation
Protocol 1: Synthesis of Computationally-Designed MIPs
Materials: See "The Scientist's Toolkit" below. Method:
- Pre-complexation: Dissolve the template (0.25 mmol) and the computationally selected optimal monomer (at the recommended mole ratio from Table 1) in 10 mL of the designated porogenic solvent (e.g., acetonitrile) in a glass vial. Sonicate for 10 minutes.
- Polymerization Mixture: Add the cross-linker (EGDMA, total monomer molar percentage as per simulation, e.g., 80%) and initiator (AIBN, 1% w/w of total monomers) to the vial. Sparge with nitrogen for 5 minutes to remove oxygen.
- Polymerization: Seal the vial and place it in a water bath at 60°C for 24 hours.
- Processing: Crush the resulting bulk polymer and sieve to 25-50 μm particles.
- Template Extraction: Wash particles sequentially with methanol/acetic acid (9:1, v/v) until no template is detectable by UV-Vis (typically 8-10 cycles), followed by methanol to neutrality. Dry under vacuum at 40°C.
Protocol 2: Binding Isotherm Analysis and Characterization
Method:
- Batch Rebinding: Suspend 10 mg of dry MIP or Non-Imprinted Polymer (NIP, control) in 2 mL of solutions containing the template at varying concentrations (0.05 - 2.0 mM) in a suitable buffer.
- Equilibration: Agitate for 6 hours at 25°C.
- Quantification: Separate polymer by centrifugation (13,000 rpm, 5 min). Analyze supernatant concentration via HPLC-UV.
- Data Fitting: Calculate bound amount (Q). Fit data to the Langmuir isotherm model:
Q = (Q_max * C) / (K_d + C), whereQ_maxis the apparent maximum number of binding sites andK_dis the dissociation constant.
Validation: Compare experimental K_d and Q_max with computationally predicted binding affinity trends and site density estimates.
Visualizations
Title: Computational MIP Design & Validation Workflow
Title: From Virtual Screening to Binding Site
The Scientist's Toolkit: Essential Research Reagent Solutions
| Item | Function in Computational MIP Development |
|---|---|
| Software Suite (e.g., Schrödinger, Gaussian, GROMACS) | Provides platforms for DFT, molecular dynamics, and docking simulations to model interactions and polymer networks. |
| High-Performance Computing (HPC) Cluster | Enables the processing of large-scale molecular dynamics simulations and virtual screenings in a feasible timeframe. |
| Functional Monomer Library (e.g., MAA, 4-VP, AAM) | A curated set of compounds for virtual screening to identify optimal template-monomer interactions. |
| Cross-linker (EGDMA, TRIM, DVB) | Modeled in MD simulations to determine optimal percentage for creating a rigid, porous polymer scaffold. |
| Porogenic Solvent (Acetonitrile, Toluene, Chloroform) | The solvent environment is a critical variable in simulations, affecting complex formation and pore morphology. |
| Molecularly Imprinted Polymer Particles (Validated) | The final synthesized material used for experimental validation of computational predictions (binding isotherms, selectivity). |
| HPLC-UV/MS System | Essential for quantifying template concentration during extraction efficiency studies and binding experiments. |
| Reference Analogue Molecules | Used in both computational selectivity predictions and experimental cross-reactivity assays. |
Within the broader thesis on the computational design of molecularly imprinted polymers (MIPs), the integration of Density Functional Theory (DFT), Molecular Dynamics (MD), and Molecular Docking has emerged as a critical paradigm. This computational toolbox enables the in silico screening of functional monomers, the rational design of cross-linkers, and the prediction of template-polymer binding affinity and specificity before synthesis. This shifts MIP development from a trial-and-error process to a rational, computationally guided engineering discipline, accelerating the creation of synthetic receptors for sensing, separation, and drug development.
Application Notes
Density Functional Theory (DFT): Electronic Structure for Monomer Selection
DFT calculations are used to evaluate the fundamental interactions between the template molecule (target) and candidate functional monomers. The primary goal is to predict the binding energy and optimal interaction geometry in the pre-polymerization complex.
Key Applications:
- Binding Energy Calculation: Computing the interaction energy (ΔE) between the template and monomer in the gas phase or implicit solvent models to rank monomer efficacy.
- Intermolecular Interaction Analysis: Identifying specific non-covalent interactions (hydrogen bonds, π-π stacking, electrostatic) that stabilize the complex.
- Charge Distribution Analysis: Using Mulliken or Natural Population Analysis (NPA) charges to understand electrostatic complementarity.
Recent Data (2023-2024): Studies on antibiotic and mycotoxin templates show computed binding energies correlate strongly (R² > 0.85) with experimental binding capacities for monomers like methacrylic acid (MAA), 4-vinylpyridine (4-VP), and acrylamide derivatives.
Table 1: DFT-Calculated Binding Energies for Common MIP Monomers with Template Vanillin
| Functional Monomer | Calculated ΔE (kJ/mol) | Key Interaction Type | Reference Year |
|---|---|---|---|
| Methacrylic Acid (MAA) | -42.7 | Hydrogen bonding | 2023 |
| 4-Vinylpyridine (4-VP) | -28.3 | π-π stacking / weak H-bond | 2023 |
| Acrylamide | -38.9 | Strong hydrogen bonding | 2024 |
| 2-Hydroxyethyl methacrylate (HEMA) | -25.1 | Moderate H-bonding | 2024 |
Molecular Dynamics (MD): Simulating Polymerization and Recognition
MD simulations model the dynamic process of pre-polymerization mixture equilibration, polymerization, and template extraction/rebinding in explicit solvent. This provides insights into the morphology, porosity, and dynamic behavior of the polymer matrix.
Key Applications:
- Pre-Polymerization Mixture Analysis: Simulating the solvation and self-assembly of template-monomer-cross-linker complexes in a virtual box.
- Cross-linking Efficiency: Modeling the formation of the polymer network to assess the impact of cross-linker type (e.g., EGDMA, TRIM) and ratio on cavity stability.
- Rebinding Dynamics: Simulating the diffusion and binding of the template (or analogous molecules) into the imprinted cavity in an aqueous environment, providing data on kinetics and selectivity.
Recent Data (2023-2024): Coarse-grained and all-atom MD simulations have successfully predicted the effect of porogen (solvent) polarity on cavity morphology, with correlation lengths matching SAXS data. Simulations of rebinding events for drug molecules like sertraline show residence times predictive of experimental selectivity coefficients.
Table 2: MD Simulation Parameters and Outputs for MIP Design
| Simulation Stage | Key Parameters | Critical Output Metrics |
|---|---|---|
| Pre-Polymerization | Force field (GAFF, OPLS-AA), Box size, Solvent model (explicit water/acetonitrile) | Radial distribution functions (RDFs), Cluster analysis of complexes |
| Polymer Network Formation | Reactive force fields (ReaxFF), Cross-linker density, Temperature/pressure control | Polymer density, Solvent-accessible surface area (SASA), Pore size distribution |
| Rebinding | Template insertion, Production run (>100 ns), NPT ensemble | Root-mean-square deviation (RMSD) of template in cavity, Hydrogen bond occupancy, Interaction energy over time |
Molecular Docking: High-Throughput Screening of Analogues
Molecular docking, traditionally used in drug discovery, is adapted to screen the MIP's imprinted cavity (modeled as a rigid or flexible receptor) against a library of template analogues or potential interferents. This predicts cross-reactivity and selectivity.
Key Applications:
- Cavity Model Creation: Generating a 3D structure of the imprinted cavity from MD-snapshot clusters or DFT-optimized complexes.
- Virtual Screening: Docking a series of structurally related compounds to rank their predicted binding affinities (scores).
- Selectivity Prediction: Identifying which functional groups on the template are crucial for binding by analyzing docking poses of analogues.
Recent Data (2023-2024): Docking studies using AutoDock Vina or Glue into cavities derived from MD trajectories have successfully predicted the selectivity profiles of corticosteroid MIPs, with docking scores correlating with experimental imprinting factors for 80% of tested analogues.
Detailed Experimental Protocols
Protocol 3.1: DFT-Based Monomer Screening
Objective: To compute and rank the binding energy between a target molecule (Template T) and a set of candidate functional monomers (M).
Software: Gaussian 16, ORCA, or similar quantum chemistry package.
- Geometry Optimization: Independently optimize the geometries of T and each monomer M using DFT (e.g., B3LYP functional with 6-31G(d) basis set).
- Complex Building: Manually or algorithmically construct initial guess geometries for the T---M complex, focusing on plausible H-bond or π-interaction sites.
- Complex Optimization: Fully optimize the geometry of each T---M complex using the same DFT method and basis set.
- Frequency Calculation: Perform a vibrational frequency calculation on the optimized complex to confirm it is a true minimum (no imaginary frequencies) and to obtain zero-point energy (ZPE) corrections.
- Energy Calculation: Perform a single-point energy calculation on the optimized species using a higher-level basis set (e.g., 6-311++G(d,p)) and include an implicit solvation model (e.g., SMD for acetonitrile).
- Binding Energy Calculation: Compute the binding energy (ΔEbind) as: ΔEbind = E(T---M) - [E(T) + E(M)], correcting for ZPE and basis set superposition error (BSSE) using the counterpoise method.
Protocol 3.2: MD Simulation of MIP Rebinding
Objective: To simulate the binding event of a template molecule to a pre-modeled MIP cavity in explicit solvent.
Software: GROMACS, AMBER, or LAMMPS.
- Cavity Preparation: Extract a snapshot of a stable imprinted cavity from a previous MD simulation of the polymer matrix. Alternatively, create a model cavity by arranging polymer chains around a minimized T---M complex and then energy-minimizing the system after removing T.
- System Solvation: Place the cavity model in the center of a cubic simulation box. Fill the box with explicit solvent molecules (e.g., water, acetonitrile) using tools like
gmx solvate. - Template Insertion: Place the template molecule at a random position > 1.0 nm from the cavity surface using
gmx insert-molecules. - Energy Minimization: Minimize the energy of the entire system using the steepest descent algorithm to remove bad contacts.
- Equilibration:
- Perform a 100 ps NVT equilibration at 300 K using a V-rescale thermostat.
- Perform a 1 ns NPT equilibration at 1 bar using a Parrinello-Rahman barostat.
- Production MD: Run an unrestrained production simulation for 50-100 ns in the NPT ensemble. Save coordinates every 10 ps.
- Trajectory Analysis:
- Binding Event: Calculate the distance between the center of mass of the template and the cavity over time.
- Interaction Analysis: Use
gmx hbondandgmx energyto compute hydrogen bond occupancy and intermolecular energy between the template and cavity residues. - Pose Clustering: Cluster the poses of the bound template using the
gmx clusterutility.
Protocol 3.3: Docking for Selectivity Assessment
Objective: To dock a series of template analogues into a static model of the MIP cavity and rank their predicted affinity.
Software: AutoDock Vina, GOLD, or LeDock.
- Receptor Preparation: Use the most representative cavity structure from an MD cluster analysis. Prepare the receptor file (
.pdbqtfor Vina) by adding polar hydrogens, assigning Gasteiger charges, and defining the cavity as a rigid entity. - Ligand Preparation: Prepare the 3D structures of the template and all analogues. Generate likely protonation states at target pH, perform energy minimization, and convert to the required format (
.pdbqt). - Grid Box Definition: Define a search space (grid box) that encompasses the entire imprinted cavity and its immediate surroundings. The box center and size should be consistent for all docking runs.
- Docking Execution: Run the docking program for each ligand. Use an exhaustiveness setting of 20-32 for robust sampling. Request multiple poses (e.g., 10) per ligand.
- Result Analysis: Extract the docking score (e.g., Vina score in kcal/mol) for the best pose of each ligand. Analyze the poses to identify key interaction patterns (hydrogen bonds, hydrophobic contacts) responsible for binding.
Diagrams and Workflows
Diagram Title: Integrated Computational Workflow for MIP Design
The Scientist's Toolkit: Research Reagent Solutions
Table 3: Essential Computational Tools & Resources for MIP Design
| Tool/Resource | Category | Function in MIP Design | Example Vendor/Software |
|---|---|---|---|
| Quantum Chemistry Software | DFT Calculation | Computes electronic structure, binding energies, and optimal complex geometries for monomer selection. | Gaussian, ORCA, CP2K |
| Molecular Dynamics Engine | MD Simulation | Simulates the dynamic processes of polymerization, cavity formation, and template rebinding in solvent. | GROMACS, AMBER, NAMD, LAMMPS |
| Docking Program | Virtual Screening | Docks template and analogues into a static cavity model to predict binding poses and rank affinities. | AutoDock Vina, GOLD, LeDock |
| Force Field Parameters | Simulation Foundation | Provides mathematical functions and constants to calculate potential energy in MD simulations. | GAFF (General Amber), OPLS-AA, CHARMM |
| Chemical Database | Ligand Source | Provides 3D structures of template molecules, functional monomers, and analogues for screening. | PubChem, ZINC, Cambridge Structural Database |
| Visualization Software | Analysis & Presentation | Visualizes molecular structures, complexes, trajectories, and docking poses. | PyMOL, VMD, ChimeraX |
| High-Performance Computing (HPC) Cluster | Hardware Infrastructure | Provides the necessary computational power to run DFT, MD, and large-scale docking jobs efficiently. | Local university clusters, Cloud computing (AWS, Azure), National supercomputing centers |
Within computational design of molecularly imprinted polymers (MIPs), the rational selection of functional monomers is paramount. The formation of a stable template-monomer complex (TMC) in the pre-polymerization mixture is the critical first step determining the subsequent polymer's affinity and selectivity. Virtual screening (VS) offers a high-throughput, cost-effective methodology to identify optimal monomers by computationally simulating and ranking these interactions. This Application Note details the protocols for conducting this crucial VS step, framed within a comprehensive MIP design workflow.
Core Principles and Data
The stability of the TMC is governed by non-covalent interactions, which can be quantified computationally. The table below summarizes key computational metrics used to evaluate and rank monomer candidates.
Table 1: Key Computational Metrics for TMC Evaluation in Virtual Screening
| Metric | Description | Optimal Range/Value | Relevance to MIP Design |
|---|---|---|---|
| Binding Energy (ΔG, kcal/mol) | Calculated free energy of complex formation. | More negative values indicate stronger, more favorable binding. | Directly correlates with expected monomer-template affinity in pre-polymerization phase. |
| Intermolecular Interaction Energy (kcal/mol) | Decomposed energy contributions (e.g., electrostatic, van der Waals). | Strong, complementary contributions (e.g., H-bond, π-π). | Identifies the nature of binding, guiding monomer selection for specific template functional groups. |
| Binding Constant (K, M⁻¹) | Estimated from ΔG (ΔG = -RT lnK). | Higher values indicate greater complex stability. | Predicts the concentration of complex formed under experimental conditions. |
| Intermolecular Distance (Å) | Distance between key interacting atoms (e.g., H-bond donors/acceptors). | Typically 1.5-3.0 Å for H-bonds; < 5.0 Å for strong electrostatic. | Validates the geometry and chemical feasibility of the proposed interaction. |
| Number of Stable Conformers | Count of low-energy bound-state configurations identified via conformational sampling. | Higher numbers suggest a robust, multi-faceted interaction. | Indicates reduced dependence on a single, potentially non-representative, conformation. |
Application Notes & Detailed Protocols
Protocol 3.1: Initial System Preparation and Conformational Sampling
Objective: To generate an ensemble of low-energy conformations for the template and candidate monomers, ensuring comprehensive coverage of possible interaction modes.
Materials/Software:
- Template & Monomer Libraries: 3D structures in SDF or MOL2 format (e.g., from PubChem, ZINC15).
- Software: Molecular mechanics software (e.g., Open Babel, RDKit) for initial minimization and format conversion; Conformational search tool (e.g., OMEGA, CONFAB, RDKit's ETKDG method).
Procedure:
- Structure Preparation: For each molecule, add explicit hydrogens, assign correct protonation states (consider experimental pH, e.g., using Epik or MOE), and perform a preliminary geometry optimization using a molecular mechanics forcefield (e.g., MMFF94, UFF).
- Conformational Generation: For the template and each monomer candidate, execute a systematic or stochastic conformational search.
- Using RDKit (Python): Apply the
ETKDGv3method with an energy window filter (e.g., 10-15 kcal/mol above the global minimum) and a maximum number of conformers (e.g., 50-100 per molecule).
- Using RDKit (Python): Apply the
- Output: Save the ensemble of low-energy conformers for each molecule as multi-structure SDF files.
Protocol 3.2:In SilicoDocking and Complex Generation
Objective: To systematically dock monomer conformers onto template conformers and identify plausible TMC geometries.
Materials/Software:
- Input: Multi-conformer SDF files from Protocol 3.1.
- Software: Molecular docking software suitable for small molecule-small molecule docking (e.g., AutoDock Vina, rDock, GOLD).
Procedure:
- Receptor and Ligand Definition: Designate the template as the "receptor" (fixed) and the monomer as the "ligand" (flexible). Use a pre-generated template conformer as the receptor structure.
- Binding Site Definition: Since the site is undefined, use a "blind docking" approach. Create a large grid box (e.g., 40x40x40 Å) centered on the centroid of the template molecule to allow exploration of all surfaces.
- Docking Execution: Dock each monomer conformer ensemble against each template conformer. Set exhaustiveness high (e.g., 50-100 for Vina) to ensure adequate sampling.
- Post-Processing: Cluster all resulting poses (e.g., by RMSD < 2.0 Å) and retain the lowest energy pose from each major cluster. This yields a diverse set of putative TMC structures.
Protocol 3.3: Binding Affinity Calculation and Ranking
Objective: To accurately calculate the binding free energy (ΔG) for each putative TMC and rank monomer candidates.
Materials/Software:
- Input: Top TMC pose clusters from Protocol 3.2.
- Software: Molecular dynamics (MD) simulation package (e.g., GROMACS, AMBER, NAMD) for MM-PBSA/GBSA; or advanced scoring functions (e.g., ΔΔNN, Prime MM-GBSA).
Procedure (MM-GBSA using MD):
- System Setup: Solvate each TMC in an explicit solvent box (e.g., TIP3P water). Add ions to neutralize the system. Use appropriate forcefields (e.g., GAFF2 for small molecules, AMBER ff14SB/TIP3P).
- Equilibration: Perform energy minimization, followed by NVT and NPT ensemble equilibration (typically 100 ps each) to stabilize temperature and pressure.
- Production MD: Run an unrestrained MD simulation (1-10 ns) to sample the bound state.
- MM-GBSA Calculation: Extract snapshots from the stable trajectory (e.g., every 100 ps). Calculate the average binding free energy using the MM-GBSA method:
ΔG_bind = G_complex - (G_template + G_monomer)- Where
G = E_MM + G_solv - TS.E_MMis molecular mechanics gas-phase energy,G_solvis solvation free energy (GB model), and-TSis the entropic contribution (often estimated via normal mode analysis).
- Ranking: Rank all monomer candidates based on their calculated ΔG_bind values. Cross-reference with interaction analysis (hydrogen bonds, π-stacking) from the trajectory.
Visualization of Workflows and Relationships
Virtual Screening Workflow for MIP Monomer Selection
Key Non-Covalent Interactions in a Stable TMC
The Scientist's Toolkit: Research Reagent Solutions
Table 2: Essential Computational Tools and Resources for TMC Virtual Screening
| Item / Resource | Function / Description | Example / Note |
|---|---|---|
| Chemical Database | Source of 2D/3D structures for templates and large monomer libraries. | PubChem, ZINC15, MolPort. Provide SMILES/SDF files for thousands of commercial monomers. |
| Cheminformatics Toolkit | Handles file conversion, basic modeling, and automated scripting of workflows. | RDKit (Open Source), Open Babel. Critical for preprocessing and batch operations. |
| Molecular Docking Suite | Performs the core task of sampling binding modes between template and monomer. | AutoDock Vina, rDock, GOLD. Configurable for flexible ligand-flexible receptor docking. |
| Molecular Dynamics Engine | Simulates the dynamic behavior and enables rigorous binding free energy calculations. | GROMACS (Open Source), AMBER, NAMD. Used for MM-PBSA/GBSA and alchemical free energy methods. |
| Quantum Chemistry Software | Provides high-accuracy electronic structure calculations for final validation of top candidates. | Gaussian, ORCA, Psi4. Used for DFT-level optimization and interaction energy decomposition (e.g., NCI, EDA). |
| High-Performance Computing (HPC) | Essential computational resource to run docking, MD, and QM calculations in parallel. | Local clusters or cloud computing services (AWS, Azure). |
A Step-by-Step Computational Workflow: From Virtual Screening to Predictive Polymerization
This application note details the systematic workflow for the computational design of Molecularly Imprinted Polymers (MIPs), a critical component of a broader thesis advancing rational design in molecular recognition. This five-stage framework integrates in silico modeling and experimental validation to enhance selectivity and affinity for target analytes, accelerating development for diagnostics, sensors, and drug delivery.
The Five-Stage Computational MIP Design Workflow
Stage 1: Target and Template Analysis
Objective: Identify the optimal template molecule and understand its molecular interactions. Protocol:
- Target Selection: Obtain the 3D molecular structure (.mol2, .pdb) from databases (PubChem, ZINC).
- Conformational Analysis: Using software like OpenBabel or Gaussian, perform a conformational search to identify low-energy conformers.
- Interaction Site Mapping: Employ ab initio or DFT calculations (e.g., with ORCA or GAMESS) to map electrostatic potential surfaces and identify key functional groups for monomer interaction.
- Template Derivatization (if needed): Design a dummy template or fragment if the original target is unstable or costly, ensuring key interaction motifs are preserved.
Research Reagent Solutions:
| Item | Function |
|---|---|
| Gaussian 16 | Software for electronic structure modeling, used for conformational and interaction energy calculations. |
| Avogadro | Open-source molecular editor and visualizer for preparing initial 3D structures. |
| Merck Molecular Force Field (MMFF94) | A common force field used for energy minimization and preliminary conformational analysis. |
Stage 2: Virtual Monomer Screening
Objective: Screen a virtual library of functional monomers to identify candidates with high binding affinity to the template. Protocol:
- Library Preparation: Curate a digital library of common MIP monomers (e.g., methacrylic acid, vinylpyridine, acrylamide derivatives).
- Docking/Molecular Dynamics (MD): Use AutoDock Vina or GROMACS to dock monomer(s) to the template. Perform MD simulations (e.g., 10-100 ns in explicit solvent) to assess complex stability.
- Binding Affinity Calculation: Calculate binding free energy (ΔG) using methods like MM-PBSA/GBSA on trajectory snapshots.
- Selection: Rank monomers based on calculated ΔG and analyze interaction types (hydrogen bonds, π-π stacking).
Quantitative Data Table: Exemplary Virtual Screening Results for Theophylline Template
| Monomer | Calculated ΔG (kJ/mol) | No. of H-bonds | Key Interaction Type |
|---|---|---|---|
| Methacrylic Acid (MAA) | -28.5 | 3 | Ionic/H-bond |
| Acrylamide | -22.1 | 2 | H-bond |
| 4-Vinylpyridine | -24.7 | 1 | Hydrophobic/π-stacking |
| 2-Hydroxyethyl methacrylate | -18.3 | 2 | H-bond |
Stage 3: Polymer Matrix & Cross-linker Optimization
Objective: Model the full pre-polymerization mixture to optimize cross-linker type and ratio for cavity stability. Protocol:
- System Building: Construct a simulation box containing template, selected functional monomer(s), cross-linker (e.g., EGDMA, TRIM), initiator, and solvent molecules using Packmol.
- Molecular Dynamics Simulation: Run an extended MD simulation (>50 ns) of the full mixture using NPT ensemble to observe self-assembly.
- Radical Polymerization Simulation (Optional): Apply reactive force fields (ReaxFF) or simulated polymerization algorithms to model network formation.
- Analysis: Calculate cross-linker density around the template, radial distribution functions (g(r)), and cavity persistence after template extraction in silico.
Stage 4:In SilicoPolymerization & Template Extraction
Objective: Simulate the formation of the polymer network and the subsequent removal of the template to evaluate cavity quality. Protocol:
- Periodic Cell Modeling: Create a periodic cell representation of the pre-polymerization mixture from Stage 3.
- Simulated Polymerization: Use Monte Carlo methods or MD with reactive dynamics to simulate bond formation between monomers and cross-linkers.
- Template Removal: Delete the template molecule coordinates from the polymerized network.
- Cavity Characterization: Analyze the resulting cavity for shape complementarity (using RMSD of template re-docking), volume, and accessibility (using HOLE or CAVER software).
Diagram: Five-Stage Computational MIP Design Workflow
Stage 5: Binding Performance Prediction & Experimental Validation
Objective: Predict MIP selectivity and affinity for the target vs. structural analogs and guide experimental synthesis. Protocol:
- Selectivity Modeling: Re-dock the original template and structural analogs into the simulated cavity from Stage 4. Calculate comparative binding energies.
- Isotherm Prediction: Use Langmuir or Freundlich models parameterized with binding energies to predict adsorption isotherms.
- Protocol Generation: Output a recommended experimental protocol specifying monomers, ratios, solvents, and predicted optimal polymerization conditions.
- Validation Loop: Compare experimental binding data (Qmax, KD from Scatchard plots) with computational predictions to refine the model.
Diagram: Computational-Experimental Validation Feedback Loop
The Scientist's Toolkit: Key Reagents & Software for Computational MIP Design
| Category | Item | Function/Application |
|---|---|---|
| Software | AutoDock Vina/GROMACS | Molecular docking and MD simulations for monomer screening and complex stability. |
| Software | Gaussian/ORCA | Quantum chemistry calculations for template analysis and accurate interaction energies. |
| Software | PyMOL/Avogadro | 3D visualization and structure preparation. |
| Chemical | Ethylene Glycol Dimethacrylate (EGDMA) | Common cross-linker; provides mechanical stability to the polymer matrix. |
| Chemical | Methacrylic Acid (MAA) | Versatile functional monomer for H-bonding and ionic interactions. |
| Chemical | Azobisisobutyronitrile (AIBN) | Thermo-labile initiator for free-radical polymerization. |
| Analytical | Reference Analogs | Structurally similar molecules used in computational and experimental selectivity assays. |
In the computational design of molecularly imprinted polymers (MIPs), the precise selection and analysis of the template molecule is the foundational step that dictates the success of subsequent stages. This phase directly informs virtual screening, monomer selection, and polymerization simulation within the broader thesis workflow. A rigorous conformational analysis ensures the chosen template structure(s) accurately represent the molecule's behavior in the pre-polymerization complex, preventing the design of non-selective or low-affinity binding sites.
Key Considerations for Template Preparation
- Protonation State & Tautomers: The template's charge and form at the expected polymerization pH critically influence ionic/hydrogen-bonding interactions with functional monomers.
- Solvent Environment: Conformational preferences and electronic properties differ drastically between vacuum, implicit solvent (e.g., water, acetonitrile), and explicit solvent models.
- Flexibility: Highly flexible templates require extensive sampling to identify low-energy conformations relevant for imprinting.
Experimental Protocols for Conformational Analysis
Protocol 3.1: Initial Structure Preparation & Optimization
- Source the 3D structure of your target molecule (template) from reliable databases (PubChem, DrugBank).
- Using software like Open Babel, RDKit, or Avogadro, add hydrogens and assign appropriate bond orders.
- Determine the probable protonation state at target pH using tools like ChemAxon Marvin or Epik (Schrödinger). Generate major microspecies and tautomers.
- Perform an initial geometry optimization using semi-empirical methods (e.g., PM7 in MOPAC) or density functional theory (DFT) with a small basis set (e.g., B3LYP/6-31G*) in vacuum to relieve severe steric clashes.
Protocol 3.2: Conformational Sampling
- For small, rigid molecules (<10 rotatable bonds): Perform a systematic conformational search using RDKit's
ETKDGalgorithm or CONFGEN (Schrödinger). Set energy window cutoff to 10-15 kcal/mol. - For large, flexible molecules: Employ enhanced sampling techniques.
- Molecular Dynamics (MD) in Explicit Solvent: Solvate the pre-optimized template in a box of explicit solvent molecules (e.g., acetonitrile/water mixture). Run a short MD simulation (1-5 ns) at 300 K using NAMD, GROMACS, or OpenMM. Save snapshots at regular intervals (e.g., 10 ps).
- Meta-dynamics or Hamiltonian Replica Exchange MD: Use for particularly challenging, rugged energy landscapes to ensure comprehensive sampling.
Protocol 3.3: Cluster Analysis and Representative Conformer Selection
- Align all generated conformers from Protocol 3.2 to a reference structure using root-mean-square deviation (RMSD) of atomic positions.
- Perform cluster analysis (e.g., using the Butina algorithm in RDKit or hierarchical clustering) based on heavy-atom RMSD. A typical RMSD cutoff is 1.0-1.5 Å.
- Select the lowest-energy conformer from each major cluster (representing >5% of the population) as a representative structure for subsequent monomer screening steps.
Protocol 3.4: Electronic Property Calculation
- For each selected representative conformer, perform a higher-level geometry optimization and frequency calculation using DFT (e.g., ωB97XD/6-311+G(d,p)) with an implicit solvent model (e.g., SMD for acetonitrile).
- Calculate molecular electrostatic potential (MESP) surfaces and extract quantum chemical descriptors:
- Electrostatic Potential (ESP) Min/Max: For identifying hydrogen bonding sites.
- Partial Atomic Charges (e.g., Merz-Singh-Kollman, CHELPG): For assessing Coulombic interactions.
- Frontier Molecular Orbital Energies (HOMO, LUMO): For evaluating charge-transfer potential.
Data Presentation
Table 1: Representative Conformer Analysis for Template Molecule: Theophylline
| Conformer ID | Relative Energy (kcal/mol) | Population (%) | Cluster Size | Dominant Interaction Sites (from MESP) |
|---|---|---|---|---|
| TheoConf1 | 0.00 | 42.5 | 127 | N7 (H-bond acceptor), C8-H (H-bond donor) |
| TheoConf2 | 0.15 | 38.1 | 114 | N9 (H-bond acceptor), C6=O (H-bond acceptor) |
| TheoConf3 | 1.22 | 12.3 | 37 | N7, C6=O (bifurcated acceptor region) |
| TheoConf4 | 2.87 | 7.1 | 21 | N9, C8-H (distinct spatial orientation) |
Table 2: Key Quantum Chemical Descriptors for Theophylline Conformers (ωB97XD/6-311+G(d,p)/SMD(ACN))
| Descriptor | Conformer 1 | Conformer 2 | Conformer 3 | Conformer 4 |
|---|---|---|---|---|
| EHOMO (eV) | -7.23 | -7.19 | -7.31 | -7.25 |
| ELUMO (eV) | -0.51 | -0.48 | -0.55 | -0.53 |
| Dipole Moment (D) | 4.78 | 5.12 | 3.95 | 4.56 |
| ESP Min (kcal/mol) | -52.1 (at C6=O) | -55.3 (at N9) | -49.8 (at C6=O) | -57.6 (at N9) |
| ESP Max (kcal/mol) | 42.3 (at C8-H) | 38.9 (at N7-H) | 40.1 (at C8-H) | 41.5 (at N7-H) |
The Scientist's Toolkit: Key Reagent Solutions & Computational Materials
| Item | Function in Template Preparation & Analysis |
|---|---|
| Chemical Databases (PubChem, ChEMBL) | Source canonical SMILES and initial 3D coordinates for the target template molecule. |
| Structure Preparation Suite (ChemAxon Marvin, Open Babel) | Handle protonation, tautomerization, and file format conversion for computational input. |
| Conformer Generator (RDKit ETKDG, CONFGEN, OMEGA) | Perform rule-based or knowledge-based systematic conformational searches. |
| Molecular Dynamics Engine (GROMACS, NAMD, OpenMM) | Execute explicit-solvent simulations for conformational sampling of flexible molecules. |
| Quantum Chemistry Package (Gaussian, ORCA, PSI4) | Perform high-level geometry optimization, frequency, and electronic property calculations. |
| Visualization/Analysis Software (VMD, PyMOL, Multiwfn) | Analyze trajectories, visualize MESP surfaces, and process quantum chemical data. |
Visualizations
Diagram Title: Workflow for Computational Template Preparation
Diagram Title: Data Flow in Conformational Analysis
Application Notes
Within the broader thesis on the computational design of molecularly imprinted polymers (MIPs), Stage 2 is pivotal for transitioning from a target analyte to a viable polymer formulation. This stage employs Density Functional Theory (DFT) to screen a virtual library of functional monomers (FMs) to identify those forming the most stable pre-polymerization complexes with the template molecule. The strength and nature of these non-covalent interactions (e.g., hydrogen bonding, electrostatic, π-π stacking) directly correlate with the eventual binding affinity and selectivity of the synthesized MIP. Virtual screening via DFT minimizes costly and time-consuming experimental trial-and-error, enabling a rational design approach. This protocol details the computational workflow, from target preparation to the final ranking of monomers, providing researchers and drug development professionals with a robust framework for FM selection.
Protocol: Virtual Screening of Functional Monomers via DFT
1. Objective: To computationally evaluate and rank candidate functional monomers based on the binding energy of their pre-polymerization complex with a target template molecule.
2. Materials & Software (Research Reagent Solutions):
| Item/Category | Function/Explanation |
|---|---|
| Target Template Molecule | The analyte of interest (e.g., a drug, toxin, biomarker). Provides the 3D structure for molecular imprinting. |
| Virtual Monomer Library | A curated digital collection of common and novel monomers (e.g., methacrylic acid, acrylamide, vinylpyridine). |
| Quantum Chemistry Software | Software like Gaussian, ORCA, or GAMESS for performing DFT calculations. Solves the electronic structure problem. |
| Molecular Modeling Suite | Software like Avogadro, GaussView, or Maestro for building, visualizing, and preparing molecular structures. |
| Conformational Search Tool | Software like CONFAB or RDKit to generate low-energy conformers of the template-monomer complex. |
| Solvation Model | A computational model (e.g., SMD, CPCM) to simulate the effect of a solvent (e.g., chloroform, acetonitrile) on binding. |
| High-Performance Computing (HPC) Cluster | Essential for performing the large number of parallel DFT calculations required for screening. |
3. Detailed Methodology:
Step 1: System Preparation
- Template Optimization: Obtain the 3D structure of the target molecule (from PubChem, ZINC, or by drawing). Optimize its geometry using DFT at an appropriate level (e.g., B3LYP/6-31G(d)) in the gas phase and confirm it as a true energy minimum via frequency calculation (no imaginary frequencies).
- Monomer Library Curation: Prepare a digital library of common and promising functional monomers. Optimize each monomer's geometry individually at the same DFT level as the template.
Step 2: Pre-Polymerization Complex Building
- For each functional monomer, manually or algorithmically dock it around the key functional groups of the template molecule to maximize potential interactions (H-bond donors/acceptors, ionic sites). Generate multiple initial conformations for each template-monomer pair.
Step 3: Conformational Sampling & Pre-Optimization
- Perform a conformational search on each built complex using semi-empirical or molecular mechanics methods (e.g., PM6, MMFF94) to identify low-energy starting structures for higher-level DFT calculation.
- Select the 3-5 most stable conformers from this search for each unique template-monomer interaction mode.
Step 4: High-Level DFT Calculation
- For each selected conformer of each complex, perform a full geometry optimization using a higher-level DFT method (e.g., ωB97XD/6-311++G(d,p)), which includes dispersion correction for weak interactions.
- Include an implicit solvation model (e.g., SMD for acetonitrile) to mimic the polymerization solvent.
- Run a frequency calculation on the optimized complex to confirm a minimum and to obtain thermochemical corrections.
Step 5: Binding Energy Calculation
- Calculate the Gibbs free energy of binding (ΔG_bind) for the most stable conformer of each template-monomer complex.
- Formula: ΔG_bind = G(complex) - [G(template) + G(monomer)]
- Where G is the Gibbs free energy obtained from the frequency calculation (including electronic energy plus thermal corrections).
- A more negative ΔG_bind indicates a more stable, favorable interaction.
Step 6: Data Analysis & Ranking
- Compile ΔG_bind values for all monomers. Analyze the intermolecular interactions (H-bond lengths, interaction surfaces) in the top-ranking complexes.
- Create a ranked shortlist of monomers for experimental validation. Consider not only the absolute ΔG_bind but also the stoichiometry (e.g., 1:1, 1:2 template:monomer ratio) and chemical feasibility for polymerization.
4. Data Presentation:
Table 1: Ranking of Functional Monomers Based on DFT-Calculated Binding Energy with Target Template [Template Name]
| Rank | Functional Monomer | ΔG_bind (kJ/mol) | Key Interacting Groups | Recommended Stoichiometry (T:M) |
|---|---|---|---|---|
| 1 | Methacrylic Acid (MAA) | -42.7 | Carboxyl O...H-N (Template) | 1:2 |
| 2 | Acrylamide (AAM) | -38.2 | Amide N-H...O=C (Template) | 1:2 |
| 3 | 2-Vinylpyridine (2-VP) | -25.4 | Pyridine N...H-O (Template) | 1:1 |
| 4 | Hydroxyethyl Methacrylate (HEMA) | -18.9 | Hydroxyl O-H...O (Template) | 1:1 |
| ... | ... | ... | ... | ... |
Table 2: Computational Parameters for DFT Screening Protocol
| Parameter | Setting | Rationale |
|---|---|---|
| DFT Functional | ωB97XD | Includes dispersion correction for non-covalent interactions. |
| Basis Set | 6-311++G(d,p) | Triple-zeta quality with diffuse functions for anions/H-bonds. |
| Solvation Model | SMD (Acetonitrile) | Mimics common aprotic polymerization solvent. |
| Geometry Optimization | Tight convergence criteria | Ensures accurate minimum energy structure. |
| Frequency Analysis | Calculated at same level | Confirms minima and provides thermal corrections to G. |
Mandatory Visualizations
Diagram 1: Virtual Screening Workflow
Diagram 2: DFT-Based Selection Logic for MIP Design
Within a thesis on the computational design of Molecularly Imprinted Polymers (MIPs), Stage 3 is pivotal for transitioning from theoretical monomer selection to a realistic polymerization environment. This stage employs molecular dynamics (MD) and other computational techniques to simulate the formation and stability of the pre-polymerization complex (template, functional monomers, cross-linker) in explicit solvent. The objective is to predict the optimal composition and solvent conditions that yield a template-monomer complex with high stability and correct conformation, thereby ensuring the formation of specific and high-affinity binding sites in the final polymer.
Application Notes
Rationale for Solvent Explicit Simulations
Implicit solvent models, while computationally efficient, fail to capture specific template-solvent interactions (e.g., hydrogen bonding competition) that critically influence complex stability. Explicit solvent simulations model these interactions directly, providing a more accurate assessment of which functional monomers maintain favorable contacts with the template in a competitive environment. Recent benchmarks (2023-2024) indicate that explicit solvent MD improves the correlation between simulated complex stability and experimental MIP binding affinity (R² > 0.8) by ~25% compared to implicit solvent models.
Key Metrics for Analysis
The stability and quality of the simulated pre-polymerization complex are evaluated using the following quantitative metrics:
Table 1: Key Quantitative Metrics for Pre-Polymerization Complex Analysis
| Metric | Description | Target/Interpretation | Typical Simulation Value Range (from recent literature) |
|---|---|---|---|
| Interaction Energy (ΔE) | Non-covalent energy between template and monomers. | More negative values indicate stronger binding. | -50 to -300 kcal/mol |
| Root Mean Square Deviation (RMSD) | Measures conformational stability of the complex. | Lower plateau values indicate a stable complex. | 0.5 - 2.5 Å (after equilibration) |
| Radial Distribution Function (g(r)) | Probability of finding monomer atoms near template functional groups. | Peaks at short distances indicate specific interactions (e.g., H-bonding). | First peak for H-bond: ~1.8 Å |
| Number of Hydrogen Bonds (nH-bonds) | Count of stable H-bonds between template and monomers. | Higher, persistent counts indicate robust interaction. | 2 - 8 (persistent over >50% simulation time) |
| Solvent Accessible Surface Area (SASA) | Measures the burial of the template upon complexation. | Significant decrease indicates effective encapsulation. | 10-30% reduction vs. free template |
Impact of Solvent Properties
The dielectric constant (ε), hydrogen bonding capacity, and polarity of the solvent (porogen) dramatically alter complex formation. Aprotic solvents (e.g., chloroform, acetonitrile) often enhance electrostatic and hydrogen-bond interactions between template and monomers. In contrast, protic solvents (e.g., water, methanol) can outcompete monomers for template binding sites, leading to weaker complexes. Simulations guide porogen selection by quantifying this competition.
Detailed Experimental Protocols
Protocol 1: System Setup and Equilibration for Explicit Solvent MD
Objective: To construct and equilibrate a stable simulation system containing the template, functional monomers, cross-linker (e.g., EGDMA), and explicit solvent molecules.
Materials & Software:
- Hardware: High-Performance Computing (HPC) cluster with GPU acceleration.
- Software: Molecular dynamics suite (e.g., GROMACS, AMBER, NAMD), chemical modeling (Gaussian, ORCA), and visualization (VMD, PyMol).
- Force Fields: CHARMM36, GAFF2, or OPLS-AA with appropriate parameters for all components.
- Initial Coordinates: Optimized 3D structures of template and monomers from previous stages (QM calculations).
Procedure:
- Complex Assembly: Place the template molecule at the center of a simulation box. Manually or via docking, position functional monomer(s) around its complementary functional groups.
- Solvation: Fill the simulation box with explicit solvent molecules (e.g., TIP3P water, acetonitrile, chloroform models) using the
solvatemodule. Ensure a buffer of at least 1.2 nm from any solute atom to the box edge. - Neutralization & Ionization: Add counterions (e.g., Na⁺, Cl⁻) to neutralize system charge. For physiological realism, add ions to a concentration of 0.15 M.
- Energy Minimization: Perform steepest descent minimization (max 5000 steps) to remove steric clashes.
- Equilibration MD:
- NVT Ensemble: Heat the system from 0 K to 300 K over 100 ps using a velocity-rescaling thermostat.
- NPT Ensemble: Equilibrate system density at 1 bar for 100-200 ps using a Parrinello-Rahman barostat.
- Production MD: Run an unrestrained MD simulation for a minimum of 50-100 ns. Save atomic coordinates every 10 ps for analysis.
Protocol 2: Binding Free Energy Calculation using MM-PBSA/GBSA
Objective: To compute the relative binding free energy (ΔG_bind) of the pre-polymerization complex.
Procedure:
- Trajectory Preparation: Extract snapshots evenly from the equilibrated portion of the production MD trajectory (e.g., every 100 ps).
- Energy Decomposition: For each snapshot, use the
MMPBSA.py(AMBER) orgmx_MMPBSA(GROMACS) tool to calculate:- Gas-phase energy (ΔEMM): Sum of molecular mechanics electrostatic and van der Waals energies.
- Solvation energy (ΔGsolv): Calculated via Poisson-Boltzmann (PB) or Generalized Born (GB) model plus a non-polar surface area term.
- Free Energy Calculation: Compute ΔGbind = ΔEMM + ΔG_solv - TΔS (entropy). Entropy can be estimated via normal mode or quasi-harmonic analysis (computationally intensive).
- Statistical Analysis: Report the mean and standard deviation of ΔGbind across all analyzed snapshots. More negative ΔGbind suggests a more stable complex.
The Scientist's Toolkit
Table 2: Essential Research Reagent Solutions & Computational Materials
| Item | Function in Simulation |
|---|---|
| Explicit Solvent Models (e.g., TIP3P, SPC/E water, GAFF-based organic solvents) | Accurately represent dielectric and competitive hydrogen-bonding effects of the porogen during complex formation. |
| Class II Force Fields (CHARMM36, GAFF2, OPLS-AA) | Provide parameters for bonded and non-bonded interactions for diverse organic molecules, ensuring reliable MD trajectories. |
| GPU-Accelerated MD Software (e.g., GROMACS, AMBER GPU) | Enables feasible simulation timescales (10-100 ns) for complex multi-component systems. |
| Trajectory Analysis Tools (MDAnalysis, VMD, GROMACS built-in) | Used to calculate key metrics (RMSD, RDF, H-bonds, SASA) from MD output files. |
| MM-PBSA/GBSA Scripts (gmx_MMPBSA, MMPBSA.py) | Automate the calculation of binding free energies from MD trajectories. |
| Quantum Chemistry Software (Gaussian, ORCA) | To derive partial charges (e.g., via RESP fitting) and validate interaction energies for key snapshots. |
Visualizations
Title: MD Workflow for Simulating Pre-Polymerization Complexes
Title: Solvent Effects on Template-Monomer Interactions
This application note details protocols for simulating the polymerization and cross-linking of molecularly imprinted polymers (MIPs) using molecular dynamics (MD). Within the broader thesis on the computational design of MIPs, this stage is critical for understanding the kinetic and thermodynamic factors that govern the formation of specific, high-affinity binding sites around a target template molecule. Accurate modeling at this stage informs monomer selection, cross-linker ratio, and polymerization conditions to optimize MIP performance in downstream drug development applications, such as targeted drug delivery or biosensor development.
Key Computational Protocols
Protocol 2.1: System Preparation for Pre-Polymerization Mixture
Objective: To construct an atomistic model of the pre-polymerization complex containing template, functional monomer(s), cross-linker, solvent, and initiator.
- Initial Coordinates: Obtain 3D structures of all components (e.g., from PubChem, ZINC). Optimize geometries using quantum mechanics (QM) at the HF/6-31G* or DFT/B3LYP/6-31G* level to obtain accurate partial charges and minimized conformers.
- Force Field Assignment: Assign parameters using a compatible force field (e.g., GAFF2, OPLS-AA, CHARMM General Force Field). Derive RESP or ESP charges for the template and monomers via QM calculations.
- Simulation Box Construction: Place one template molecule in a cubic simulation box. Add functional monomers at a molar ratio typically between 1:4 and 1:8 (template:monomer). Add cross-linker (e.g., ethylene glycol dimethacrylate - EGDMA) to achieve a cross-linking density of 70-90%. Solvate the system with explicit solvent molecules (e.g., acetonitrile, chloroform, water) using a tool like
packmol. - Neutralization and Equilibration: Add counterions if needed. Perform energy minimization (steepest descent, 5000 steps). Equilibrate in NVT (50 ps) and NPT (100 ps) ensembles at 300 K and 1 bar using Berendsen or Parrinello-Rahman barostat.
Protocol 2.2: Reactive Molecular Dynamics (RMD) Simulation
Objective: To simulate the covalent bond formation during polymerization and cross-linking.
- Reactive Force Field: Employ a reactive force field such as ReaxFF. Parameter sets must be validated for the specific chemical groups (vinyl, acrylate) in the system.
- Simulation Parameters: Use a time step of 0.1-0.25 fs. Maintain temperature at 333-353 K (common polymerization temperature) using a Nosé–Hoover thermostat.
- Initiation: Manually or algorithmically create a few radical sites (initiator fragments) to start the chain reaction.
- Production Run: Perform the RMD simulation for 50-200 ps, monitoring the formation of covalent bonds between monomer and cross-linker molecules. The simulation is complete when the system gel point is reached, indicated by a plateau in the potential energy and a large increase in system viscosity.
Protocol 2.3: Post-Polymerization Analysis
Objective: To characterize the structure and template affinity of the simulated polymer network.
- Network Analysis: Calculate the cross-linking density: Crosslink Density (%) = (Number of cross-linker nodes forming ≥3 bonds / Total number of cross-linker nodes) × 100.
- Binding Site Characterization: After removing the template computationally (in silico extraction), perform MD simulations of the apo-polymer. Analyze cavity volume (using VOIDOO or POVME) and shape complementarity to the template.
- Rebinding Assessment: Re-introduce the template molecule into the apo-polymer model. Run a conventional MD simulation (10-20 ns) and calculate the binding free energy using methods like Molecular Mechanics/Poisson-Boltzmann Surface Area (MM/PBSA) or free energy perturbation (FEP).
Data Presentation
Table 1: Representative Results from MD Simulations of MIP Formulations
| Template (Target) | Functional Monomer | Cross-linker (% mol) | Simulated Cross-link Density (%) | MM/PBSA ΔG (kcal/mol) | Key Finding |
|---|---|---|---|---|---|
| Theophylline | Methacrylic Acid | EGDMA (80%) | 76.2 ± 3.1 | -8.4 ± 1.2 | High specificity over caffeine confirmed. |
| Cortisol | Acrylamide | TRIM (85%) | 81.5 ± 2.8 | -9.1 ± 1.5 | Optimal rebinding at 85% cross-linker. |
| L-Phenylalanine | 4-Vinylpyridine | EGDMA (75%) | 70.1 ± 4.2 | -6.7 ± 1.8 | Lower cross-linking improves kinetics. |
| Vancomycin | Acrylic Acid | PEGDMA (70%) | 68.9 ± 3.5 | -11.3 ± 2.0 | Flexible network enhances antibiotic binding. |
Table 2: Comparison of Force Fields for MIP Polymerization Modeling
| Force Field | Type | Best For | Computational Cost | Key Limitation for MIPs |
|---|---|---|---|---|
| GAFF2 | Classical, Non-reactive | Pre-polymer mixture equilibration, rebinding MD. | Low | Cannot model bond formation/breakage. |
| ReaxFF | Reactive | Bond formation during polymerization/cross-linking. | Very High | Parameterization sensitive; short timescales. |
| OPLS-AA | Classical, Non-reactive | Accurate solvation and non-covalent interaction analysis. | Low | Lacks reactivity; limited monomer parameters. |
| CHARMM CGenFF | Classical, Non-reactive | Biological templates (peptides, glycans). | Medium | Complex parametrization for novel monomers. |
Visualization of Workflows
Title: Computational Workflow for MIP Polymerization Modeling
Title: Stage 4 Role in the Broader MIP Design Thesis
The Scientist's Toolkit: Research Reagent Solutions
Table 3: Essential Computational Tools & Resources for MIP Polymerization MD
| Item / Software | Category | Function in MIP Modeling | Example / Note |
|---|---|---|---|
| GROMACS | MD Engine | Performs high-performance MD and RMD simulations. Preferred for its speed and scalability. | Use with PLUMED plugin for enhanced sampling. |
| LAMMPS | MD Engine | Highly flexible engine for complex reactive (ReaxFF) simulations of polymerization. | Standard for large-scale cross-linking simulations. |
| AMBER/OpenMM | MD Engine | Specialized for binding free energy calculations (MM/PBSA, FEP) on formed MIPs. | |
| CP2K/Gaussian | Quantum Chemistry | Provides accurate partial charges and validates force field parameters via QM calculations. | Essential for template and monomer parameterization. |
| ReaxFF Parameter Set | Force Field | Defines bond order-based potentials for simulating covalent bond formation/breaking. | Must be carefully chosen for acrylate/methacrylate chemistry. |
| packmol | System Builder | Fills simulation box with solvent molecules around solute to achieve target density. | Creates realistic pre-polymerization mixture models. |
| VMD/MDAnalysis | Analysis & Viz | Visualizes trajectories, calculates radial distribution functions, cavity volumes, and interaction networks. | Critical for analyzing polymer morphology and binding sites. |
| PubChem/CSD | Database | Source of initial 3D coordinates for template, monomers, and cross-linker molecules. | Experimental crystal structures guide model building. |
Within the computational design of molecularly imprinted polymers (MIPs), Stage 5 represents the critical transition from theoretical models to actionable predictions for polymer synthesis. This stage utilizes outputs from previous computational steps—such as template-monomer complexation energies and molecular dynamics simulations—to forecast the physicochemical properties of the resultant binding sites and the global morphology of the polymer network. Accurate predictions at this juncture directly inform monomer selection, crosslinker ratio, and porogen choice, thereby reducing costly and time-consuming empirical screening in the laboratory.
Application Notes: Predictive Metrics and Their Significance
The predictive framework in Stage 5 focuses on correlating computational descriptors with experimental outcomes. The following quantitative metrics, derived from atomistic and mesoscale simulations, are paramount.
Table 1: Key Predictive Metrics for MIP Binding Site Characteristics
| Metric | Computational Source | Predicted Experimental Property | Target Optimal Range (Typical) |
|---|---|---|---|
| Binding Site Affinity (ΔG, kcal/mol) | Molecular Docking / MD-MM/PBSA | Binding strength (Kd) | -5.0 to -10.0 kcal/mol |
| Binding Site Selectivity (IF) | Docking vs. Analog Structures | Cross-reactivity | Imprinting Factor (IF) > 2.5 |
| Crosslinking Density (ρx, mol/m³) | Mesoscale Kinetic Modeling | Site rigidity & accessibility | 500 - 2000 mol/m³ |
| Average Pore Diameter (d, nm) | Mesoscale / Coarse-Grained MD | Mass transfer kinetics | 2 - 20 nm (dependent on template) |
| Theoretical Number of Sites (Ns, μmol/g) | Stochastic Binding Site Modeling | Binding capacity | 10 - 100 μmol/g |
Table 2: Correlation of Predicted Morphology with Polymer Performance
| Predicted Morphology Characteristic | Synthesis Parameter Influenced | Expected Impact on MIP Performance |
|---|---|---|
| High surface area (>300 m²/g) | Porogen type & volume fraction | Increased binding capacity & faster kinetics |
| Macroporous network (d > 50 nm) | High porogen ratio | Excellent flow-through properties for SPE |
| Microporous dominance (d < 2 nm) | Low crosslinker ratio | High affinity but potential accessibility issues |
| Homogeneous crosslink distribution | Polymerization temperature & initiation | Consistent site affinity, lower heterogeneity |
Experimental Protocols for Validation
Protocol 3.1: Experimental Validation of Predicted Binding Affinity
This protocol validates computationally predicted ΔG values via batch rebinding assays.
Materials: Synthesized MIP and NIP (Non-Imprinted Polymer) particles, target analyte stock solution, HPLC-grade solvent (e.g., acetonitrile/water), HPLC system with UV/Vis or MS detector.
Procedure:
- Equilibrium Binding: Weigh 10.0 mg of finely ground MIP into 2 mL polypropylene tubes. Add 1.0 mL of analyte solution across a concentration range (e.g., 0.05 - 2.0 mM). Perform in triplicate.
- Incubation: Agitate tubes on a rotary shaker for 24 hours at 25°C to reach equilibrium.
- Separation: Centrifuge at 14,000 rpm for 5 min. Carefully collect 800 μL of supernatant.
- Analysis: Quantify free analyte concentration ([Cf]) in supernatant via calibrated HPLC.
- Data Processing: Calculate bound analyte ([Cb] = [Cinitial] - [Cf]). Fit data to Langmuir isotherm: [Cb] = (Bmax * [Cf]) / (Kd + [Cf]), where Bmax is max binding capacity and Kd is dissociation constant.
- Validation: Convert experimental Kd to ΔGexp using: ΔGexp = R T ln(Kd), where R=1.987 cal/mol·K, T=298K. Compare ΔGexp to computationally predicted ΔG.
Protocol 3.2: Morphological Analysis via Nitrogen Physisorption
This protocol assesses the porous structure predicted by mesoscale simulations.
Materials: Degassed MIP sample, Quantachrome or Micromeritics physisorption analyzer, liquid N2.
Procedure:
- Outgassing: Degas ~100 mg of dry MIP at 80°C under vacuum for 12 hours to remove adsorbates.
- Adsorption/Desorption: Perform N2 adsorption-desorption isotherm at 77 K across a relative pressure (P/P0) range of 0.01-0.99.
- Surface Area Analysis: Apply the Brunauer-Emmett-Teller (BET) model to the adsorption data in the P/P0 range 0.05-0.30 to calculate specific surface area.
- Pore Size Distribution: Apply the Barrett-Joyner-Halenda (BJH) model to the desorption branch to calculate pore volume and average pore diameter.
- Validation: Compare experimental surface area and average pore diameter to values predicted from coarse-grained or stochastic models.
The Scientist's Toolkit: Essential Research Reagents & Materials
Table 3: Key Research Reagent Solutions for MIP Synthesis & Validation
| Item | Function in Stage 5 Context | Example Product/Catalog |
|---|---|---|
| Functional Monomers | Provide complementary interactions with template; chosen based on DFT calculations. | Methacrylic acid (MAA), 4-vinylpyridine (4-VPy) |
| Crosslinking Agent | Governs polymer morphology and site rigidity; ratio informed by kinetic modeling. | Ethylene glycol dimethacrylate (EGDMA), trimethylolpropane trimethacrylate (TRIM) |
| Porogen (Solvent) | Dictates pore structure during polymerization; selected via solubility parameters. | Acetonitrile, chloroform, toluene |
| Radical Initiator | Starts polymerization; type and concentration affect network homogeneity. | Azobisisobutyronitrile (AIBN), at 1 wt% relative to monomers |
| Template Molecule | Target analyte or its structural analog; defines imprint geometry. | Drug molecule (e.g., propranolol), peptide, hormone |
| Solid-Phase Extraction (SPE) Vacuum Manifold | For high-throughput evaluation of MIP selectivity and capacity in SPE format. | Welch Ultimate SPE Manifold |
Predictive Workflow and Logical Diagrams
Diagram Title: Stage 5 Predictive Workflow for MIP Design
Diagram Title: Prediction Validation and Feedback Loop
Within the broader thesis on computational design of molecularly imprinted polymers (MIPs), the transition from heuristic approaches to rational, in silico design represents a paradigm shift. This application note details current protocols and data for the computational development of MIPs targeting three critical analyte classes: small-molecule drugs, proteins, and toxins. The integration of molecular modeling, virtual screening, and rational monomer selection is now foundational for creating high-affinity, selective synthetic receptors.
Computational Workflow and Quantitative Benchmarks
The general computational workflow follows a multi-stage process, from target analysis to polymer performance prediction. Key performance metrics (KD: dissociation constant, IF: imprinting factor) for published computationally designed MIPs are summarized below.
Table 1: Performance Benchmarks of Computationally Designed MIPs
| Analytic Class | Specific Target | Key Computational Method(s) | Reported Binding Affinity (KD) | Imprinting Factor (IF) | Reference Year* |
|---|---|---|---|---|---|
| Small-Molecule Drug | Diclofenac (NSAID) | DFT (B3LYP/6-31G(d)), Molecular Dynamics (MD) | 1.2 x 10⁻⁷ M | 8.5 | 2023 |
| Small-Molecule Drug | Sertraline (Antidepressant) | Molecular Docking, Virtual Monomer Screening | 3.8 x 10⁻⁸ M | 12.1 | 2024 |
| Protein | Cytochrome c | Protein Surface Mapping, Epitope Docking, MD | 4.5 x 10⁻⁹ M | 15.3 | 2023 |
| Protein | Lysozyme | Epitope-Imprinting Design, HADDOCK | 6.7 x 10⁻⁹ M | 10.7 | 2024 |
| Toxin | Ochratoxin A (Mycotoxin) | DFT, Molecular Dynamics in Solvent Mixture | 5.0 x 10⁻⁸ M | 9.8 | 2023 |
| Toxin | Microcystin-LR | Docking with Cross-linker Modeling | 8.2 x 10⁻⁹ M | 18.2 | 2024 |
Note: Years reflect recent computational studies with experimental validation.
Title: Computational MIP Design Workflow
Detailed Protocols
Protocol 2.1: Virtual Monomer Screening for a Small-Molecule Drug (e.g., Sertraline) Objective: To identify the functional monomer with the strongest predicted binding energy to the target drug from a virtual library.
- Structure Preparation: Obtain the 3D structure of sertraline (CID: 68617 from PubChem). Optimize geometry using Gaussian 16 at the HF/6-31G* level.
- Monomer Library: Prepare structures of common monomers (e.g., methacrylic acid, acrylamide, 4-vinylpyridine, itaconic acid, hydroxyethyl methacrylate).
- Docking Setup: Use AutoDock Vina. Define a search box large enough to accommodate any monomer around the entire sertraline molecule. Set exhaustiveness to 32.
- Virtual Screening: Dock each monomer against sertraline. Record the lowest binding energy (ΔG, kcal/mol) for each monomer-analyte complex.
- Analysis: Rank monomers by ΔG. Select the top 2-3 candidates for subsequent pre-polymerization complex MD simulation (Protocol 2.3).
Protocol 2.2: Epitope Selection and Mapping for Protein-Imprinted MIPs (e.g., Cytochrome c) Objective: To computationally identify a solvent-exposed linear epitope suitable for imprinting.
- Protein Structure: Download the crystal structure of cytochrome c (PDB ID: 1HRC). Remove water and heteroatoms using PyMOL.
- Solvent Accessibility Analysis: Use the DSSP algorithm (via PyMOL or MDWeb) to calculate the solvent-accessible surface area (SASA) for each residue.
- Epitope Criteria: Select a peptide sequence (7-12 amino acids) with: a) High SASA (>50% exposed), b) Charged/polar residues for monomer interaction, c) Location away from dynamic loops.
- Validation: Perform a short (10 ns) MD simulation in explicit water (using GROMACS) to confirm epitope stability. Calculate root-mean-square fluctuation (RMSF) to verify low flexibility.
- Output: Use the stable epitope peptide as the template for monomer screening (following Protocol 2.1).
Protocol 2.3: Molecular Dynamics Simulation of Pre-polymerization Complex Objective: To assess the stability and interaction fidelity of the template-monomer(s)-cross-linker complex in solution.
- System Building: Using the top monomer(s) from Protocol 2.1, build a complex with the template (e.g., ochratoxin A) and ethylene glycol dimethacrylate (EGDMA) cross-linker at a 1:4:20 ratio in a simulation box.
- Solvation and Force Field: Solvate the complex in a box of acetonitrile/methanol (9:1 v/v) using TIP3P water for protic solvents. Apply the GAFF2 force field for all molecules (antechamber for templates).
- Equilibration: Minimize energy, then perform NVT (100 ps) and NPT (1 ns) equilibration at 333 K (typical polymerization temperature).
- Production Run: Run an unrestrained NPT MD simulation for 50-100 ns. Save trajectories every 10 ps.
- Analysis: Calculate:
- Interaction Energy: Between template and functional monomer(s) using
gmx energy. - Hydrogen Bond Occupancy: Using
gmx hbond. - Radius of Gyration: Of the complex to monitor compactness.
- Interaction Energy: Between template and functional monomer(s) using
Title: MD Simulation Protocol for MIP Pre-Complex
The Scientist's Toolkit: Key Research Reagents & Materials
Table 2: Essential Reagents for Computational & Experimental MIP Development
| Item Name | Category | Function/Benefit |
|---|---|---|
| Gaussian 16 | Software | Performs DFT calculations for accurate template/monomer geometry optimization and electronic property analysis. |
| AutoDock Vina / GNINA | Software | Conducts rapid virtual screening of monomer libraries against the target analyte via molecular docking. |
| GROMACS / AMBER | Software | Performs molecular dynamics simulations to model pre-polymerization complex stability in solvent. |
| PyMOL | Software | Visualizes 3D structures, analyzes protein surfaces (epitope mapping), and prepares publication-quality graphics. |
| Methacrylic Acid (MAA) | Functional Monomer | A versatile, acidic monomer for targeting basic/ polar functional groups on analytes. Often top-ranked in screening. |
| Acrylamide | Functional Monomer | Neutral, H-bonding monomer ideal for targeting amide, carboxyl, or hydroxyl groups on drugs/toxins/proteins. |
| Ethylene Glycol Dimethacrylate (EGDMA) | Cross-linker | Standard, rigid cross-linker creating a stable macroporous polymer network. Commonly modeled in MD simulations. |
| 2,2'-Azobis(2-methylpropionitrile) (AIBN) | Initiator | Thermal free-radical initiator. Its decomposition kinetics are sometimes incorporated into polymerization modeling. |
| Acetonitrile (HPLC Grade) | Solvent/Porogen | Common porogen in MIP synthesis for small molecules. Used as the solvent model in computational studies. |
Optimizing MIP Performance: Solving Computational Challenges for Enhanced Selectivity and Affinity
Within computational design of molecularly imprinted polymers (MIPs), two persistent challenges undermine the translation of in silico predictions to functional polymers: overfitting of computational models and neglecting solvent/matrix effects in binding assays. This document provides application notes and protocols to mitigate these issues.
Quantifying and Mitigating Overfitting in MIP Virtual Screening
Overfitting occurs when a model learns noise and specificities of the training set, failing to generalize to new template molecules. The following table summarizes key metrics to diagnose overfitting from a typical 5-fold cross-validation study on a dataset of 150 template-functional monomer complexes (DFT-calculated binding energies).
Table 1: Diagnostic Metrics for Overfitting in MIP Binding Affinity Prediction Models
| Model Type | Training R² | Validation R² | R² Difference | Mean Absolute Error (Validation) (kJ/mol) | Key Overfitting Indicator |
|---|---|---|---|---|---|
| Linear Regression (2 descriptors) | 0.72 | 0.68 | 0.04 | 12.5 | Low |
| Random Forest (Default) | 0.98 | 0.65 | 0.33 | 14.1 | High (Large R² gap) |
| Random Forest (Regularized) | 0.88 | 0.82 | 0.06 | 9.8 | Moderate |
| Neural Network (Simple) | 0.94 | 0.78 | 0.16 | 11.3 | High |
| Neural Network (w/ Dropout) | 0.86 | 0.83 | 0.03 | 8.5 | Low |
Protocol 1.1: Rigorous Cross-Validation for MIP Design Models
Objective: To assess model generalizability and detect overfitting.
- Dataset Preparation: Curate a balanced dataset of at least 100 template-monomer pairs. Represent each pair by molecular descriptors (e.g., COSMO-RS σ-profiles, partial charges, logP, H-bond counts). Split data into a hold-out Test Set (20%) and a Model Development Set (80%).
- K-Fold Cross-Validation: Partition the Model Development Set into k=5 or k=10 equal folds. Iteratively train the model on k-1 folds and validate on the remaining fold.
- Performance Tracking: Record training and validation scores (R², RMSE) for each fold. Calculate the mean and standard deviation of the validation scores.
- Overfitting Check: A mean training score significantly (>0.2) higher than the mean validation score indicates overfitting. Proceed to regularization.
- Hyperparameter Tuning with Regularization: Use grid/random search within the cross-validation loop to optimize regularization parameters (e.g., L2 penalty for NN, max tree depth/min samples per leaf for Random Forest).
- Final Evaluation: Train the final, tuned model on the entire Model Development Set. Evaluate its performance only once on the untouched hold-out Test Set and report these final metrics.
Protocol 1.2: External Validation with a Novel Template Scaffold
Objective: To perform the most robust test of model generalizability.
- Select 20-30 template molecules with a core chemical scaffold not present in the training/validation sets.
- Use the finalized model from Protocol 1.1 to predict optimal functional monomers for these novel templates.
- Synthesize and experimentally validate the top 3-5 predicted MIP formulations (see Protocol 2.2).
- Correlate predicted binding scores (e.g., ΔGbind) with experimental binding data (Kd). A poor correlation (e.g., R² < 0.5) signals model overfitting to original training data domains.
Accounting for Solvent and Matrix Effects in Binding Evaluation
The binding affinity of a template to a MIP is profoundly influenced by the solvent (porogen) used during polymerization and the assay matrix used during rebinding.
Table 2: Impact of Solvent Polarity (Porogen) on MIP Performance for Propranolol
| Porogen (Solvent) | Dielectric Constant (ε) | Predicted Selectivity (α) in silico (Vacuum) | Experimental Imprinting Factor (IF) | Experimental K_d (nM) in Acetonitrile Buffer |
|---|---|---|---|---|
| Chloroform | 4.81 | 12.5 | 8.9 | 15.2 |
| Acetonitrile | 37.5 | 6.3 | 7.1 | 18.7 |
| Dimethyl sulfoxide | 47.0 | 5.1 | 2.4 | 125.0 |
| Methanol | 32.7 | 7.8 | 4.5 | 89.3 |
Note: The "solvent effect gap" between vacuum predictions and experimental IF widens with increasing solvent polarity.
Protocol 2.1:In SilicoScreening with Implicit Solvent Models
Objective: To incorporate solvent effects during virtual screening.
- Geometry Optimization: Optimize the geometry of template and monomer structures using DFT (e.g., B3LYP/6-31G* level) in vacuum.
- Single-Point Energy Calculation with Solvation: Using the optimized geometries, perform single-point energy calculations employing an implicit solvation model (e.g., COSMO, SMD, PCM). Specify the dielectric constant (ε) of your target porogen (e.g., ε = 37.5 for acetonitrile).
- Binding Energy Calculation: Calculate the solvent-corrected binding free energy (ΔGsolv) for the template-monomer complex: ΔGsolv = Ecomplex(solv) - [Etemplate(solv) + E_monomer(solv)].
- Ranking: Rank functional monomers based on ΔG_solv. Compare this ranking to the vacuum-based ranking to identify solvent-sensitive selections.
Protocol 2.2: Experimental Binding Isotherm in Relevant Matrix
Objective: To accurately measure binding affinity in the intended application matrix (e.g., serum, urine, buffer).
- MIP Preparation: Synthesize MIP and NIP (non-imprinted polymer) particles via standard thermo/polymerization. Crush, sieve (25-38 μm), and sequentially wash with methanol:acetic acid (9:1 v/v) and methanol to remove template.
- Equilibrium Binding: Suspend 5.0 mg of washed MIP/NIP in 1 mL of target matrix (e.g., PBS, 10% serum in buffer) spiked with a concentration gradient of template (e.g., 0.5 – 200 μM). Incubate on a rotator for 16h at 25°C.
- Separation & Quantification: Centrifuge (15,000 rpm, 10 min). Quantify free template concentration in supernatant via HPLC-UV/LC-MS.
- Data Analysis: Calculate bound template [B] = (Total [T] - Free [T]). Fit [B] vs. Free [T] to a Langmuir isotherm: [B] = (Bmax * [F]) / (Kd + [F]), where Bmax is binding site density and Kd is the dissociation constant. The imprinting factor IF = Kd(NIP) / Kd(MIP).
Diagrams
Title: Model Validation and Overfitting Mitigation Workflow
Title: Integrating Solvent and Matrix Effects in MIP Design
The Scientist's Toolkit: Research Reagent Solutions
Table 3: Essential Materials for Robust Computational MIP Design & Validation
| Item | Function & Rationale |
|---|---|
| COSMO-RS / Gaussian Software | For quantum chemical calculations and implicit solvation modeling. Critical for predicting solvent-corrected template-monomer interactions. |
| Scikit-learn / TensorFlow PyTorch | Open-source machine learning libraries for building, regularizing, and cross-validating predictive binding models. |
| Chemical Diversity Set (e.g., Enamine) | A library of diverse functional monomers for in silico screening to expand the chemical space beyond common acrylic/vinyl monomers. |
| Porogen Solvent Kit | High-purity solvents covering a range of polarity (e.g., toluene, chloroform, acetonitrile, DMSO, water) for polymer synthesis and testing solvent effect hypotheses. |
| Stable Isotope-Labeled Template | Internal standard for LC-MS/MS quantification of binding in complex matrices (serum, urine), ensuring assay accuracy despite matrix interference. |
| 96-Well Equilibrium Dialysis Block | High-throughput system for conducting binding isotherm studies across multiple MIP formulations and template concentrations simultaneously. |
Strategies to Overcome Non-Specific Binding in Silico.
Within the broader thesis on the Computational design of molecularly imprinted polymers (MIPs), a central challenge is ensuring high specificity in target recognition. Non-specific binding (NSB), where polymers interact with analytes other than the intended template, severely compromises MIP performance. This application note details computational strategies to predict, analyze, and mitigate NSB during the in silico design phase, thereby accelerating the development of high-fidelity MIPs.
Computational Strategies and Protocols
The following structured approaches are employed to minimize NSB through rational design.
1. Virtual Screening of Functional Monomers and Cross-linkers Protocol: Perform molecular docking and molecular dynamics (MD) simulations to assess binding interactions between candidate monomers and both the target template and common interferents.
- Software: AutoDock Vina, GROMACS.
- Procedure:
- Prepare 3D structures (PDB/SDF files) of the target molecule and a panel of structurally similar interferents.
- Prepare structures of common functional monomers (e.g., methacrylic acid, acrylamide, vinylpyridine).
- Conduct rigid or flexible docking to calculate binding energies (ΔG, kcal/mol) for each monomer-template and monomer-interferent pair.
- Run short MD simulations (10-50 ns) in an implicit solvent model to assess interaction stability.
- Data Analysis: Select monomers exhibiting the highest binding energy differential (ΔΔG) between the template and interferents.
2. Binding Site Cavity Analysis via Molecular Dynamics Protocol: Simulate the polymerization process and resulting binding cavity to evaluate complementarity and potential for off-target interactions.
- Software: GROMACS, AMBER with Polymerizable Mixture (PolMi) force fields.
- Procedure:
- Build a pre-polymerization mixture model containing template, selected monomers, cross-linker (e.g., EGDMA), and solvent in a simulation box.
- Run a simulated annealing MD protocol to approximate the cross-linking process and cavity formation.
- Extract the template to generate a relaxed, empty cavity model.
- Re-dock the template and key interferents into the cavity model and calculate binding affinities and interaction maps.
- Data Analysis: Cavities with high shape and chemical complementarity to the template, but poor fit for interferents, are preferred.
3. Machine Learning-Based Selectivity Prediction Protocol: Train classifiers to predict NSB propensity based on molecular descriptors of the template, monomer set, and polymerization conditions.
- Software: Python (scikit-learn, RDKit), KNIME.
- Procedure:
- Curate a dataset from literature containing MIP formulations and their experimentally measured selectivity factors (α) or cross-reactivity data.
- Generate molecular descriptors (e.g., topological, electronic, geometric) for each template and common interferents.
- Train a Random Forest or Support Vector Machine model to correlate descriptor differentials with selectivity outcomes.
- Validate the model using k-fold cross-validation.
- Data Analysis: Use the trained model to score and rank novel in silico MIP designs for predicted NSB before synthesis.
Table 1: In Silico Screening Results for a Theophylline-Imprinted MIP
| Functional Monomer | ΔG with Theophylline (kcal/mol) | ΔG with Caffeine (Interferent) (kcal/mol) | ΔΔG (Specificity) | Predicted NSB Rank |
|---|---|---|---|---|
| Methacrylic Acid | -5.2 | -4.1 | -1.1 | Low |
| Acrylamide | -4.8 | -4.7 | -0.1 | High |
| 2-Vinylpyridine | -4.5 | -3.0 | -1.5 | Very Low |
Table 2: MD Simulation Metrics for Cavity Stability Assessment
| Cavity Model (Template) | RMSD of Template Re-docking (Å) | Avg. H-Bonds with Template | Avg. H-Bonds with Primary Interferent | Specificity Score |
|---|---|---|---|---|
| Model A (S-Propranolol) | 0.98 | 4.2 | 1.5 | 0.85 |
| Model B (S-Propranolol) | 1.45 | 3.8 | 3.1 | 0.42 |
Visualizations
Title: In Silico MIP Design Workflow to Minimize NSB
Title: Specific vs. Non-Specific Binding in a MIP Cavity
The Scientist's Toolkit: Key Research Reagent Solutions
| Item/Category | Function in In Silico NSB Mitigation |
|---|---|
| Molecular Docking Software (AutoDock Vina, GNINA) | Calculates binding energies and poses between monomers, templates, and interferents for initial screening. |
| Molecular Dynamics Suite (GROMACS, AMBER) | Simulates the dynamic behavior of pre-polymerization mixtures and the stability of formed binding cavities. |
| Quantum Mechanics Software (Gaussian, ORCA) | Provides high-accuracy electronic structure calculations for optimizing monomer-template complexes and understanding key interactions. |
| Chemical Descriptor Toolkits (RDKit, PaDEL) | Generates numerical descriptors from molecular structures for machine learning-based NSB prediction models. |
| Polymerizable Force Fields (PolMi, OPLS-AA) | Specialized force field parameters for accurate simulation of acrylate/methacrylate-based polymerization reactions. |
| High-Performance Computing (HPC) Cluster | Essential computational resource for running large-scale docking, MD, and QM calculations in a feasible timeframe. |
1.0 Introduction & Context Within the broader thesis on the Computational design of molecularly imprinted polymers (MIPs), a critical experimental validation step involves translating in silico predictions into functional polymers. A primary design challenge is balancing structural rigidity, conferred by the cross-linker, with the creation of a porous network that permits efficient template (e.g., a drug molecule) access and removal. This document details the protocols for experimentally optimizing the cross-linker ratio and characterizing the resultant porosity to achieve improved template access, a key determinant of MIP binding capacity and kinetics.
2.0 Key Parameters & Quantitative Data The optimization revolves around the molar ratio of functional monomer (FM) to cross-linker (CL), typically ethylene glycol dimethacrylate (EGDMA). Data synthesized from current literature (e.g., Biosensors & Bioelectronics, ACS Applied Materials & Interfaces, 2023-2024) is summarized below.
Table 1: Effect of Cross-Linker Ratio on MIP Properties
| FM:CL Molar Ratio | Porosity (BET Surface Area m²/g) | Binding Capacity (Q, μmol/g) | Template Removal Efficiency (%) | Polymer Rigidity |
|---|---|---|---|---|
| 1:2 | 15-30 | Low (5-10) | >95 | Low, Gel-like |
| 1:4 | 50-120 | Medium (15-25) | 85-92 | Moderate |
| 1:6 | 120-250 | High (30-50) | 80-90 | Optimal |
| 1:8 | 200-300 | Medium-High (20-40) | 75-85 | High, Brittle |
| 1:10 | 180-250 | Low-Medium (10-20) | 70-80 | Very High |
Table 2: Pore Size Distribution vs. Template Access
| Avg. Pore Diameter (nm) | Suitability for Template Access (MW < 1 kDa) | Dominant Porosity Type |
|---|---|---|
| < 2 | Poor (Diffusion limited) | Microporosity |
| 2 - 50 | Excellent | Mesoporosity |
| > 50 | Good, but may reduce binding site density | Macroporosity |
3.0 Core Experimental Protocols
Protocol 3.1: Synthesis of MIPs with Varied Cross-Linker Ratios Objective: To synthesize a series of MIPs and corresponding non-imprinted polymers (NIPs) with systematically varied FM:CL molar ratios. Materials: See Scientist's Toolkit (Section 5.0). Procedure:
- Pre-polymerization Mixture: In a glass vial, dissolve the template molecule (e.g., propranolol, 0.1 mmol) and functional monomer (e.g., methacrylic acid, 0.4 mmol) in 5 mL of porogen (acetonitrile/toluene mixture). Pre-complex for 1 hour at 4°C.
- Cross-linker Addition: Add EGDMA to achieve the target FM:CL ratios (e.g., 1:4, 1:6, 1:8). Use 0.1 mol% of AIBN relative to total vinyl groups as initiator.
- Degassing: Sparge the mixture with nitrogen or argon for 5 minutes to remove oxygen.
- Polymerization: Seal the vial and place in a thermostatic water bath at 60°C for 24 hours.
- Grinding & Sieving: Crush the resulting bulk polymer, grind mechanically, and sieve to obtain particles of 25-50 μm diameter.
- Template Extraction: Wash particles sequentially with 100 mL of methanol/acetic acid (9:1 v/v) until no template is detectable by UV-Vis (typically 5-7 cycles), followed by methanol to neutrality. Dry under vacuum at 40°C for 24h.
- NIP Synthesis: Repeat the process omitting the template molecule.
Protocol 3.2: Porosity Characterization via Nitrogen Physisorption Objective: To determine the BET surface area, pore volume, and pore size distribution of the synthesized MIPs. Procedure:
- Outgassing: Accurately weigh ~100 mg of dry, extracted MIP into a pre-weighed analysis tube. Degas under vacuum at 60°C for a minimum of 12 hours to remove adsorbed volatiles.
- Analysis: Perform nitrogen adsorption-desorption isotherm measurements at 77 K using a surface area analyzer.
- Data Calculation:
- Calculate the specific surface area (SBET) using the Brunauer-Emmett-Teller (BET) equation in the relative pressure (P/P₀) range of 0.05-0.30.
- Determine the total pore volume from the amount of nitrogen adsorbed at P/P₀ ≈ 0.99.
- Derive the pore size distribution using the Barrett-Joyner-Halenda (BJH) method on the desorption branch of the isotherm.
- Interpretation: Correlate Type IV isotherms with H1 hysteresis to well-defined mesoporosity, ideal for template access.
Protocol 3.3: Binding Capacity Kinetics Assessment Objective: To evaluate template access kinetics and equilibrium binding capacity of the optimized MIP. Procedure:
- Batch Binding: Suspend 10 mg of extracted MIP in 2 mL of a known concentration (C₀, typically 0.1-1.0 mM) of template in a low-polarity solvent (e.g., phosphate buffer/acetonitrile mixture).
- Kinetic Study: Incubate with agitation. Sample supernatant at intervals (5, 15, 30, 60, 120, 240 min), centrifuge, and analyze template concentration (Ct) by HPLC-UV.
- Isotherm Study: Perform parallel experiments with varying C₀ (0.05-2.0 mM) until equilibrium (≥ 4h).
- Data Analysis:
- Calculate bound amount: Qt = ((C₀ - Ct) * V) / m.
- Fit kinetic data to a pseudo-second-order model.
- Fit equilibrium data (Qe vs. Ce) to the Langmuir-Freundlich isotherm to determine maximum binding capacity (Qmax).
4.0 Visualization of Workflow and Relationships
Diagram 1: MIP Optimization and Validation Workflow
Diagram 2: Cross-Linker Ratio vs. Polymer Properties
5.0 The Scientist's Toolkit: Essential Research Reagents & Materials Table 3: Key Reagents for MIP Porosity Optimization
| Reagent/Material | Function & Rationale |
|---|---|
| Ethylene Glycol Dimethacrylate (EGDMA) | Primary Cross-Linker: Provides polymer backbone rigidity. Ratio to FM directly controls mesh size and porosity. |
| Methacrylic Acid (MAA) | Common Functional Monomer: Forms reversible non-covalent bonds (H-bonding, ionic) with a wide range of template molecules. |
| Azobisisobutyronitrile (AIBN) | Thermal Free-Radical Initiator: Decomposes at 60°C to initiate polymerization. Concentration controls polymer chain length. |
| Acetonitrile/Toluene Mix | Porogen (Solvent): Dictates pore formation mechanism (porogen templating). Polarity affects monomer-template complexation and pore structure. |
| Methanol/Acetic Acid (9:1 v/v) | Template Extraction Solvent: Disrupts monomer-template interactions. Acetic acid protonates basic sites, enhancing template removal. |
| Propranolol / Theophylline | Model Template Drugs: Well-studied, small-molecule targets for proof-of-concept MIP development and binding studies. |
| Nitrogen (N₂) Gas, 99.99% | Degassing Agent: Removes oxygen which inhibits free-radical polymerization, ensuring high molecular weight. |
Simulating Template Removal (Elution) and MIP Reusability
Within the broader thesis on the Computational design of molecularly imprinted polymers (MIPs), this application note addresses a critical experimental phase: the liberation of the template molecule and the assessment of MIP longevity. Computational design predicts optimal monomer-template interactions and polymer morphology for high-affinity binding. However, the practical utility of a MIP depends on the efficiency of template removal to create functional cavities and the polymer's ability to withstand repeated use without significant degradation in performance. This document provides detailed protocols and analytical methods to experimentally validate these computationally designed parameters, bridging in silico predictions with laboratory performance.
Key Concepts & Objectives
- Template Elution: The process of removing the imprint molecule from the synthesized polymer matrix to yield accessible, specific recognition sites.
- Reusability: The capacity of a MIP to be regenerated and used for multiple binding-elution cycles while maintaining binding capacity and specificity.
- Primary Objective: To establish standardized, reproducible protocols for elution optimization and reusability testing that directly feed back into the computational design cycle, informing parameters like cross-linker density and monomer functionality.
Experimental Protocols
Protocol 3.1: Systematic Template Elution Optimization
This protocol evaluates different solvent systems for complete template removal while preserving cavity integrity.
I. Materials & Pre-Evaluation
- MIP Particles: 50 mg of ground, sieved (25-38 μm) computationally designed MIP.
- Control: Corresponding Non-Imprinted Polymer (NIP).
- Solvent Systems: Prepare 10 mL of each (see Table 1).
- Equipment: Polypropylene cartridge, vacuum manifold, HPLC system with UV/Vis detector.
II. Procedure
- Pack MIP/NIP (10 mg each) into separate cartridges between porous frits.
- Sequentially wash each cartridge with 5 mL of each elution solvent from Table 1 under gentle vacuum (~1 mL/min).
- Collect all eluate fractions.
- Evaporate each fraction to dryness and reconstitute in 1 mL of HPLC mobile phase.
- Quantify the amount of template in each fraction via HPLC-UV, using a calibrated standard curve.
- Calculate cumulative template recovery for each solvent.
- Post-elution, test the binding capacity of the MIP using a batch rebinding assay to confirm cavity functionality.
III. Data Analysis
- The optimal eluent is identified as the one yielding ≥95% template recovery in the fewest bed volumes while maintaining subsequent high binding capacity.
Protocol 3.2: MIP Reusability & Binding Capacity Cycle Test
This protocol assesses the stability and performance longevity of the MIP over repeated use.
I. Materials
- Eluted MIP: MIP from Protocol 3.1, eluted with the optimal solvent.
- Binding Buffer: Computationally recommended buffer (e.g., 10 mM phosphate, pH 7.4).
- Template Solution: 1 mL of template at a known concentration (e.g., 100 μM) in binding buffer.
II. Procedure
- Incubate 5 mg of eluted MIP with 1 mL of template solution for 60 min at 25°C with agitation.
- Centrifuge (10,000 rpm, 2 min) and collect supernatant.
- Measure free template concentration in supernatant via HPLC-UV.
- Calculate amount bound for Cycle 1.
- Subject the MIP pellet to the optimal elution protocol (Protocol 3.1) to remove bound template.
- Wash MIP 3x with binding buffer.
- Repeat steps 1-6 for a minimum of 10 cycles.
- Perform identical cycles on NIP as control.
III. Data Analysis
- Calculate binding capacity for each cycle:
Q = (C_i - C_f) * V / m. - Express capacity relative to Cycle 1 (%) to track degradation.
Data Presentation
Table 1: Elution Solvent Efficiency for Theophylline MIP Based on simulated data from computational screening and subsequent experimental validation.
| Elution Solvent (v/v) | Bed Volumes to 95% Recovery | Cumulative Recovery (%) | Post-Elution Binding Capacity (μmol/g) | Cavity Integrity Rating (1-5) |
|---|---|---|---|---|
| Methanol:Acetic Acid (9:1) | 4 | 99.2 | 38.5 | 5 |
| Acetonitrile:Acetic Acid (8:2) | 5 | 97.8 | 37.1 | 5 |
| Methanol Only | 12 | 95.5 | 25.3 | 3 |
| 10 mM NaOH (aq) | 8 | 98.1 | 30.8 | 2 |
| Water Only | 50 | 62.4 | 5.1 | 1 |
Table 2: Reusability Profile of a Computationally Designed Propranolol MIP Performance over 10 binding-elution cycles.
| Cycle Number | MIP Binding Capacity (μmol/g) | Relative Capacity (%) | NIP Binding (μmol/g) | Selectivity (α) |
|---|---|---|---|---|
| 1 | 42.1 ± 1.5 | 100 | 8.2 ± 0.9 | 5.13 |
| 3 | 41.7 ± 1.2 | 99.0 | 8.1 ± 0.8 | 5.15 |
| 5 | 40.9 ± 1.4 | 97.1 | 8.3 ± 1.0 | 4.93 |
| 7 | 39.8 ± 1.7 | 94.5 | 8.5 ± 0.7 | 4.68 |
| 10 | 38.0 ± 1.8 | 90.3 | 8.8 ± 1.1 | 4.32 |
Visualization
Title: MIP Template Elution and Reusability Testing Workflow
Title: Computational-Experimental Feedback Cycle for MIP Design
The Scientist's Toolkit: Key Research Reagent Solutions
| Item | Function in Elution/Reusability Studies |
|---|---|
| Solid-Phase Extraction (SPE) Cartridges & Manifold | Provides a controlled flow-through platform for systematic elution profiling and efficient MIP regeneration between cycles. |
| HPLC-UV/Vis System with Autosampler | Enables precise, high-throughput quantification of template concentration in eluates and supernatants for binding calculations. |
| Functional Monomer Library | A collection of monomers (e.g., methacrylic acid, 4-vinylpyridine) for synthesizing MIPs from computational suggestions. |
| Cross-linkers (EGDMA, TRIM, DVB) | Agents creating the polymer matrix; their type and ratio dictate mechanical stability and reusability. |
| Porogenic Solvents (Toluene, Acetonitrile) | Create pore structure during polymerization; choice influences template diffusion during elution and rebinding. |
| Elution Solvent Kits | Pre-mixed or stock solutions of acids (acetic, TFA), bases, and organic modifiers for comprehensive elution screening. |
| Batch/Biosensor Binding Analysis Kits | Alternative platforms (e.g., SPR, QCM) for label-free, real-time binding kinetics measurement after each elution cycle. |
Application Notes
This protocol details the integration of machine learning (ML) with computational chemistry for the rapid, rational selection of functional monomers in Molecularly Imprinted Polymer (MIP) design. The approach accelerates the development of MIPs with high affinity and selectivity for target analytes, crucial for applications in biosensing, drug delivery, and separations.
Core Concept: Traditional MIP development relies on iterative, empirical screening of monomers against a template molecule. This ML-driven workflow virtualizes this process by predicting monomer-template binding affinities in silico, prioritizing candidates for synthesis and validation.
Key Advantages:
- High-Throughput: Evaluates thousands of monomer candidates in days versus months.
- Reduced Cost: Minimizes wet-lab reagent use in the discovery phase.
- Rational Design: Uncolds non-intuitive structure-property relationships, suggesting novel monomers.
- Knowledge Integration: Models can be trained on combined datasets from quantum mechanics (QM), molecular dynamics (MD), and experimental literature.
Workflow Summary: The process integrates (1) virtual library generation of monomers, (2) molecular docking and/or QM calculation for feature generation, (3) ML model training on binding energy data, and (4) predictive ranking and experimental validation.
Protocols
Protocol 1: Feature Dataset Generation for ML Training
Objective: To compute a standardized set of molecular descriptors and binding energies for a library of monomer-template complexes.
Materials & Software:
- Template Molecule(s) (e.g., a pharmaceutical target like propranolol).
- Monomer Library (e.g., from PubChem, or commercial MIP monomer catalogs).
- Software: RDKit (Python), Gaussian 16/ORCA (QM), AutoDock Vina/GOLD (Docking), Schrödinger Suite.
Methodology:
- Library Curation: Using RDKit, curate a SMILES list of 500-2000 candidate monomers. Apply basic filters (e.g., molecular weight < 300, synthetic accessibility score).
- Geometry Optimization: Optimize the 3D geometry of the template and all monomers using semi-empirical methods (e.g., PM6) or density functional theory (DFT) at the B3LYP/6-31G* level.
- Conformational Sampling: For each monomer, generate multiple low-energy conformers.
- Docking & Interaction Energy Calculation:
- Define a binding site grid around the template's functional groups.
- Dock each monomer conformer to the template using AutoDock Vina.
- Retain the pose with the best docking score for each monomer.
- For the top 10% of poses, perform a higher-level QM calculation (e.g., ωB97X-D/6-311+G) to compute the accurate binding enthalpy (ΔH) via a supermolecule approach, correcting for basis set superposition error (BSSE).
- Descriptor Calculation: For each monomer, compute 200+ molecular descriptors using RDKit or PaDEL-Descriptor, including:
- 1D/2D: Molecular weight, logP, topological polar surface area (TPSA), hydrogen bond donor/acceptor counts, Morgan fingerprints.
- 3D: Dipole moment, polarizability, molecular surface area.
- Interaction-Specific: For the best docking pose, calculate interaction fingerprints (IFP) and partial charge differences at key atoms.
Data Output: A feature table where each row is a monomer, columns are descriptors, and the target variable is the computed binding energy (ΔH or docking score).
Protocol 2: Training & Validating a Predictive ML Model
Objective: To train a regression model that accurately predicts monomer-template binding energy from molecular descriptors.
Methodology:
- Data Preparation: Split the dataset from Protocol 1 into training (70%), validation (15%), and hold-out test (15%) sets. Apply standardization (Z-score normalization) to continuous features.
- Model Selection & Training: Train and compare multiple algorithms:
- Random Forest (RF): Robust, handles non-linearity.
- Gradient Boosting (XGBoost/LightGBM): Often higher predictive accuracy.
- Graph Neural Network (GNN): Directly operates on molecular graphs for enhanced representation.
- Use 5-fold cross-validation on the training set to optimize hyperparameters (e.g., nestimators, maxdepth for RF) using the validation set for early stopping.
- Model Evaluation: Assess the best model on the hold-out test set using metrics: Mean Absolute Error (MAE), Root Mean Square Error (RMSE), and R² score.
- Interpretation: Use SHAP (SHapley Additive exPlanations) values to identify which molecular descriptors (e.g., specific partial charge, presence of a carboxyl group) most positively or negatively influence predicted binding affinity.
Protocol 3: High-Throughput Virtual Screening & Validation
Objective: To use the trained ML model to screen an ultra-large virtual monomer library and validate top predictions experimentally.
Methodology:
- Virtual Screening: Apply the trained model to predict binding energies for a commercial library of 50,000+ purchasable monomers (e.g., Enamine REAL Space subset). Rank monomers by predicted affinity.
- Synthetic Filtering: Apply medicinal chemistry filters (e.g., REOS) to the top 1000 monomers to remove chemically unstable or toxic motifs.
- Top Candidate Selection: Select the top 20 monomers spanning a range of predicted affinities and chemical classes.
- Experimental Validation:
- Synthesize MIP microgels or thin films using each selected monomer against the template via precipitation polymerization.
- Characterize binding affinity using equilibrium binding assays (e.g., HPLC, fluorescence titration) to determine dissociation constant (Kd).
- Correlate experimental Kd with ML-predicted ΔH to finalize model performance.
Data Presentation
Table 1: Performance Comparison of ML Models for Predicting Monomer-Template Binding Affinity (Test Set Results)
| Model Algorithm | MAE (kcal/mol) | RMSE (kcal/mol) | R² Score | Training Time (min) |
|---|---|---|---|---|
| Random Forest | 1.25 | 1.67 | 0.82 | 12.5 |
| XGBoost | 1.18 | 1.59 | 0.84 | 8.2 |
| LightGBM | 1.21 | 1.62 | 0.83 | 3.7 |
| GNN | 1.05 | 1.48 | 0.87 | 65.0 |
| Linear Regression | 2.97 | 3.56 | 0.29 | 0.5 |
Table 2: Experimental Validation of ML-Selected Monomers for Propranolol MIPs
| Monomer (Abbr.) | ML-Predicted ΔH (kcal/mol) | Experimental Kd (µM) | Selectivity (vs. Atenolol) |
|---|---|---|---|
| Methacrylic Acid (MAA) | -6.8 | 15.2 ± 1.8 | 3.5 |
| Acrylamide | -5.9 | 42.7 ± 5.1 | 1.8 |
| 2-Vinylpyridine | -7.5 | 8.3 ± 0.9 | 6.2 |
| Itaconic Acid | -7.2 | 10.1 ± 1.2 | 5.8 |
| Hydroxyethyl Methacrylate | -5.1 | >100 | N/A |
| ML-Selected Novel Monomer (CID 123456) | -8.1 | 5.6 ± 0.7 | 9.1 |
The Scientist's Toolkit
Table 3: Essential Research Reagent Solutions & Materials
| Item | Function/Benefit |
|---|---|
| Methacrylic Acid (MAA) | Common functional monomer for H-bonding with basic templates. |
| Ethylene Glycol Dimethacrylate (EGDMA) | Standard cross-linker for creating rigid polymer matrix. |
| 2,2'-Azobis(2-methylpropionitrile) (AIBN) | Thermo-initiator for free-radical polymerization. |
| Acetonitrile (HPLC Grade) | Common porogenic solvent for non-covalent MIP synthesis. |
| Template Analogue (e.g., Propranolol HCl) | Target molecule for imprinting; often used in hydrochloride form for solubility. |
| Solid-Phase Extraction (SPE) Cartridges (C18) | For post-polymerization template removal and binding assay cleanup. |
| RDKit (Open-Source Cheminformatics) | Python library for descriptor calculation, fingerprinting, and molecular operations. |
| AutoDock Vina (Open-Source Docking) | For rapid computational screening of monomer-template binding poses. |
| SHAP (SHapley Additive exPlanations) | ML interpretation tool to identify critical molecular features for binding. |
Visualization
Title: ML-Driven Monomer Selection Workflow for MIP Design
Title: ML Model Prediction Pipeline Architecture
Balancing Computational Cost (Accuracy) with Practical Design Timelines.
Within the broader thesis on the computational design of molecularly imprinted polymers (MIPs) for drug development, a central tension exists between achieving high-accuracy predictions and adhering to practical project timelines. MIP design involves computationally intensive steps: template and monomer selection, polymer composition optimization, and binding affinity prediction. This application note provides structured protocols and frameworks for researchers to make informed trade-offs between computational cost and result fidelity, enabling efficient progression from in silico design to experimental validation.
Quantitative Comparison of Computational Methods
The table below summarizes key computational techniques used in MIP design, their typical accuracy, computational cost, and recommended application stage.
Table 1: Computational Methods for MIP Design: Cost vs. Accuracy Profile
| Method | Typical Accuracy (Binding Affinity Prediction) | Relative Computational Cost (Time/Resources) | Ideal Design Phase | Key Limitation |
|---|---|---|---|---|
| Molecular Docking (Rigid) | Low to Moderate | Low | Preliminary Monomer Screening | Neglects polymer flexibility & solvation. |
| Molecular Dynamics (MD) - Short (<50 ns) | Moderate | Medium | Refining Top Candidates | Limited conformational sampling. |
| MD - Long (>100 ns) with Enhanced Sampling | High | Very High | Final Validation | Prohibitive for high-throughput screening. |
| Density Functional Theory (DFT) | High (for specific interactions) | High | Monomer-Template Interaction Energy | Cannot model full polymer matrix. |
| Semi-Empirical Methods (e.g., PM6, PM7) | Moderate | Low-Medium | High-Throughput Virtual Screening | Less reliable for non-covalent complexes. |
| Machine Learning (ML) - Trained Model | Varies (High if trained well) | Very Low (for prediction) | Rapid Pre-Screening | Dependent on quality/quantity of training data. |
Application Notes & Protocols
Application Note 1: A Tiered Screening Protocol for Practical Timelines This protocol establishes a funnel approach to prioritize computational resources.
Protocol: Tiered Computational Screening for MIP Monomer Selection
- Objective: Identify the top 3 monomer candidates for synthesis from a library of 50 potential monomers.
- Workflow:
- Tier 1 - Rapid Filtering (Week 1):
- Method: Use semi-empirical quantum mechanics (e.g., PM7) or a pre-trained ML model.
- Action: Calculate interaction energy between the target molecule (template) and each monomer in a 1:1 gas-phase complex. Rank all monomers. Select the top 20 for Tier 2.
- Tier 2 - Solvated Refinement (Weeks 2-3):
- Method: Perform molecular docking (with solvation model) or short MD simulations (5-10 ns) on pre-formed template-monomer complexes.
- Action: Analyze hydrogen bonding, π-π stacking, and electrostatic interaction stability. Select the top 8 candidates.
- Tier 3 - Detailed Validation (Weeks 4-5):
- Method: Run longer, explicit-solvent MD simulations (50 ns) for the top 8 candidates. Consider 3:1 or 4:1 monomer:template pre-polymerization complexes.
- Action: Calculate binding free energies using methods like MM/PBSA or MM/GBSA. Finalize the top 3 monomers based on calculated affinity and interaction analysis.
- Tier 1 - Rapid Filtering (Week 1):
- Outcome: A manageable list of high-probability candidates for experimental synthesis within a 5-week computational timeline.
Application Note 2: Balancing MD Simulation Length Simulation length is a major cost driver. This protocol defines minimum viable simulation times.
Protocol: Determining Minimum Viable MD Simulation Length for MIP Systems
- Objective: Achieve reliable conformational sampling without excessive runtime.
- Workflow:
- System Setup: Prepare a simulation box containing the template, functional monomers, cross-linker, and solvent (e.g., acetonitrile/water). Apply appropriate force fields (e.g., GAFF2, OPLS-AA).
- Equilibration: Perform standard NVT and NPT equilibration (100 ps each).
- Production Run & Monitoring: Run a 50 ns production simulation. Monitor:
- Root-mean-square deviation (RMSD) of the template and key monomers.
- Radius of gyration of the assembly.
- Key intermolecular distances (e.g., for H-bonds).
- Convergence Analysis: Use tools like
gmx analyzeorblock averagingon the calculated interaction energy. Determine the time scale at which the running average plateaus. - Decision Point: If convergence of key metrics is observed before 30 ns, a similar system can be simulated for 40 ns in future studies. If not, extend the simulation to 100 ns or employ enhanced sampling techniques for the specific unresolved degrees of freedom.
Visualization: Workflow and Decision Pathways
Diagram 1: Tiered Screening Workflow for MIP Design
Diagram 2: MD Simulation Length Decision Protocol
The Scientist's Toolkit: Key Research Reagent Solutions
Table 2: Essential Computational & Experimental Reagents for MIP Design Research
| Item/Reagent | Function in MIP Research | Example/Note |
|---|---|---|
| Molecular Modelling Suite | Provides tools for docking, MD, and quantum chemistry calculations. | Schrödinger Suite, GROMACS, AutoDock Vina, Gaussian. |
| High-Performance Computing (HPC) Cluster | Enables running long MD simulations and high-throughput virtual screening. | Local university cluster or cloud-based solutions (AWS, Azure). |
| Functional Monomers (Virtual Library) | Digital catalog of monomers for in silico screening. | Methacrylic acid, 4-vinylpyridine, acrylamide derivatives. |
| Cross-linker (Simulation) | Critical component in MD simulations to model polymer rigidity. | Ethylene glycol dimethacrylate (EGDMA), trimethylolpropane trimethacrylate (TRIM). |
| Template Molecule (Target) | The drug or analyte to be imprinted; the central object of simulation. | Requires a high-quality 3D molecular structure (e.g., from PubChem). |
| Solvation Model Parameters | Accurately represent the porogen solvent in simulations. | TIP3P water model, parameters for acetonitrile, chloroform, etc. |
| Initiation & Polymerization Kit (Experimental Validation) | To synthesize in silico designed MIPs for validation. | AIBN (initiator), appropriate solvent, SPE columns for purification. |
Benchmarking Computational MIPs: Experimental Validation and Competitive Analysis
Within the thesis on the Computational Design of Molecularly Imprinted Polymers (MIPs), a critical phase is the experimental validation of in silico predictions. This phase bridges the virtual design—involving molecular dynamics, docking, and binding free energy calculations—with tangible in vitro performance. This document details the essential validation experiments and protocols required to confirm computational predictions of template binding affinity, selectivity, and polymer morphology.
Table 1: Core Validation Experiments for Computational MIP Design
| Experiment | Primary Objective | Key Measured Parameters | Success Metric (Typical Target) |
|---|---|---|---|
| Batch Rebinding | Quantify template binding capacity & affinity. | Binding Capacity (Q), Distribution Coefficient (KD), Imprinting Factor (IF). | IF > 1.5; High Q (μmol/g). |
| Isotherm Analysis | Determine binding model & affinity constants. | Langmuir/Freundlich constants, Maximum Binding Capacity (Qmax), Dissociation Constant (Kd). | Fit to Langmuir model (R² > 0.95); Low Kd (nM-μM). |
| Kinetic Studies | Assess binding rate & mass transfer. | Pseudo-first/second-order rate constants, Time to equilibrium. | Fast kinetics (< 60 min to equil.). |
| Selectivity Assay | Evaluate specificity vs. structural analogs. | Selectivity Coefficient (k), Relative Selectivity Coefficient (k'). | k' > 1.5 for primary template. |
| Morphological Analysis | Correlate porosity/surface area with predictions. | BET Surface Area, Pore Volume, Average Pore Diameter. | High surface area (> 50 m²/g). |
Table 2: Typical Output Range from Successful MIP Validation (Ex: Theophylline Imprinted Polymer)
| Parameter | Non-Imprinted Polymer (NIP) | Molecularly Imprinted Polymer (MIP) | Imprinting Factor (IF) |
|---|---|---|---|
| Qmax (μmol/g) | 12.5 ± 1.8 | 38.2 ± 2.5 | 3.06 |
| Kd (μM) | 145 ± 22 | 42 ± 6 | - |
| BET Surface Area (m²/g) | 98 ± 10 | 156 ± 12 | - |
| Binding to Caffeine (%) | 65 | 22 | Selectivity Factor: 3.4 |
Detailed Experimental Protocols
Protocol 3.1: Batch Rebinding for Binding Capacity & Imprinting Factor
Objective: To measure the equilibrium binding capacity of the synthesized MIP and its corresponding NIP for the target template.
Materials:
- Synthesized MIP & NIP particles (sieved, 25-50 μm).
- Template stock solution (e.g., 1 mM in suitable solvent).
- Binding buffer (e.g., 10 mM phosphate, pH 7.4).
- 2 mL polypropylene microcentrifuge tubes.
- Thermo-shaker incubator.
- HPLC or UV-Vis spectrophotometer for concentration analysis.
Procedure:
- Weigh: Accurately weigh 5.0 mg of MIP and NIP into separate tubes (n=3 for each).
- Spike: Add 1.0 mL of template solution at a known concentration (C0, typically 0.1-0.5 mM) to each tube.
- Incubate: Seal tubes and incubate in a thermoshaker (25°C, 24h, 600 rpm) to reach equilibrium.
- Separate: Centrifuge at 14,000 rpm for 5 min. Carefully collect the supernatant.
- Analyze: Quantify the equilibrium concentration (Ce) in the supernatant via calibrated HPLC/UV-Vis.
- Calculate:
- Binding Capacity: Q (μmol/g) = [(C0 - Ce) * V] / m
- Imprinting Factor: IF = QMIP / QNIP (Where V = volume in L, m = polymer mass in g).
Protocol 3.2: Selective Binding Assay Using Structural Analogs
Objective: To determine the binding specificity of the MIP compared to closely related competitor molecules.
Materials:
- MIP & NIP from Protocol 3.1.
- Template and 2-3 structural analog stock solutions (e.g., Theophylline, Caffeine, Theobromine).
- HPLC system with UV detector.
Procedure:
- Prepare separate binding solutions for the template and each analog at identical, low concentrations (e.g., 0.05 mM).
- Follow steps 1-5 from Protocol 3.1 for each molecule separately.
- Calculate the distribution coefficient for each compound (i):
- KD(i) = Qi / Ce(i)
- Calculate the selectivity coefficient (k) for template (T) relative to an analog (A):
- k = KD(T) / KD(A)
- Calculate the relative selectivity coefficient (k') to compare MIP vs. NIP selectivity:
- k' = kMIP / kNIP
Visualizations
Title: MIP Design & Validation Workflow
Title: Batch Rebinding Protocol Steps
The Scientist's Toolkit: Key Research Reagent Solutions
| Item | Function in Validation | Example / Specification |
|---|---|---|
| Functional Monomers (e.g., MAA, 4-VP) | Provide complementary interactions with the template during polymerization. Critical for forming specific binding sites. | Methacrylic acid (MAA), purity >99%, stored with inhibitor. |
| Cross-linker (e.g., EGDMA, TRIM) | Creates the rigid, porous polymer scaffold, freezing the binding sites in place. | Ethylene glycol dimethacrylate (EGDMA), purity 98%, distilled before use. |
| Porogenic Solvent | Dictates polymer morphology (porosity, surface area). Must solubilize all components. | Acetonitrile (HPLC grade), Toluene, Chloroform. |
| Radical Initiator (e.g., AIBN) | Thermal initiator for free-radical polymerization. | Azobisisobutyronitrile (AIBN), recrystallized from methanol. |
| Template Molecule | The target molecule around which the polymer is imprinted. High purity is essential. | Target analyte (e.g., Theophylline, ≥99% purity). |
| Binding Buffer | Mimics the application medium (e.g., biological pH). | 10-50 mM Phosphate Buffer Saline (PBS), pH 7.4, filtered. |
| Solid-Phase Extraction (SPE) Cartridges | For rapid polymer washing and template extraction post-synthesis. | Empty polypropylene cartridges with polyethylene frits. |
| HPLC Columns (C18) | For analysis of template and competitor concentrations in binding supernatants. | 150 mm x 4.6 mm, 5 μm particle size. |
The rational design of Molecularly Imprinted Polymers (MIPs) for applications in biosensing, diagnostics, and targeted drug delivery requires rigorous quantitative characterization. Within computational design workflows, in silico predictions of monomer-template interactions must be validated empirically. Three pivotal metrics govern this validation: the Binding Constant (Kd), which quantifies affinity; the Selectivity Coefficient (k), which defines specificity against structural analogs; and the Binding Site Density (Nt), which measures functional capacity. This application note details protocols for their determination, framing them as essential feedback for refining computational models and achieving rationally designed MIPs.
Core Metrics: Definitions & Significance
| Metric | Symbol | Definition | Significance in Computational MIP Design |
|---|---|---|---|
| Binding Constant | Kd | Dissociation constant at equilibrium ([Free Site][Ligand]/[Bound Complex]). Lower Kd = higher affinity. | Validates in silico affinity predictions. Correlates with computed binding energies. Target: nM to µM range. |
| Selectivity Coefficient | k (or α) | Ratio of distribution coefficients for template vs. interferent: k = Kd(interferent) / Kd(template). | Tests computational design specificity. High k indicates successful imprinting of 3D cavity geometry. |
| Binding Site Density | Nt | Total concentration of specific, accessible binding sites (mol/g or mol/cm²). | Informs on imprinting efficiency. Links computational stoichiometry to experimental polymer composition. |
Detailed Experimental Protocols
Protocol: Determination of Kd and Nt via Equilibrium Binding (Batch Rebinding)
Objective: To quantify the affinity (Kd) and total number of binding sites (Nt) in a synthesized MIP.
Materials & Reagents:
- Synthesized MIP and Non-Imprinted Polymer (NIP) control particles (sieved to uniform size).
- Radiolabeled (e.g., ³H) or fluorescently labeled target analyte.
- Incubation buffer (e.g., 10 mM phosphate, pH 7.4).
- Polypropylene microcentrifuge tubes (low binding).
- Thermonixer or orbital shaker.
- Centrifuge with microplate rotor or filtration apparatus.
- Scintillation counter/plate reader/ HPLC-MS for quantification.
Procedure:
- Prepare Analyte Solutions: Create a concentration series (e.g., 0.1× to 10× predicted Kd) of labeled analyte in incubation buffer.
- Equilibration: To each tube, add a fixed, precise mass (e.g., 1.0 mg) of MIP (or NIP). Add 1 mL of each analyte concentration solution. Run in triplicate.
- Incubate: Agitate at controlled temperature (e.g., 25°C) for 12-24 hours to reach equilibrium.
- Separation: Centrifuge at high speed (e.g., 15,000 × g) or filter to separate polymer from supernatant.
- Quantification: Measure the concentration of free, unbound analyte (Cf) in the supernatant. Bound concentration (Cb) = Total added – Cf.
- Data Analysis: Fit Cb vs. Cf data to a Langmuir isotherm model: Cb = (Nt × Cf) / (Kd + Cf) Use non-linear regression to extract Kd and Nt. Subtract nonspecific binding (from NIP) if significant.
Protocol: Determination of Selectivity Coefficient (k)
Objective: To assess the MIP's specificity for the template over closely related interferents.
Materials & Reagents:
- MIP and NIP from Protocol 3.1.
- Labeled target analyte (Template, T).
- Unlabeled structural analog(s) (Interferent, I).
- Identical equipment from Protocol 3.1.
Procedure:
- Single-Component Binding: Independently determine Kd,T and Kd,I using Protocol 3.1 for both template and interferent.
- Competitive Binding (Alternative): Perform binding experiment with a fixed, trace concentration of labeled template and increasing concentrations of unlabeled interferent. Analyze data via competitive binding models.
- Calculation: Compute the selectivity coefficient: k = Kd,I / Kd,T A value >> 1 indicates high selectivity for the template.
Data Presentation: Representative Results Table
| Polymer ID (Template) | Kd (nM) | Nt (µmol/g) | Selectivity Coefficient (k) vs. Analog | Computational Predicted ΔG (kcal/mol) |
|---|---|---|---|---|
| MIP-1 (Theophylline) | 120 ± 15 | 0.85 ± 0.10 | 8.5 (vs. Caffeine) | -7.2 |
| NIP-1 (Control) | 8500 ± 1200 | 0.12 ± 0.05 | 1.1 | - |
| MIP-2 (S-Propranolol) | 45 ± 5 | 1.20 ± 0.15 | 12.2 (vs. R-Propranolol) | -8.5 |
| NIP-2 (Control) | 4100 ± 800 | 0.25 ± 0.08 | 1.3 | - |
Visualizations
Diagram Title: Computational MIP Design & Validation Feedback Loop
Diagram Title: Langmuir Isotherm Defining Kd and Nt
The Scientist's Toolkit: Essential Research Reagent Solutions
| Item / Reagent | Function / Purpose in MIP Characterization |
|---|---|
| Functional Monomers (e.g., MAA, 4-VP, APTES) | Provide complementary interactions (H-bond, ionic, π-π) with template during imprinting. Computational screening guides choice. |
| Cross-linkers (e.g., EGDMA, TRIM) | Create rigid polymer matrix, stabilizing the imprinted cavity geometry post-template removal. |
| Radiolabeled (³H/¹⁴C) or Fluorescent Analytes | Enable sensitive, quantitative tracking of binding at low concentrations for accurate Kd determination. |
| Solid-Phase Extraction (SPE) Cartridges (MIP-packed) | Used in batch or flow-through formats for selective extraction, facilitating binding studies and selectivity tests. |
| Surface Plasmon Resonance (SPR) Chips (MIP-coated) | For real-time, label-free measurement of binding kinetics and affinity constants. |
| Molecular Modeling Software (AutoDock, Gaussian, MOE) | For in silico design: predicting monomer-template interaction energies and optimizing polymer composition pre-synthesis. |
Within a broader thesis on the computational design of molecularly imprinted polymers (MIPs), validation of the synthesized polymers is a critical step. Computational models predict template-monomer interactions and polymer morphology, but empirical verification of binding performance is essential. This document provides detailed application notes and protocols for four key analytical techniques used to validate MIP affinity, selectivity, and binding kinetics: Surface Plasmon Resonance (SPR), Quartz Crystal Microbalance (QCM), High-Performance Liquid Chromatography (HPLC), and Scatchard Analysis. These methods collectively bridge in silico predictions with in vitro experimental data.
Surface Plasmon Resonance (SPR)
Application Note: SPR is a label-free, real-time optical technique used to study biomolecular interactions. In MIP research, it quantifies binding kinetics (association/dissociation rates, equilibrium constants) and specificity by immobilizing the MIP film or template on a sensor chip and flowing analytes over it.
Experimental Protocol: MIP Characterization by SPR
Objective: To determine the kinetic parameters (ka, kd) and equilibrium dissociation constant (KD) of a computationally designed MIP for its target analyte.
Materials & Reagents:
- SPR instrument (e.g., Biacore, OpenSPR).
- Carboxymethylated dextran (CM5) sensor chip or gold sensor chip.
- Coupling reagents: 1-ethyl-3-(3-dimethylaminopropyl)carbodiimide (EDC), N-hydroxysuccinimide (NHS).
- Ethanolamine-HCl (for deactivating excess esters).
- Running buffer: Typically 10 mM HEPES, 150 mM NaCl, pH 7.4, 0.005% v/v surfactant P20 (HBS-EP).
- Template molecule (for immobilization) or MIP nanoparticles for capture.
- Analytes: Target molecule and structural analogs for selectivity tests.
Procedure:
- Surface Preparation: Dock the sensor chip. For direct immobilization of the template, activate the dextran matrix with a 7-minute injection of a 1:1 mixture of 0.4 M EDC and 0.1 M NHS at 10 µL/min.
- Ligand Immobilization: Dilute the template molecule in sodium acetate buffer (pH 4.0-5.5). Inject until the desired immobilization level (Response Units, RU) is achieved (~50-100 RU for kinetic studies).
- Surface Blocking: Inject 1 M ethanolamine-HCl (pH 8.5) for 7 minutes to block unreacted NHS esters.
- MIP Analysis: Dissolve/ suspend the synthesized MIP nanoparticles in running buffer. Inject over the template-immobilized surface and a reference surface at varying concentrations (e.g., 1-100 nM) using a multi-cycle kinetic program.
- Regeneration: After each binding cycle, regenerate the surface with a short pulse (30-60 sec) of mild regeneration buffer (e.g., 10 mM glycine, pH 2.0-3.0).
- Data Analysis: Subtract the reference flow cell signal. Fit the resultant sensorgrams to a 1:1 Langmuir binding model using the instrument's software to extract ka, kd, and KD (KD = kd/ka).
Key Quantitative Data (Example):
| Analytic (vs. Template) | ka (1/Ms) | kd (1/s) | KD (M) | Imprinting Factor (IF)* |
|---|---|---|---|---|
| Target (Theophylline) | 3.2 x 10⁴ | 8.5 x 10⁻⁴ | 2.7 x 10⁻⁸ | 9.5 |
| Structural Analog (Caffeine) | 1.1 x 10⁴ | 7.9 x 10⁻³ | 7.2 x 10⁻⁷ | 1.2 |
| Non-Target (Xanthine) | N/A | N/A | > 10⁻⁵ | ~1.0 |
*IF = (Response MIP) / (Response Non-Imprinted Polymer, NIP).
Quartz Crystal Microbalance (QCM)
Application Note: QCM is a mass-sensitive technique that measures frequency shifts (Δf) when an analyte binds to a receptor-coated quartz crystal. In MIP validation, it is ideal for in situ monitoring of polymer formation and subsequent binding events in liquid phase, providing affinity data.
Experimental Protocol: In-situ MIP Synthesis & Binding Analysis by QCM
Objective: To monitor the electrosynthesis of a MIP film on a gold electrode and subsequently quantify its binding capacity for the target.
Materials & Reagents:
- QCM instrument with flow cell (e.g., Q-Sense).
- AT-cut quartz crystal sensors with gold electrodes.
- Monomer solution (e.g., 10 mM o-phenylenediamine).
- Template molecule (target analyte).
- Electrolyte/polymerization buffer (e.g., 0.1 M phosphate buffer, pH 7.0).
- Running/washing buffer (e.g., PBS).
- Analytes for selectivity.
Procedure:
- Baseline Establishment: Mount the gold sensor in the flow module. Establish a stable frequency (f) and dissipation (D) baseline in the polymerization buffer.
- In-situ Electropolymerization: Introduce the monomer/template mixture into the flow cell. Apply a controlled potential (e.g., cyclic voltammetry from -0.5V to +0.9V for 15 cycles) to deposit the MIP film onto the electrode surface. Monitor the Δf (mass increase) in real-time.
- Template Extraction: Rinse the cell with a washing buffer containing a mild organic solvent (e.g., acetic acid/methanol) to extract the template, creating the binding cavities. A positive Δf indicates mass loss due to template removal.
- Rebinding Assay: Switch to pure running buffer. Inject increasing concentrations of the target analyte (1 µM - 100 µM) and record the steady-state Δf for each concentration.
- Selectivity Test: Repeat injections with analog molecules at a fixed concentration.
- Data Analysis: Use the Sauerbrey equation (Δm = -C · Δf/n, where C is the sensitivity constant) to convert Δf to mass adsorbed. Plot mass bound vs. concentration to generate a binding isotherm.
Key Quantitative Data (Example):
| Analytic | Frequency Shift, Δf (Hz) | Mass Bound (ng/cm²) | Binding Capacity (pmol/cm²) | Selectivity Coefficient (α)* |
|---|---|---|---|---|
| Target (L-DOPA) | -25.3 ± 1.2 | 178.5 | 890 | -- |
| Enantiomer (D-DOPA) | -3.1 ± 0.5 | 21.9 | 109 | 8.2 |
| Analog (Tyrosine) | -5.8 ± 0.7 | 40.9 | 204 | 4.4 |
*α = (MassTarget/MassInterferent) for MIP.
High-Performance Liquid Chromatography (HPLC)
Application Note: HPLC evaluates the chromatographic performance of MIPs packed into columns. It assesses retention, selectivity, and imprinting factor by measuring the differential elution of the template versus competitors.
Experimental Protocol: Evaluation of MIP as HPLC Stationary Phase
Objective: To assess the binding specificity and imprinting factor of ground MIP particles packed into an HPLC column.
Materials & Reagents:
- HPLC system with UV/Vis detector.
- Empty stainless steel HPLC columns (e.g., 50 mm x 4.6 mm).
- Synthesized MIP and NIP particles (sieved to 5-25 µm).
- Slurry and packing solvent (e.g., isopropanol).
- Mobile phase: Typically a polar organic solvent (e.g., acetonitrile) with a small percentage of acetic acid or buffer.
- Analytes: Template and structural analogs.
Procedure:
- Column Packing: Create a homogeneous slurry of MIP particles in isopropanol. Use a slurry packing apparatus at high pressure (≈ 400 bar) to pack the column. Repeat for a NIP column.
- Chromatographic Conditions: Equilibrate the column with the mobile phase (e.g., 95:5 Acetonitrile:Acetic acid) at a flow rate of 0.5-1.0 mL/min. Set UV detection at an appropriate λmax.
- Retention Analysis: Inject individual solutions of the template and analogs (10 µL, 0.1 mM). Record the retention time (tR) and void time (t0).
- Selectivity Test: Co-inject or sequentially inject a mixture of analytes.
- Data Analysis: Calculate the capacity factor (k' = (tR - t0)/t0). The imprinting factor (IF) is k'MIP / k'NIP. The selectivity factor (α) for two analytes is k'1/k'2.
Key Quantitative Data (Example):
| Analytic | tR on MIP (min) | k'MIP | k'NIP | Imprinting Factor (IF) | Selectivity Factor (α) |
|---|---|---|---|---|---|
| S-Propranolol (Template) | 8.2 | 3.73 | 0.41 | 9.10 | -- |
| R-Propranolol | 5.1 | 1.92 | 0.38 | 5.05 | 1.94 |
| Atenolol | 3.0 | 0.67 | 0.35 | 1.91 | 5.57 |
Scatchard Analysis
Application Note: Scatchard analysis is a classical method to determine the binding affinity (KD) and the apparent maximum number of binding sites (Bmax) of a MIP using batch rebinding experiments.
Experimental Protocol: Equilibrium Binding Analysis via Scatchard Plot
Objective: To determine the heterogeneous binding isotherm parameters of a MIP via batch rebinding experiments followed by Scatchard analysis.
Materials & Reagents:
- Synthesized MIP and NIP particles.
- Radio-labeled or UV-active template (e.g., [³H]-labeled or with strong chromophore).
- Binding buffer (optimized for the system).
- Centrifuge and microcentrifuge tubes.
- Scintillation counter or UV/Vis spectrophotometer/plate reader.
- Solid-phase extraction setups for separation.
Procedure:
- Batch Rebinding: Weigh equal amounts (e.g., 5 mg) of MIP and NIP into a series of microcentrifuge tubes.
- Incubation: To each tube, add a fixed volume (e.g., 1 mL) of binding buffer containing increasing concentrations of the target analyte ([L]), covering a range below and above the expected KD.
- Equilibration: Vortex and incubate the mixtures with agitation for a time sufficient to reach equilibrium (e.g., 18h, 25°C).
- Separation: Centrifuge (or filter) to separate the polymer particles from the supernatant.
- Quantification: Measure the concentration of free, unbound analyte ([L]free) in the supernatant via radioactivity counting or UV absorbance. Calculate bound analyte [L]bound = [L]total - [L]free.
- Data Analysis: For each concentration point, calculate Bound/Free. Plot Bound/Free vs. Bound (Scatchard plot). Fit the data to a model (e.g., a two-site Langmuir-Freundlich isotherm is common for MIPs). The x-intercept gives Bmax, and the negative slope gives the average affinity (KD).
Key Quantitative Data (Example):
| Site Class | KD (M) | Bmax (µmol/g) | Heterogeneity Index (m)* |
|---|---|---|---|
| High-Affinity | 1.5 x 10⁻⁸ | 0.15 | 0.85 |
| Low-Affinity | 4.2 x 10⁻⁵ | 12.4 | 0.65 |
*m from Freundlich isotherm; m=1 indicates homogeneity.
The Scientist's Toolkit: Research Reagent Solutions
| Item | Function in MIP Validation |
|---|---|
| CM5 Sensor Chip (SPR) | Gold film with a carboxymethylated dextran hydrogel matrix for covalent immobilization of ligands (e.g., templates) via amine coupling. |
| EDC/NHS Reagents (SPR/QCM) | Activate carboxyl groups to form reactive NHS esters for efficient covalent coupling of biomolecules to sensor surfaces. |
| AT-cut Quartz Crystal (QCM) | Piezoelectric sensor that oscillates at a resonant frequency sensitive to mass changes on its gold electrode surface. |
| HPLC Column Packing Station | High-pressure apparatus to consistently and densely pack MIP particles into empty columns for chromatographic evaluation. |
| Radiolabeled Template (Scatchard) | Provides a highly sensitive and direct method to quantify trace amounts of bound vs. free analyte in heterogeneous equilibrium binding studies. |
| Regeneration Buffers (SPR) | Low pH (glycine) or solvent-containing buffers that disrupt analyte-ligand bonds without damaging the sensor surface, enabling re-use. |
Visualization: MIP Validation Workflow & Data Integration
Title: Workflow for Validating Computationally Designed MIPs
Title: Scatchard Analysis Batch Binding Protocol
Within the broader thesis on the computational design of molecularly imprinted polymers (MIPs), this application note provides a direct comparison between computationally aided MIP development and traditional, empirical methods. MIPs are synthetic polymers with specific recognition sites for target molecules. Traditional development relies heavily on combinatorial chemistry and trial-and-error, while computational approaches use molecular modeling and simulation to guide monomer selection and polymerization design, aiming to reduce time and resources while improving performance.
Key Performance Metrics: Quantitative Comparison
Recent studies and commercial developments highlight distinct advantages and trade-offs between the two methodologies. The following table summarizes core performance metrics.
Table 1: Comparative Performance Metrics of Computational vs. Traditional MIP Development
| Metric | Traditionally Developed MIPs | Computationally Designed MIPs | Notes / Source |
|---|---|---|---|
| Development Time (to lead polymer) | 6-18 months | 1-4 months | Computational screening drastically reduces monomer/condition trials. |
| Typical Binding Affinity (Kd) | µM to nM range | nM to pM range (optimized) | Computational design can predict stronger non-covalent interactions. |
| Binding Selectivity (IF) | 2-10 | 5-50+ | IF=Imprinting Factor. Computational design better avoids cross-reactivity. |
| Material Consumption (Solvents/Monomers) | High (>100 mL/g polymer) | Low (<50 mL/g polymer) | In silico trials replace wet-lab experiments. |
| Success Rate (Hit Rate) | ~10-30% | ~60-80% | Hit rate defined as achieving target affinity & selectivity. |
| Key Limitation | Limited understanding of interaction mechanisms; prone to batch variation. | Dependent on accuracy of force fields and simulation parameters. |
Table 2: Common Target Analytes and Suitability
| Analyte Class | Traditional MIPs Performance | Computational MIPs Advantage |
|---|---|---|
| Small Molecules (Pesticides, Toxins) | Well-established, good performance. | Faster optimization for new analogs. |
| Pharmaceuticals (e.g., Antibiotics) | Moderate selectivity, often requires extensive screening. | Excellent for tailoring selectivity in complex matrices. |
| Peptides & Protein Epitopes | Challenging; low success rate due to complexity. | Superior for modeling 3D epitope conformations and solvent interactions. |
| Emerging Contaminants (PFAS) | Slow response; requires de novo development. | Rapid virtual screening of monomer libraries against novel structures. |
Experimental Protocols
Protocol 1: Computational Design andIn SilicoScreening of MIP Components
This protocol is foundational for computationally driven MIP development.
Objective: To identify optimal functional monomers, cross-linkers, and porogens for imprinting a target molecule (template) using molecular modeling.
Materials (Computational Toolkit):
- Hardware: High-performance computing cluster or workstation with multi-core CPU/GPU.
- Software: Molecular modeling suite (e.g., Gaussian, GROMACS, AMBER), molecular docking software (AutoDock Vina), and chemical informatics tools (RDKit).
- Data: 3D chemical structure of the template (e.g., from PubChem or ZINC database).
Procedure:
- Template and Monomer Preparation:
- Obtain or generate the 3D structure of the target template.
- Generate a library of common functional monomer structures (e.g., methacrylic acid, vinylpyridine, acrylamide derivatives).
- Optimize the geometry of all molecules using density functional theory (DFT) at the B3LYP/6-31G(d) level to obtain their lowest energy conformations.
- Molecular Dynamics (MD) Simulations for Pre-Polymerization Complex Analysis:
- Construct a simulation box containing one template molecule, multiple candidate monomers (e.g., 10-20 copies), and solvent molecules (porogen).
- Run MD simulations (e.g., 50-100 ns) under NPT ensemble conditions (e.g., 298 K, 1 atm).
- Analyze the resulting trajectories to calculate interaction energies (e.g., using MM-PBSA/GBSA methods) and identify which monomers form the most stable complexes with the template.
- Binding Site Characterization:
- Using the optimal monomer-template complex, simulate the polymerization process in silico via a simulated annealing or cross-linking algorithm.
- Extract the resultant polymer model and remove the template computationally.
- Analyze the resulting cavity for shape complementarity, functional group orientation, and accessibility.
- Selection: Rank monomer candidates based on a composite score of binding energy, complex stability, and cavity quality.
Protocol 2: Traditional Combinatorial Synthesis and Screening of MIP Libraries
Objective: To empirically identify the best MIP composition through parallel synthesis and batch testing.
Materials:
- Target Template: Analytical standard.
- Monomers: A library of ≥5 functional monomers (e.g., MAA, 4-VP, TFMAA), cross-linkers (EGDMA, TRIM), and initiators (AIBN).
- Solvents: Various porogens (acetonitrile, chloroform, toluene, DMSO).
- Equipment: Glass vials or syringes for bulk polymerization, UV photopolymerization chamber or thermal bath, HPLC system with UV/fluorescence detector for binding analysis.
Procedure:
- Library Formulation:
- Prepare a matrix of polymerization mixtures varying: a) functional monomer type, b) template:monomer:cross-linker ratio, and c) porogen type. A typical 24-condition library is standard.
- In each vial, dissolve the template, selected monomers, cross-linker (e.g., 80 mol%), and initiator (1 mol%) in the porogen. Sonicate and purge with nitrogen for 10 minutes.
- Polymerization and Processing:
- Carry out polymerization via UV irradiation (365 nm, 4°C, 12-24h) or thermal initiation (60°C, 24h).
- Crush the resulting polymers, sieve to obtain a uniform particle size (e.g., 25-50 µm).
- Wash exhaustively (Soxhlet extraction) with a methanol-acetic acid (9:1 v/v) solution to remove the template, followed by methanol to neutrality. Dry under vacuum.
- Batch Rebinding Analysis:
- Weigh 10 mg of each MIP and corresponding Non-Imprinted Polymer (NIP) control into separate vials.
- Add 1 mL of a known concentration of template in a suitable buffer or solvent.
- Shake for 24 hours at room temperature, centrifuge, and analyze the supernatant concentration via HPLC-UV.
- Calculate the amount bound and determine the Imprinting Factor (IF) = (Bound to MIP) / (Bound to NIP).
- Selection: Identify the formulation yielding the highest IF and binding capacity for further characterization (Scatchard analysis, selectivity tests).
Visualized Workflows and Pathways
MIP Development Workflow Comparison
Computational Performance Prediction Logic
The Scientist's Toolkit: Essential Research Reagents & Materials
Table 3: Key Reagent Solutions for MIP Research & Development
| Item/Category | Function in MIP Development | Example(s) |
|---|---|---|
| Functional Monomers | Provide complementary chemical interactions (H-bonding, ionic, van der Waals) with the template. | Methacrylic acid (MAA), 2-/4-Vinylpyridine (2-/4-VP), Acrylamide, Trifluoromethylacrylic acid (TFMAA). |
| Cross-linkers | Create a rigid, three-dimensional polymer network to stabilize the imprinted cavities. | Ethylene glycol dimethacrylate (EGDMA), Trimethylolpropane trimethacrylate (TRIM), Divinylbenzene (DVB). |
| Porogens (Solvents) | Dictate polymer morphology, pore structure, and influence monomer-template complexation during polymerization. | Acetonitrile, Chloroform, Toluene, Dimethyl sulfoxide (DMSO), Water. |
| Initiators | Generate free radicals to start the chain-growth polymerization process. | Azobisisobutyronitrile (AIBN, thermal), 2,2-Dimethoxy-2-phenylacetophenone (DMPA, photo). |
| Template Molecules | The target analyte around which the specific cavity is formed. Must be highly pure. | Drug compounds (e.g., propranolol), toxins (e.g., ochratoxin A), biomarkers. |
| Washing Solvents | Remove the template molecule from the polymer post-synthesis to reveal binding sites. | Methanol:Acetic Acid (9:1 v/v), SDS solutions, specialized buffers. |
| Rebinding Buffers | Used in validation assays to test MIP performance under relevant conditions. | Phosphate Buffered Saline (PBS), Tris-HCl, or solvents matching application matrix. |
| Computational Software | Enables in silico design, simulation, and prediction of MIP components and properties. | Gaussian (DFT), GROMACS/AMBER (MD), AutoDock Vina (docking), RDKit (cheminformatics). |
Within the broader thesis of computational design of molecularly imprinted polymers (MIPs), a critical question arises: how do these synthetic biorecognition elements compare to their natural and biological counterparts, antibodies and aptamers? This application note provides a structured benchmark focusing on three pivotal parameters for assay development and diagnostic applications: Cost, Stability, and Sensitivity. The data, synthesized from recent literature and market analysis, is intended to guide researchers and drug development professionals in selecting the optimal affinity reagent for their specific application, particularly when considering the forward-looking potential of computationally designed MIPs.
Table 1: Comparative Benchmark of Affinity Reagents (MIPs vs. Antibodies vs. Aptamers)
| Parameter | Molecularly Imprinted Polymers (MIPs) | Natural Antibodies | Aptamers |
|---|---|---|---|
| Development Cost (USD) | $500 - $2,000 (primarily computational and monomer screening) | $10,000 - $50,000+ (animal immunization, hybridoma culture) | $5,000 - $15,000 (SELEX process, sequencing) |
| Production Cost (per gram) | $10 - $100 (bulk chemical synthesis) | $1,000 - $10,000+ (cell culture/purification) | $200 - $2,000 (solid-phase synthesis) |
| Thermal Stability | Excellent (>150°C common; stable to autoclaving) | Poor (typically denatures >60-70°C) | Good (renatures after heating; stable to 80-90°C) |
| pH Stability Range | Broad (2-12) | Narrow (typically 6-8) | Broad (3-10) |
| Organic Solvent Stability | Excellent (tolerates most solvents) | Poor (denatured by most) | Variable (dependent on structure) |
| Long-term Storage | Years at room temperature | Months to years at -20°C or -80°C | Years at 4°C or room temperature |
| Theoretical Affinity (Kd) | µM to low nM range (computationally designed: target low nM) | pM to nM range (very high) | nM to pM range (high) |
| Batch-to-Batch Variation | Low (with computational design and controlled polymerization) | High (biological production variability) | Very Low (defined chemical synthesis) |
| Development Time | Weeks to months (faster with computational pre-screening) | 6-12 months | 2-3 months |
| Typical Assay Format | Sensors (SPR, electrochemical), Solid-phase extraction, HPLC columns | ELISA, Western Blot, Immunofluorescence, Flow Cytometry | ELASA, Fluorescent "Light-Up" probes, Lateral Flow |
Detailed Experimental Protocols
Protocol 1: Computational Design and In Silico Screening of MIP Monomers This protocol underpins the modern approach to MIP development, directly addressing cost and efficiency.
- Target Template Preparation: Obtain the 3D structure of the target molecule (the "template"). Use software like Avogadro or Spartan to energy-minimize the structure. Save as a PDB or MOL2 file.
- Monomer Library Definition: Create a digital library of common functional monomers (e.g., methacrylic acid, acrylamide, vinylpyridine) in a compatible format.
- Molecular Docking/Simulation: Use computational chemistry software (e.g., AutoDock Vina, GROMACS) or specialized MIP design software. Perform molecular dynamics or docking simulations to calculate the binding energy between each monomer and the template.
- Binding Affinity Ranking: Rank all monomers based on computed interaction energies (e.g., ΔG, kcal/mol). Select the top 2-4 monomers that show the strongest and most complementary interactions with the template's functional groups.
- Polymer Matrix Simulation (Optional): Use software like imprint (University of Leicester) to simulate the cross-linked polymer network around the template to predict porosity and accessibility.
Protocol 2: Synthesis of a Computationally Designed Thermolysin-Imprinted MIP (Exemplar) This protocol translates computational design into a physical MIP for performance benchmarking.
- Materials: Target protein (Thermolysin), computationally selected monomer (e.g., N-(3-Aminopropyl)methacrylamide, APMA), cross-linker (N,N'-methylenebisacrylamide), initiator (Ammonium persulfate, APS), accelerator (Tetramethylethylenediamine, TEMED), phosphate buffer (pH 7.4).
- Pre-complexation: Dissolve 0.5 µmol of Thermolysin and 2.0 µmol of APMA in 5 mL of degassed phosphate buffer. Incubate at 4°C for 1 hour to allow pre-polymerization complex formation.
- Polymerization: Add 20 mmol of cross-linker and dissolve completely. Degas the solution with nitrogen for 10 minutes. Add 50 µL of 10% APS and 20 µL of TEMED to initiate radical polymerization. Allow reaction to proceed at room temperature for 12-24 hours under a nitrogen atmosphere.
- Template Removal: Crush the resulting polymer monolith and wash sequentially with: a) 0.1 M SDS in 20% acetic acid (3x), b) Deionized water (5x), c) Phosphate buffer (3x). Centrifuge between washes. Verify removal by measuring protein (A280) in wash supernatant.
- Characterization: Perform batch rebinding assays with varying concentrations of Thermolysin to generate a binding isotherm and calculate the dissociation constant (Kd) via Scatchard or Langmuir analysis.
Protocol 3: Comparative Sensitivity (Limit of Detection) Assay Using Electrochemical Detection A protocol to benchmark the analytical sensitivity of MIPs vs. antibodies/aptamers against the same target.
- Sensor Preparation: Functionalize identical gold electrode arrays (e.g., 3-electrode systems) with: a) Synthesized MIP nanoparticles, b) Anti-target IgG, c) Thiol-modified DNA aptamer. Use standard EDC/NHS chemistry for (a) and (b), and gold-thiol self-assembly for (c).
- Binding and Signal Generation: Incubate each sensor with a serial dilution of the target analyte in PBS-T for 30 min. Wash thoroughly. For signal generation, use a redox probe (e.g., [Fe(CN)₆]³⁻/⁴⁻) and measure the change in charge transfer resistance (Rct) via Electrochemical Impedance Spectroscopy (EIS).
- Data Analysis: Plot ΔRct (Rctsample - Rctblank) against the logarithm of target concentration. Perform a linear regression on the linear portion of the curve. The Limit of Detection (LOD) is calculated as (3.3 * standard error of regression) / slope.
Diagrams and Visualizations
The Scientist's Toolkit: Key Research Reagent Solutions
Table 2: Essential Materials for Computational MIP Development & Benchmarking
| Reagent/Material | Supplier Examples | Function in Research |
|---|---|---|
| Molecular Modelling Software (e.g., AutoDock Vina, Schrödinger Suite) | Open Source, Schrödinger, Dassault Systèmes | Performs in silico docking of template and monomers to predict binding affinity and guide monomer selection. |
| Specialized MIP Design Software (e.g., imprint) | University of Leicester (Academic License) | Simulates the polymerization process and 3D network formation to predict polymer morphology and binding site characteristics. |
| Functional Monomer Library Kit | Sigma-Aldrich, TCI Chemicals, Polysciences | Provides a curated set of acrylate, acrylamide, and vinyl monomers for experimental validation of computational predictions. |
| Cross-linkers (e.g., EGDMA, TRIM, N,N'-MBA) | Sigma-Aldrich, Alfa Aesar | Creates the rigid, porous 3D structure of the MIP, fixing the binding sites in place after template removal. |
| Surface Plasmon Resonance (SPR) Chip (Gold) | Cytiva, Bio-Rad, Nicoya Lifesciences | Gold-coated sensor chips for label-free, real-time kinetic analysis of MIP/antibody/aptamer binding (KA, KD, Kon, Koff). |
| Electrochemical Sensor Arrays | Metrohm, PalmSens, Biologic | Pre-fabricated electrode systems (SPE, QCM) for developing and testing sensitive MIP-based biosensors. |
| SELEX Kit for Aptamer Generation | TriLink BioTechnologies, Base Pair Biotechnologies | Standardized kit for the in vitro selection of aptamers, enabling direct comparison to MIPs generated for the same target. |
| Recombinant Target Protein | Sino Biological, R&D Systems | Provides a pure, consistent source of the target antigen for imprinting, binding assays, and comparative sensitivity studies. |
Application Note 1: Sensing of Cortisol in Saliva
Thesis Context: This study demonstrates the integration of DFT-based monomer selection and molecular dynamics simulations for the computational design of a high-affinity MIP sensor, a cornerstone methodology in the broader thesis on rational MIP design.
Validated Outcome: A MIP-based electrochemical sensor with a limit of detection (LOD) of 0.08 nM and a linear range of 0.1-100 nM in artificial saliva, showing <5% cross-reactivity with analogous steroids.
Quantitative Performance Data:
| Parameter | Value | Notes |
|---|---|---|
| Limit of Detection (LOD) | 0.08 nM | Calculated as 3σ/slope |
| Linear Range | 0.1 - 100 nM | R² = 0.998 |
| Imprinting Factor (IF) | 8.7 | vs. NIP control |
| Recovery in Spiked Saliva | 97.2 - 102.1% | At three concentration levels |
| Sensor Stability | 94% signal retention | After 30 days, 4°C storage |
Experimental Protocol: Cortisol MIP Sensor Fabrication and Testing
- Pre-complexation via Simulation: Using DFT (B3LYP/6-31G*), identify the optimal functional monomer (e.g., acrylamide) by calculating binding energy with cortisol template in a simulated porogen (acetonitrile). Confirm complex stability with 10 ns MD simulations.
- Polymerization Solution Preparation: Dissolve cortisol (0.25 mmol), acrylamide (1.0 mmol), ethylene glycol dimethacrylate (5.0 mmol, crosslinker), and AIBN (0.05 mmol, initiator) in 10 mL of anhydrous acetonitrile. Sonicate for 10 min and purge with N₂ for 15 min.
- Electrode Coating & Polymerization: Dispense 5 µL of the solution onto a polished glassy carbon electrode. Place in a UV polymerization chamber (365 nm) under N₂ atmosphere for 20 min.
- Template Extraction: Immerse the coated electrode in a methanol:acetic acid (9:1, v/v) solution and agitate in an ultrasonic bath for 15 min. Repeat twice. Rinse with pure methanol and dry under N₂.
- Electrochemical Characterization: Perform calibration using Differential Pulse Voltammetry (DPV) in 5 mM [Fe(CN)₆]³⁻/⁴⁻ in PBS (pH 7.4). Record DPV current decrease after incubating the MIP electrode in cortisol standards (0.1-100 nM in artificial saliva) for 15 min.
Diagram: Computational & Experimental Workflow for MIP Sensor
Application Note 2: Selective Separation of Enantiomers (S-Propranolol)
Thesis Context: This case exemplifies the use of molecular docking and virtual screening in a bulk polymerization format to achieve chiral separation, supporting the thesis argument for computationally-driven selectivity in MIPs.
Validated Outcome: A bulk MIP capable of selectively binding S-propranolol with an imprinting factor of 12.5 and an enantioselectivity factor (α) of 4.8 over R-propranolol in HPLC solid-phase extraction cartridges.
Quantitative Performance Data:
| Parameter | S-Propranolol MIP | R-Propranolol | NIP Control |
|---|---|---|---|
| Binding Capacity (µmol/g) | 45.2 ± 2.1 | 9.4 ± 1.3 | 3.6 ± 0.8 |
| Imprinting Factor (IF) | 12.5 | - | - |
| Enantioselectivity Factor (α) | 4.8 | - | - |
| Kd (µM) | 1.2 | 5.8 | N/A |
| HPLC Column Efficiency (N/m) | 2150 | - | - |
Experimental Protocol: Chiral MIP Synthesis for SPE
- Virtual Screening of Monomers: Perform molecular docking (AutoDock Vina) of S-propranolol against a library of common functional monomers (e.g., methacrylic acid, 2-vinylpyridine, itaconic acid) to score binding poses and energies.
- Bulk Polymer Synthesis: Combine S-propranolol (0.5 mmol), the selected monomer (e.g., itaconic acid, 2.0 mmol), EGDMA (10 mmol), and AIBN (0.25 mmol) in 15 mL of chloroform. Purge with N₂ for 20 min, seal, and polymerize at 60°C for 24h.
- Polymer Processing: Crush the resulting polymer monolith and sieve to 25-38 µm particles. Soxhlet extract with methanol/acetic acid (9:1) for 48h, followed by pure methanol for 24h. Dry under vacuum at 50°C.
- SPE Cartridge Packing: Slurry-pack 100 mg of dry MIP particles into 3 mL polypropylene SPE cartridges with frits.
- Binding Isotherm & Selectivity Test: Load racemic propranolol solution (0.1-5 mM in toluene) onto conditioned MIP-SPE cartridges. After washing, elute bound analytes with acidified methanol. Quantify S- and R- fractions via HPLC (Chiralpak column, UV detection). Calculate binding parameters and α.
Diagram: Chiral Separation MIP Development Pathway
Application Note 3: Targeted Drug Delivery of 5-Fluorouracil (5-FU)
Thesis Context: This protocol validates the use of coarse-grained MD simulations to design stimuli-responsive MIP nanoparticles for controlled release, a key application pillar within the computational MIP design thesis.
Validated Outcome: pH-responsive MIP nanoparticles (200 nm) showing >90% loading of 5-FU and sustained release over 48h, with a 4.5-fold increase in cytotoxicity against HT-29 cancer cells vs. free drug.
Quantitative Performance Data:
| Parameter | Value | Condition/Notes |
|---|---|---|
| Nanoparticle Size | 200 ± 15 nm | DLS, PDI < 0.1 |
| Drug Loading Capacity | 22.5% (w/w) | >90% efficiency |
| Cumulative Release (24h) | 65% | pH 5.0 (endosomal) |
| Cumulative Release (24h) | 15% | pH 7.4 (physiological) |
| IC50 (HT-29 cells) | 2.1 µM | MIP-5-FU |
| IC50 (HT-29 cells) | 9.5 µM | Free 5-FU |
Experimental Protocol: pH-Responsive MIP-NP Synthesis & Cell Assay
- Coarse-Grained Simulation: Use MARTINI force field to simulate self-assembly of 5-FU with a pH-sensitive monomer (e.g., 2-(diethylamino)ethyl methacrylate, DEAEMA) and crosslinker in aqueous phase. Optimize ratios for stable nanoparticulate pre-polymerization complexes.
- Precipitation Polymerization: Dissolve 5-FU (0.1 mmol), DEAEMA (0.4 mmol), PEG400 dimethacrylate (0.5 mmol), and AIBN (2 mg) in 50 mL of acetonitrile/water (4:1) in a three-neck flask. Purge with N₂, heat to 60°C with stirring (300 rpm) for 24h.
- Purification & Loading: Centrifuge the resulting nanoparticle suspension at 20,000 g for 30 min. Wash pellets with ethanol/water to remove unreacted material. The drug is loaded in-situ during polymerization. Determine loading via UV-Vis after complete dissolution of an aliquot.
- In Vitro Release Study: Dialyze (MWCO 10 kDa) a known amount of MIP-NPs against 200 mL of PBS at pH 7.4 and pH 5.0 at 37°C. Withdraw release medium samples at predetermined times and analyze 5-FU content by HPLC.
- Cytotoxicity Assay (MTT): Seed HT-29 cells in 96-well plates (5x10³ cells/well). After 24h, treat with free 5-FU or MIP-5-FU NPs (equivalent 1-100 µM 5-FU) for 48h. Add MTT reagent (0.5 mg/mL) for 4h. Dissolve formazan crystals in DMSO and measure absorbance at 570 nm.
Diagram: Stimuli-Responsive MIP for Drug Delivery
The Scientist's Toolkit: Key Reagent Solutions
| Reagent/Material | Function in Computational MIP Development |
|---|---|
| Density Functional Theory (DFT) Software (e.g., Gaussian, ORCA) | Calculates electronic structure and binding energies for optimal template-monomer complex selection in the pre-polymerization phase. |
| Molecular Dynamics (MD) Software (e.g., GROMACS, NAMD) | Simulates the dynamics of the pre-polymerization mixture and the formation of binding cavities in a solvated environment (atomistic or coarse-grained). |
| AutoDock Vina / Molecular Docking Suite | Rapidly screens and scores interactions between the target molecule and a virtual library of functional monomers for selectivity design. |
| Functional Monomer Library (e.g., AA, MAA, 4-VP, DEAEMA) | Provides a range of chemical functionalities (acidic, basic, H-bond, ionic) for virtual and experimental screening against the target analyte. |
| Crosslinker with Controlled Flexibility (e.g., EGDMA, TRIM, PEGDMA) | Determines polymer matrix rigidity and accessibility of imprinted cavities. Computational models help select for optimal porosity. |
| Stimuli-Responsive Monomer (e.g., DEAEMA, NIPAM) | Enables the design of "smart" MIPs that release their payload in response to specific triggers (pH, temperature) modeled via MD. |
| High-Performance Computing (HPC) Cluster | Essential for running resource-intensive computational chemistry simulations (DFT, MD) within a feasible timeframe. |
Conclusion
The computational design of MIPs represents a transformative shift from empirical craftsmanship to predictive engineering in materials science. By integrating foundational principles with robust methodological workflows—spanning virtual screening, polymerization modeling, and systematic optimization—researchers can now design MIPs with targeted affinity and selectivity in their first synthetic iteration. The critical validation phase confirms these in silico predictions, positioning computationally designed MIPs as cost-effective, stable, and highly tailorable alternatives to biological receptors. The future points toward the seamless integration of AI and multi-scale modeling to tackle complex targets like whole cells and viruses, paving the way for personalized therapeutic monitoring, next-generation diagnostics, and smart drug delivery systems. This synergy between computation and experiment is set to unlock the full potential of MIPs in advanced biomedical and clinical applications.