Amorphous vs Crystalline Polymers: Structure, Properties, and Advanced Applications in Drug Delivery
This article provides a comprehensive analysis of amorphous and crystalline polymer structures, tailored for researchers, scientists, and drug development professionals.
Amorphous vs Crystalline Polymers: Structure, Properties, and Advanced Applications in Drug Delivery
Abstract
This article provides a comprehensive analysis of amorphous and crystalline polymer structures, tailored for researchers, scientists, and drug development professionals. It explores the fundamental morphological differences, from molecular chain arrangement to thermal transitions like glass transition (Tg) and melting point (Tm). The scope extends to advanced methodological applications, particularly in controlled drug delivery systems, covering diffusion-controlled, solvent-activated, and biodegradable platforms. Practical guidance on material selection, processing challenges, and optimization strategies is included, alongside a rigorous comparative analysis of mechanical, thermal, and chemical properties. The content synthesizes these aspects to empower informed decision-making for biomedical and clinical research applications, highlighting future directions in intelligent polymer-based therapeutics.
The Molecular Blueprint: Understanding Polymer Morphology and Core Principles
Defining Amorphous and Crystalline Polymer Structures
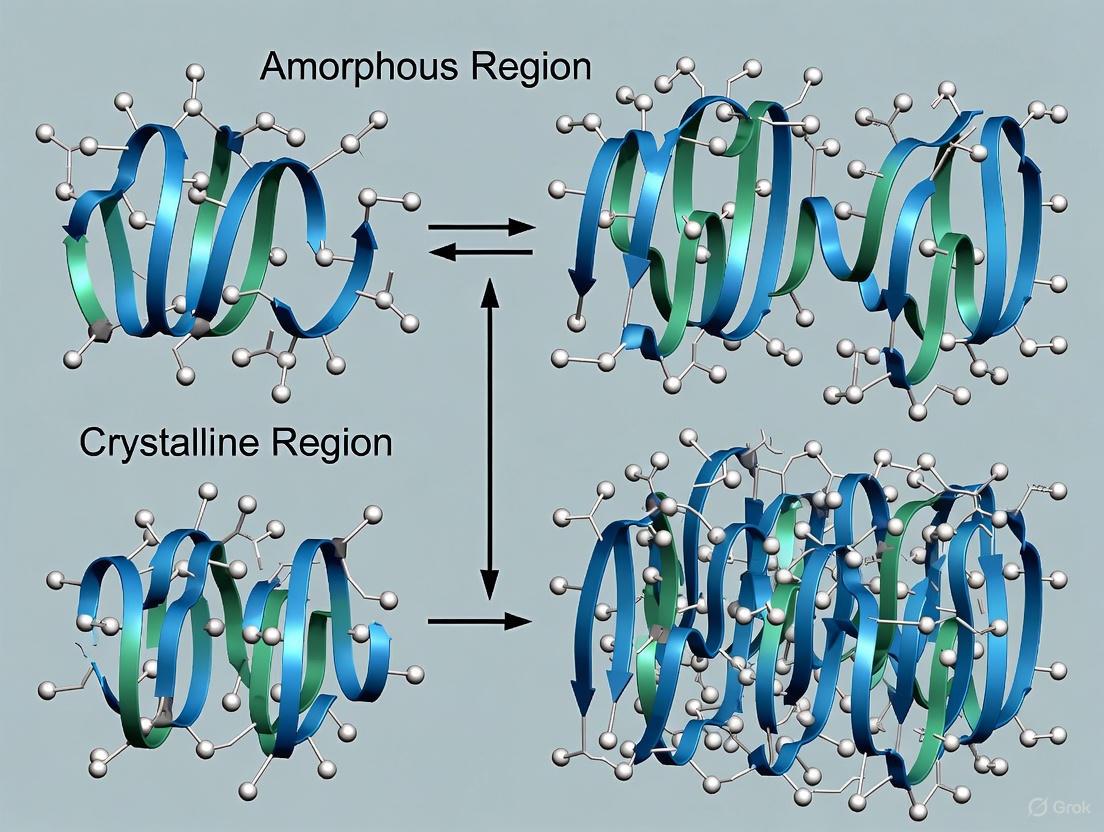
Polymer morphology, which describes the arrangement and state of order of polymer chains, is a fundamental aspect of materials science that directly determines the physical and chemical properties of polymeric materials. Unlike small-molecule compounds that exist in three distinct states of matter—solids, liquids, and gases—polymers exhibit more complex behavior due to their high molecular weight, with molecular weights ranging from tens of thousands to several million atomic mass units [1]. This substantial molecular size significantly impacts their unique properties and classification. Polymers are broadly categorized into two morphological types: amorphous and crystalline [1]. Surprisingly, polymeric solids can simultaneously possess both amorphous and crystalline regions, a concept particularly important to polymer science [1]. Understanding this distinction is crucial for researchers and scientists, especially in drug development, where polymer morphology affects drug loading, release kinetics, and biocompatibility.
The arrangement of polymer chains differs fundamentally between amorphous and crystalline structures. In amorphous polymers, atoms are held together in a loose, irregular structure without long-range order, similar to a tangled mass of cooked spaghetti [1] [2]. In contrast, chains in crystalline polymers form orderly stacks of folded chains known as lamellae, which bring long-range order to the material [1] [2]. Most crystalline polymers contain amorphous regions, meaning they are never completely crystalline [1]. Scientists refer to a polymer's "degree of crystallinity" to describe its position along the spectrum from entirely amorphous (0%) to entirely crystalline (100%), with most practical polymers falling somewhere between these extremes [1] [2].
Structural Characteristics and Molecular Order
Amorphous Polymer Structure
Amorphous polymers exhibit a random molecular configuration with no long-range order, characterized by a loose, irregular structure where chains are tangled and intertwined [1] [2]. This disordered arrangement is often visualized as a plate of cooked spaghetti noodles, with chains forming a hopelessly entangled mass without predictable patterns [1]. The distances between atoms in amorphous structures can vary substantially, unlike in crystalline materials where atomic distances are much more consistent [2]. This molecular-level disorder manifests in macroscopic properties such as transparency, gradual softening upon heating, and isotropic behavior [3] [4].
The lack of orderly structure in amorphous polymers arises from chain entanglement, where polymer chains become randomly arrayed throughout the material, making atomic positions quasi-random [1]. In this configuration, chemists describe amorphous solids as having no long-range order, though they may exhibit short-range order at the molecular level [2]. This structural characteristic significantly influences the thermal and mechanical behavior of amorphous polymers, particularly through the glass transition temperature (Tg), below which the material becomes glassy, brittle, and rigid [1].
Crystalline and Semi-Crystalline Polymer Structure
Crystalline polymers display a highly ordered molecular structure where chains are arranged in a regular, repeating pattern [3]. Instead of becoming randomly tangled, the polymer chains form orderly stacks of folded chains known as lamellae [1] [2]. These lamellae bring long-range order to polymers, creating a more orderly arrangement similar to atoms in typical crystals [1]. Interestingly, some lamellae in certain polymers feature small numbers of chains that loop out from the orderly stacks, creating amorphous regions within an otherwise crystalline polymer [1].
Most crystalline polymers are more accurately described as semi-crystalline, containing both crystalline and amorphous regions coexisting within the same material [1] [4]. The crystalline regions provide structural strength and stability, while the amorphous regions contribute flexibility and impact resistance [5]. The proportion of crystalline to amorphous regions—the degree of crystallinity—directly influences the polymer's physical properties, including tensile strength, impact resistance, opacity, and chemical resistance [5] [3]. Chain flexibility plays a crucial role in crystal formation, as chains must be able to flex and bend to arrange themselves into orderly structures [1].
Table 1: Fundamental Structural Differences Between Amorphous and Crystalline Polymers
| Structural Characteristic | Amorphous Polymers | Crystalline Polymers |
|---|---|---|
| Molecular Arrangement | Random, disordered chains [1] | Ordered, repeating patterns [3] |
| Long-Range Order | Absent [1] [2] | Present [1] |
| Chain Organization | Tangled mass (cooked spaghetti) [1] | Folded stacks (lamellae) [1] [2] |
| Degree of Crystallinity | 0% (theoretically) to low [1] | Ranges from medium to high (never 100%) [1] |
| Representative Diagram | A1 | A2 |
Key Property Differences and Material Behavior
The structural differences between amorphous and crystalline polymers manifest in distinct thermal, mechanical, optical, and chemical properties that determine their suitability for specific applications, particularly in pharmaceutical and biomedical contexts.
Thermal Properties
Thermal behavior represents one of the most fundamental distinctions between amorphous and crystalline polymers. Amorphous polymers do not have a true melting point but instead undergo a gradual transition from a glassy to a rubbery state as temperature increases [1] [3]. This transition occurs over a temperature range known as the glass transition temperature (Tg) [1] [2]. Below Tg, amorphous polymers are hard, rigid, and brittle, while above Tg, they become softer and more flexible as the entangled chains gain mobility [1]. In contrast, crystalline polymers have a definite melting point (Tm) at which the orderly arrangement of their long-chain structure transitions to a random, disorganized arrangement [1] [3]. Highly crystalline polymers melt suddenly at a specific temperature rather than softening gradually [1].
Mechanical and Physical Properties
The mechanical behavior of polymers is strongly influenced by their morphology. Crystalline polymers generally exhibit superior mechanical strength, stiffness, and dimensional stability due to their ordered structure and tight molecular packing [3] [4]. These materials typically have higher density and undergo greater shrinkage during cooling as the polymer chains pack more efficiently [3]. However, this ordered structure can make them more brittle and prone to fracture under impact [4]. Amorphous polymers, with their random chain arrangement, tend to be more flexible, less brittle, and more resistant to stress cracking [3]. They demonstrate better impact resistance at room temperature but lose toughness quickly above their glass transition temperature, becoming malleable and prone to elongation [2].
Optical and Chemical Properties
Optical properties differ significantly between amorphous and crystalline polymers. Amorphous polymers, with their random entanglement of chains, tend to allow light to pass through them, resulting in transparent materials [2] [4]. As the percentage crystallinity increases, polymers become progressively less transparent due to light scattering at the boundaries between crystalline and amorphous regions [2]. Chemical resistance is another area of differentiation, with crystalline polymers generally offering excellent chemical resistance due to their tight molecular packing that impedes solvent penetration [3]. Amorphous polymers are typically more susceptible to chemical attack and solvent penetration, though specific polymers may exhibit notable chemical resilience [3] [4].
Table 2: Comparative Properties of Amorphous and Crystalline Polymers
| Property | Amorphous Polymers | Crystalline Polymers |
|---|---|---|
| Thermal Behavior | Glass transition temperature (Tg); softens gradually [1] [3] | Definite melting point (Tm); melts suddenly [1] [3] |
| Mechanical Strength | Lower strength, higher flexibility [3] [4] | Higher strength, stiffness [3] [4] |
| Impact Resistance | Good at room temperature [4] | Poor [4] |
| Optical Clarity | Transparent [2] [4] | Opaque to translucent [2] |
| Chemical Resistance | Moderate to low [3] | Excellent [3] |
| Shrinkage During Cooling | Minimal [3] | Significant [3] |
| Density | Lower [3] | Higher [3] |
| Wear Resistance | Poor [4] | Excellent [4] |
Characterization Techniques and Experimental Protocols
Analyzing polymer crystallinity requires sophisticated characterization techniques that can probe material structure at molecular and atomic levels. These methods are essential for quality control, research and development, and understanding structure-property relationships in pharmaceutical applications.
X-Ray Diffraction (XRD)
X-ray diffraction is a powerful technique for determining the crystalline structure of polymers by measuring the distances between atoms [5]. When X-rays interact with a crystalline polymer, they produce a diffraction pattern that reveals information about the atomic arrangement and degree of crystallinity [5] [6]. The experimental protocol involves placing a polymer sample in the XRD instrument and exposing it to X-ray radiation. The diffraction pattern is then collected and analyzed to identify crystalline phases and determine the percentage crystallinity [5]. XRD can also monitor changes in crystallinity during processing or under strain, providing insights into structure-property relationships [6]. Modern XRD systems like Malvern Panalytical's Aeris and Empyrean offer modular designs that can be adapted for various sample types and analysis requirements [5].
Differential Scanning Calorimetry (DSC)
Differential scanning calorimetry measures heat flow into or out of a polymer sample during controlled heating or cooling, providing information about thermal transitions [2] [6]. The experimental protocol involves placing a small polymer sample (typically 5-10 mg) in a sealed pan alongside an empty reference pan in the DSC instrument [2]. The temperature is increased at a controlled rate (e.g., 10°C per minute), and the heat flow difference between the sample and reference is measured. This allows detection of thermal events such as the glass transition temperature (Tg) in amorphous polymers and melting point (Tm) in crystalline polymers [2] [6]. DSC provides valuable information about a polymer's thermal history, crystallinity, and stability, which is crucial for pharmaceutical processing and drug delivery system design [6].
Dynamic Mechanical Analysis (DMA)
Dynamic mechanical analysis applies oscillatory force to a polymer sample while measuring its response across a temperature range, providing information about viscoelastic behavior [2]. In a typical DMA experiment, a polymer sample of specific dimensions is clamped in the instrument and subjected to a small oscillating deformation while temperature is varied. The instrument measures the complex modulus, including storage modulus (elastic response) and loss modulus (viscous response), revealing the polymer's stiffness and damping characteristics [2]. DMA is particularly sensitive for detecting glass transitions and other secondary relaxations that might be missed by DSC, making it invaluable for understanding polymer behavior in biomedical applications [2].
Additional Characterization Methods
Other important techniques for polymer characterization include tensile testing, which measures force required to pull polymer films until breakage to determine tensile strength and elongation at break [2]; polarized optical microscopy (POM) with hot-stage capability for visualizing crystalline structures and morphology development [7]; scanning electron microscopy (SEM) for examining surface morphology [7]; and atomic force microscopy (AFM) for high-resolution imaging of polymer surfaces [7]. Each technique provides complementary information, and researchers often use multiple methods to fully characterize polymer structure [2] [7].
Table 3: Essential Research Reagents and Equipment for Polymer Characterization
| Reagent/Equipment | Function/Application | Experimental Relevance |
|---|---|---|
| XRD Instrument (e.g., Aeris, Empyrean) [5] | Measures atomic distances and crystallinity [5] | Identifies crystalline phases; quantifies degree of crystallinity [5] [6] |
| Differential Scanning Calorimeter [2] [6] | Measures heat flow during thermal transitions [2] [6] | Determines Tg (amorphous) and Tm (crystalline); analyzes thermal stability [2] [6] |
| Dynamic Mechanical Analyzer [2] | Applies oscillatory force to measure viscoelastic properties [2] | Characterizes stiffness and damping across temperature ranges [2] |
| Tensile Testing Machine [2] | Pulls polymer film to measure mechanical properties [2] | Determines tensile strength and elongation at break [2] |
| Polarized Optical Microscope with hot-stage [7] | Visualizes crystalline structures and morphology [7] | Observes spherulite formation and crystalline development [7] |
| Etching Reagents (e.g., acids, permanganate) [7] | Selectively removes amorphous regions [7] | Enhances contrast for microscopy; reveals lamellar structure [7] |
Applications in Biomedical and Pharmaceutical Fields
The distinct properties of amorphous and crystalline polymers make each suitable for specific biomedical and pharmaceutical applications, particularly in drug delivery, bioimaging, and medical devices.
Drug Delivery Systems
Polymer morphology plays a crucial role in drug delivery system design, influencing drug loading capacity, release kinetics, and degradation behavior. Amorphous polymers often demonstrate higher drug loading capacity due to their more open molecular structure, while the release profile can be modulated by the polymer's glass transition temperature [2]. The random molecular structure of amorphous polymers lacking a sharp melting point allows them to soften gradually as temperature increases, which can be exploited for controlled release applications [1] [3]. Their deformability enables them to bond well with substrates, making them suitable for transdermal patches and adhesive drug delivery systems [2].
Crystalline polymers, with their excellent chemical resistance and tight molecular packing, provide effective barriers that can protect drugs from degradation and control release rates [3]. Their well-defined melting behavior and structural stability make them suitable for implantable devices that require predictable erosion profiles [1] [3]. The balance between crystalline and amorphous regions in semi-crystalline polymers can be tailored to achieve specific drug release profiles, with crystalline regions providing structural integrity and amorphous regions allowing drug diffusion [5].
Bioimaging and Theranostic Applications
Polymer-based nanostructures have emerged as valuable tools for bioimaging, serving as carriers for contrast agents in various imaging modalities including magnetic resonance imaging (MRI), computed tomography (CT), and optical imaging [8] [9]. The versatility of polymer design allows creation of sophisticated bioimaging probes with prolonged plasma half-lives, enhanced stability, reduced toxicity, and improved targeting compared to small molecule agents [8] [9].
Amorphous polymers are particularly useful in designing bioimaging probes due to their flexibility and ability to accommodate various imaging moieties [2] [8]. Their random structure allows incorporation of contrast agents like gadolinium for MRI or fluorescent dyes for optical imaging [8] [9]. Crystalline polymers, with their more ordered structure, provide stability and protection for imaging agents, making them suitable for applications requiring long circulation times or resistance to degradation [3]. The development of polymer-based theranostic agents that combine imaging and therapeutic functions represents a significant advancement in personalized medicine [8].
Medical Devices and Implants
Both amorphous and crystalline polymers find extensive applications in medical devices and implants, with material selection based on required mechanical properties, biocompatibility, and degradation behavior. Crystalline polymers like polyether ether ketone (PEEK) are favored for load-bearing implants due to their high strength, stiffness, and excellent wear resistance [3]. Their chemical inertness makes them suitable for long-term implants, while their predictable melting behavior facilitates processing and sterilization [3].
Amorphous polymers such as polycarbonate (PC) and polymethyl methacrylate (PMMA) are widely used in applications requiring transparency, including optical devices, lenses, and surgical instruments [4]. Their impact resistance and ability to be sterilized make them valuable for medical equipment housings and disposable devices [4]. The glass transition temperature of amorphous polymers must be carefully considered for medical devices that undergo heat sterilization, as temperatures above Tg can cause deformation [2].
Emerging Trends and Research Directions
Polymer science continues to evolve with emerging technologies enabling more precise control and characterization of amorphous and crystalline structures.
Machine learning (ML) approaches are increasingly applied to understand the complex relationships between polymer composition, processing conditions, structure, and properties [10]. ML algorithms can analyze vast datasets to predict polymer crystallinity based on chemical structure and processing parameters, accelerating materials discovery and optimization [10]. These techniques are particularly valuable for designing polymers with tailored crystallinity for specific pharmaceutical applications, such as controlled-release formulations or biodegradable implants [10].
Advanced characterization techniques are providing new insights into polymer morphology at multiple length scales. The combination of multiple analytical methods, including X-ray diffraction, thermal analysis, and electron microscopy, allows researchers to develop comprehensive understanding of structure-property relationships in both amorphous and crystalline polymers [6] [7]. These insights are driving the development of novel polymer systems with hierarchical structures that optimize performance for specific biomedical applications [7].
Sustainable polymer design represents another important research direction, with growing emphasis on developing biodegradable polymers with controlled crystallinity for pharmaceutical and medical applications [6]. Understanding how crystallinity affects degradation rates is crucial for designing implantable devices and drug delivery systems that maintain structural integrity until their function is complete, then safely degrade in the body [6].
The distinction between amorphous and crystalline polymer structures represents a fundamental concept in polymer science with significant implications for pharmaceutical and biomedical applications. Amorphous polymers, with their random molecular arrangement and glass transition behavior, offer advantages including transparency, impact resistance, and gradual softening. Crystalline polymers, characterized by their ordered structure and definite melting points, provide superior strength, chemical resistance, and thermal stability. Most practical polymers exist in a semi-crystalline state with varying degrees of crystallinity that can be tailored to achieve specific performance characteristics.
Characterization techniques such as XRD, DSC, and DMA provide essential tools for analyzing polymer morphology and understanding structure-property relationships. These methods enable researchers to optimize polymer systems for specific drug delivery, bioimaging, and medical device applications. Emerging technologies including machine learning and advanced microscopy techniques continue to enhance our understanding of polymer crystallinity and its influence on material behavior. As polymer science advances, the ability to precisely control amorphous and crystalline structures will continue to drive innovation in pharmaceutical development and biomedical engineering.
In polymer science, the macroscopic properties of a material are fundamentally dictated by its molecular architecture. Unlike small molecules, polymers possess high molecular weights, leading to complex behaviors and interactions between their long chains [1]. These structures are broadly categorized into two distinct morphologies: amorphous and crystalline. Amorphous polymers are characterized by a loose, random arrangement of molecular chains with no long-range order, akin to a pile of cooked spaghetti. In contrast, crystalline polymers feature regions where chains fold into orderly, stacked structures known as lamellae [1]. Most crystalline polymers are, in fact, semi-crystalline, containing both these ordered lamellae and disordered amorphous regions. The proportion of crystalline material is defined by a polymer's degree of crystallinity, which ranges from 0% (entirely amorphous) to 100% (entirely crystalline), with most practical polymers existing between these extremes [1]. This morphological dichotomy governs critical material properties, including mechanical strength, thermal behavior, optical clarity, and chemical resistance.
Structural Fundamentals: Amorphous Architecture
The Role of Chain Entanglement
In amorphous polymers, the molecular chains are arranged in a random, loose structure without any predictable, long-range order. This configuration is a direct result of chain entanglement, where the lengthy polymer chains become hopelessly intertwined [1]. A single polymer chain can be visualized as a piece of spaghetti; when multiple chains are present, they form a wildly random pile of intertwined "polymers" with quasi-random atomic positions. This extensive entanglement is the key structural feature governing the behavior of amorphous materials.
Thermal Transitions: The Glass Transition
Amorphous solids lack a sharp melting point. Instead, they undergo a gradual transition over a range of temperatures known as the glass transition temperature (Tg) [1]. Below the Tg, the entangled amorphous polymer chains are frozen and cannot move, resulting in a hard, rigid, and brittle glassy state. When the temperature rises above the Tg, small portions of the chains gain sufficient mobility to move, leading to a soft and flexible rubbery state [1]. This transition is a defining characteristic of amorphous polymers.
Structural Fundamentals: Crystalline Architecture
Formation of Lamellae Stacks
In crystalline polymers, the molecular chains do not become randomly tangled. Instead, they form orderly stacks of folded chains, known as lamellae [1]. These lamellae introduce long-range order to the polymer, creating a more structured arrangement similar to the orderly atomic packing in typical crystals. The folding allows the long chains to organize into tight, structured zones. Interestingly, not every part of a chain is incorporated into a lamella; some portions may form loops or extend out from the orderly stacks, creating amorphous regions within an otherwise crystalline polymer [1].
The Semi-Crystalline Reality and Inter-Lamellar Connections
Most crystalline polymers are semi-crystalline, meaning they contain a mixture of crystalline lamellae and amorphous regions [11]. On a sub-micron scale, the morphology consists of stacks of crystal lamellae sandwiching intermediate amorphous layers. The polymer chains within these amorphous regions can adopt several configurations, including tight folds, statistical loops, loose chain ends (cilia), and crucially, tie chains and trapped entanglements [11].
- Tie Chains: Polymer chains that extend from one crystalline lamella and connect directly to an adjacent lamella, threading through the amorphous region.
- Trapped Entanglements: Chains that connect to adjacent crystal layers via permanently entangled loops.
These inter-lamellar connections are extremely important for the material's mechanical performance, particularly its fracture toughness and resistance to slow crack growth [11]. In branched polyethylenes, for example, the rejection of bulky branches from the crystal lattice can lead to thinner lamellae but also increase the number of these vital inter-lamellar connections, enhancing fracture toughness [11].
Comparative Analysis: Property Implications
The fundamental structural differences between amorphous and crystalline polymers lead to distinct property profiles, which are summarized in the table below.
Table 1: Key Property Differences Between Amorphous and Crystalline Polymers [1] [3] [4]
| Property | Amorphous Polymers | Crystalline Polymers |
|---|---|---|
| Molecular Structure | Randomly entangled chains; no long-range order [1] | Ordered lamellae stacks of folded chains; long-range order [1] |
| Thermal Behavior | No sharp melting point; softens over a temperature range (characterized by Tg) [1] [3] | Sharp melting point (Tm) due to ordered structure [1] [3] |
| Mechanical Properties | More flexible, better impact resistance, less brittle [4] | Superior mechanical strength, stiffness, and dimensional stability [3] [4] |
| Optical Properties | Often transparent [3] [4] | Typically opaque or translucent [3] |
| Chemical Resistance | More prone to chemical attack and solvent penetration [1] [3] | Excellent chemical resistance due to tight molecular packing [1] [3] |
| Density & Shrinkage | Lower density; minimal shrinkage during cooling [3] | Higher density; greater shrinkage due to crystallization [3] |
Table 2: Examples of Amorphous and Crystalline Polymers and Their Transitions [1]
| Polymer | Type / Tacticity | Glass Transition Temp (Tg) | Melting Point (Tm) |
|---|---|---|---|
| Polypropylene | Atactic (Amorphous) | -17°C (1.4°F) | Does not apply |
| Polystyrene | Atactic (Amorphous) | 100°C (212°F) | Does not apply |
| Polybutadiene | Amorphous | -106°C (-159°F) | Does not apply |
| Poly(methyl methacrylate) | Amorphous | 120°C (248°F) | Does not apply |
| Polypropylene | Isotactic (Crystalline) | Does not apply | 174°C (345°F) |
| Polyethylene | Crystalline | Does not apply | 137°C (279°F) |
| Nylon | Crystalline | Does not apply | 260°C (500°F) |
| Polystyrene | Syndiotactic (Crystalline) | Does not apply | 270°C (518°F) |
Advanced Experimental and Computational Methodologies
Monte Carlo Simulation of Semi-Crystalline Polyethylene
To quantitatively assess the concentration of critical inter-lamellar features like tie chains and trapped entanglements, advanced computational models are employed.
Objective: To simulate the semi-crystalline structure of branched polyethylene and study how short-chain branching affects the concentrations of tie chains and trapped entanglements [11].
Methodology - The Extended Nilsson Model: This method uses an off-lattice Monte Carlo algorithm to generate alternating parallel crystalline and amorphous layers [11].
- System Generation: The model creates a simulation domain representing the polymer, incorporating the entire crystal thickness distribution rather than single values, allowing for a more realistic morphology.
- Chain Walking: A numerical algorithm uses the stored atomic coordinates to perform a random walk, simulating the path of polymer chains through the semi-crystalline structure.
- Parameter Evaluation: The algorithm identifies and quantifies parameters of interest:
- A tie chain is identified when a single chain connects two different crystal lamellae.
- A trapped entanglement is counted when two chains originating in different lamellae are permanently entangled within the amorphous region [11].
- Input Data: The model is calibrated and validated using data from real polyethylene samples characterized by techniques like Size Exclusion Chromatography (SEC) for molar mass and
13CNMR for branch content [11].
Key Findings:
- The presence of short-chain branches (e.g., butyl branches) increases the number of inter-lamellar tie chains and trapped entanglements.
- This increase in connectivity leads to a stronger mechanical network and enhanced fracture toughness, explaining the superior performance of certain branched polyethylenes in applications requiring resistance to slow crack growth [11].
AI-Guided High-Throughput Investigation of Polymer Doping
The electronic properties of conjugated polymers for applications like bioelectronics are highly dependent on their structure and doping efficiency.
Objective: To understand how processing parameters affect the electronic properties of doped conjugated polymers and identify key structural variables for high conductivity [12].
Methodology - The DopeBot System: This approach combines artificial intelligence (AI) with high-throughput experimentation to efficiently explore a vast parameter space.
- AI-Guided Experimentation: An AI algorithm (DopeBot) was tasked with producing a wide range of conductivities using a model polymer (pBTTT) and a dopant (F4TCNQ). The system designed cycles of 32 experiments at a time, varying parameters like solvent and temperature [12].
- Characterization: The results of each batch (e.g., electronic properties, molecular structure) were characterized and fed back to the AI.
- Informed Iteration: The AI used the results to design the subsequent batch of experiments, leading to 224 informed experiments in total [12].
- Causal Analysis: Advanced analytic techniques identified correlations, and quantum chemical calculations were used to establish causality between dopant location and electronic properties [12].
Key Findings:
- Achieving high conductivity (>100 S/cm) requires processing conditions that promote ordered polymer domains.
- Local polymer order and dopant-polymer separation are critical. "Peripheral" counterions located at greater distances (≈1.3–1.8 nm) from the polymer backbone result in highly delocalized polarons and higher carrier mobility compared to intercalated counterions [12].
Periodicity-Aware Deep Learning for Polymer Discovery
The unique periodicity of polymer structures has traditionally challenged machine learning models.
Objective: To develop a deep learning framework that accurately represents the periodic nature of polymers for property prediction and material discovery [13].
Methodology - The PerioGT Framework: This novel framework integrates chemical knowledge-driven periodicity priors into its architecture.
- Pre-training with Contrastive Learning: The model is pre-trained using contrastive learning techniques that emphasize the periodic nature of polymers, building a foundational understanding of how periodicity influences properties [13].
- Fine-Tuning with Periodicity Prompts: In the fine-tuning phase, the model learns periodicity prompts based on the established prior, enhancing its focus on periodic attributes [13].
- Graph Augmentation: An innovative graph augmentation strategy using virtual nodes allows the model to integrate additional conditions and model complex chemical interactions [13].
Key Findings:
- PerioGT demonstrated state-of-the-art performance across 16 different downstream tasks.
- Its real-world applicability was validated through wet-lab experiments, where it successfully identified two novel polymers with potent antimicrobial properties [13].
Research Reagents and Materials Toolkit
Table 3: Essential Research Reagents and Materials for Featured Experiments
| Reagent / Material | Function in Research | Example / Specification |
|---|---|---|
| Poly(ethylene-co-1-hexene) | Model short-chain branched polyethylene for studying the effect of branching on semi-crystalline morphology and mechanical performance [11]. | Single-site metallocene-catalyzed; narrow molar mass distribution; specified butyl branch content (e.g., 1.0, 1.8, 2.7 mol.%) [11]. |
| pBTTT (Polymer) | A model conjugated polymer for investigating the relationship between processing, doping, structure, and electronic charge transport properties [12]. | -- |
| F4TCNQ (Dopant) | A molecular p-type doping agent used to introduce charge carriers into the conjugated polymer matrix, modifying its electronic properties [12]. | -- |
| Monte Carlo Simulation Code | Computational tool for simulating chain behavior in amorphous and semi-crystalline phases and quantifying topological features [11]. | Implements algorithms like the "Nilsson model" for tie chain and trapped entanglement calculation [11]. |
| AI/ML Framework (PerioGT) | A specialized deep learning framework for polymer informatics that incorporates periodicity as a prior knowledge, improving property prediction and material discovery [13]. | Uses graph-based models with contrastive learning and periodicity prompts [13]. |
Structural Visualization of Polymer Morphologies
The following diagram illustrates the key architectural differences between amorphous and semi-crystalline polymers, highlighting the roles of chain entanglement and lamellae formation.
Diagram: Amorphous vs. Semi-Crystalline Polymer Architecture. This graph contrasts the disordered, entangled structure of amorphous polymers with the ordered lamellae stacks of semi-crystalline polymers. It highlights key features such as the glass transition (Tg) in amorphous materials and critical inter-lamellar connections like tie chains and trapped entanglements in semi-crystalline materials that govern mechanical integrity.
The molecular architecture of polymers—specifically, the dichotomy between random chain entanglement in amorphous regions and ordered lamellae stacks in crystalline domains—forms the foundational principle governing material performance. The properties of a polymer, from its mechanical strength and thermal behavior to its chemical resistance, are direct consequences of this nanoscale structure. Modern research leverages sophisticated tools, from Monte Carlo simulations that quantify critical topological features like tie chains, to AI-guided high-throughput experimentation and periodicity-aware deep learning models that accelerate the discovery of polymers with tailored properties. Understanding and controlling this molecular architecture is therefore paramount for the rational design of next-generation polymeric materials for advanced applications in drug development, bioelectronics, and sustainable technology.
In polymer science, the concept of crystallinity represents a fundamental structural parameter that profoundly influences material properties and performance. Unlike small-molecule compounds that exhibit distinct solid, liquid, and gaseous states, polymers demonstrate more complex structural behavior classified along a spectrum from completely amorphous to highly crystalline forms [1]. This spectrum is quantified as the degree of crystallinity, which describes the weight or volume fraction of crystalline material within a polymeric substance, ranging from 0% (entirely amorphous) to 100% (perfectly crystalline), though most practical polymers fall somewhere between these extremes [1]. The arrangement of polymer chains dictates this structural organization: amorphous regions feature randomly entangled and coiled molecular chains lacking long-range order, while crystalline regions exhibit chains folded into orderly stacks known as lamellae with predictable, repeating patterns [1].
The crystallinity spectrum provides a crucial framework for understanding polymer behavior, particularly within materials research and drug development where structural characteristics directly influence mechanical properties, chemical stability, degradation profiles, and bioavailability. For pharmaceutical applications, the amorphous-crystalline balance can determine dissolution rates, solubility, and ultimately drug efficacy. This technical guide examines the fundamental principles, characterization methodologies, and practical implications of crystallinity in polymeric systems, with specific emphasis on experimental protocols and quantitative analysis techniques relevant to research scientists.
Theoretical Foundations: Structural Organization in Polymers
Molecular Architecture of Crystalline and Amorphous Regions
The structural differences between crystalline and amorphous polymers originate at the molecular level. In amorphous polymers, atoms are held together in a loose, unpredictable structure without long-range order, much like a tangled mass of cooked spaghetti [1]. This molecular configuration creates materials that are typically transparent, softer, and more flexible than their crystalline counterparts. When heated, amorphous polymers do not melt at a specific temperature but gradually transition from a hard, glassy state to a soft, rubbery state at what is known as the glass transition temperature (Tg) [1].
In contrast, crystalline polymers contain regions where molecular chains align in highly ordered, repeating patterns. These crystalline zones coexist with amorphous regions in a semi-crystalline structure [3]. The crystalline domains form orderly stacks of folded chains called lamellae, which bring long-range order to the polymer [1]. This molecular organization creates materials that are generally opaque, stiffer, and more resistant to chemicals and heat. Highly crystalline polymers have a definite melting point (Tm) where their orderly arrangement transitions to a random, disorganized state [1].
Table 1: Fundamental Characteristics of Amorphous and Crystalline Polymers
| Characteristic | Amorphous Polymers | Crystalline Polymers |
|---|---|---|
| Molecular Structure | Randomly arranged chains, no long-range order | Ordered, repeating patterns with lamellae formation |
| Transparency | Typically transparent | Typically opaque or translucent |
| Thermal Behavior | Glass transition temperature (Tg), no sharp melting point | Definite melting point (Tm) |
| Mechanical Properties | Softer, more flexible | Harder, stiffer, more brittle |
| Chemical Resistance | More susceptible to solvent penetration | High resistance due to tight molecular packing |
| Density | Lower density | Higher density |
| Processing Shrinkage | Minimal shrinkage | Significant shrinkage during cooling |
Factors Influencing Crystallinity
Several molecular and processing factors determine where a polymer falls on the crystallinity spectrum:
- Chain flexibility: Both flexing along the entire chain and flexing in bonds between atoms plays a significant role in polymer crystal formation [1].
- Molecular branching: Polymers with long branches (like LDPE) do not pack well into crystals, resulting in lower crystalline fractions and higher free volume compared to more linear chains (like HDPE) [14].
- Tacticity: The arrangement of pendant groups along the polymer backbone significantly impacts crystallinity. Isotactic and syndiotactic polymers (with ordered pendant groups) tend to be crystalline, while atactic polymers (with randomly arranged pendant groups) are generally amorphous [1].
- Processing conditions: Cooling rates, annealing procedures, and mechanical stretching during processing can dramatically influence crystallinity development [15].
Quantitative Measurement of Crystallinity
Established Characterization Techniques
Accurately determining a polymer's position on the crystallinity spectrum requires specialized analytical techniques, each with distinct principles and applications.
X-Ray Diffraction (XRD)
XRD is the most widely employed method for crystallinity determination, particularly for cellulose materials [16]. The technique analyzes diffraction patterns generated when X-rays interact with the periodic structures of crystalline domains. For polyethylene, characteristic diffraction peaks appear at q = 1.51 Å⁻¹ (110) and 1.67 Å⁻¹ (200), with peak shifts under compression indicating changes in unit cell volume [14]. The most common XRD approach is the Segal peak height method, which calculates the Crystallinity Index (CrI) using the formula: CrI = (I₂₀₀ - Iₐₘ)/I₂₀₀ × 100%, where I₂₀₀ represents the intensity of the 200 crystalline peak and Iₐₘ the intensity of the amorphous background [16]. However, this method provides only a rough approximation, as the minimum intensity position used for Iₐₘ does not always correspond to the actual maximum of the amorphous peak [16].
Experimental Protocol: XRD Crystallinity Measurement
- Sample Preparation: Prepare polymer samples as thin films or powdered specimens mounted on standard XRD holders.
- Instrument Calibration: Use a polycrystalline silicon standard to calibrate sample-to-detector distance and q-range.
- Data Collection: Expose samples to X-ray beam (typically Cu Kα radiation, λ = 1.5406 Å) with parameters set to 40 kV and 40 mA. Scan 2θ range from 5° to 40° with step size of 0.02° and counting time of 2 seconds per step.
- Pattern Analysis: Identify crystalline peaks and amorphous halo in the diffraction pattern.
- Crystallinity Calculation: Apply peak deconvolution methods or the Segal method to determine crystalline and amorphous fractions.
Nuclear Magnetic Resonance (NMR) Spectroscopy
Solid-state ¹³C NMR provides complementary crystallinity information by analyzing the chemical environment of carbon atoms. For cellulose, crystallinity is typically estimated based on the spectral region assigned to the C-4 carbon [16]. The technique relies on spectral deconvolution to distinguish signals from crystalline and amorphous regions, though this presents inherent limitations due to multiple possible ways to resolve overlapping peaks [16]. Recent advances have also utilized ¹⁹F low-field NMR relaxometry for characterizing crystallinity in fluoropolymers, offering an alternative approach for specialized applications [17].
Fourier Transform Infrared (FT-IR) Spectroscopy
FT-IR spectroscopy offers a rapid, complementary approach for crystallinity estimation based on vibrational band intensity ratios. For cellulose, characteristic bands include:
- 1429 cm⁻¹: "Crystallinity band" from asymmetric CH₂ bending vibrations
- 893 cm⁻¹: "Amorphous band" from C-O-C stretching of β-(1→4)-glycosidic linkages
- 1372 cm⁻¹: CH bending vibrations (crystallinity indicator)
- 2900 cm⁻¹: CH stretching vibrations (amorphous characteristic) [16]
The Total Crystallinity Index (TCI) is calculated as the intensity ratio of the 1372 cm⁻¹ and 2900 cm⁻¹ bands [16]. While FT-IR provides valuable chemical bonding information, it is highly sensitive to sample thickness, density, and measurement conditions, limiting its accuracy as a standalone quantitative method [16].
Differential Scanning Calorimetry (DSC)
DSC determines crystallinity by measuring the heat flow associated with polymer melting transitions. The degree of crystallinity (Xc) is calculated using the formula: Xc = (ΔHf/ΔHf⁰) × 100%, where ΔHf is the measured enthalpy of fusion and ΔHf⁰ is the theoretical enthalpy of fusion for a 100% crystalline polymer. DSC also provides glass transition temperatures (Tg) for amorphous regions and melting points (Tm) for crystalline domains.
Emerging Approaches: Machine Learning-Enhanced Analysis
Recent advances have integrated spectroscopic methods with machine learning algorithms to improve crystallinity estimation accuracy. For cellulose materials, machine learning models trained on IR spectroscopy data have demonstrated enhanced capability in predicting crystallinity compared to traditional heuristic peak assignment approaches [16]. These models employ feature contribution analysis to identify informative spectral variables and can be applied to diverse cellulose-containing materials, including wood pulps, microcrystalline cellulose, and cellulose nanomaterials [16]. This approach represents a paradigm shift from isolated band analysis to comprehensive spectral profiling, potentially overcoming limitations of conventional FT-IR crystallinity assessment.
Table 2: Comparison of Crystallinity Measurement Techniques
| Technique | Principle | Applications | Limitations |
|---|---|---|---|
| X-Ray Diffraction (XRD) | Analysis of crystalline diffraction patterns | Most widely used method; suitable for various polymers | Requires crystalline standards; complex data interpretation |
| Solid-State NMR | Spectral differentiation of crystalline and amorphous carbon environments | Cellulose crystallinity; polymer microstructure | Limited sensitivity; complex instrumentation |
| FT-IR Spectroscopy | Absorbance ratio of crystalline vs. amorphous bands | Rapid screening; chemical bonding information | Sensitive to measurement conditions; semi-quantitative |
| Differential Scanning Calorimetry (DSC) | Measurement of melting enthalpies | Thermal behavior analysis; widely accessible | Requires reference values; thermal history effects |
| Machine Learning + Spectroscopy | Multivariate analysis of spectral features | High-throughput screening; complex materials | Model training required; limited interpretability |
Experimental Protocols for Crystallinity Analysis
Sample Preparation Standards
Consistent sample preparation is critical for reliable crystallinity measurements. For XRD analysis, polymer specimens should be processed as flat sheets or compressed powders to ensure uniform diffraction geometry. For transmission-based techniques like FT-IR, sample thickness should be optimized to achieve absorbance values in the linear range of the Beer-Lambert law (typically 0.3-0.8 AU). For comparative studies, all samples should undergo identical thermal history and conditioning protocols to minimize processing-induced crystallinity variations.
Reference Material Preparation
Accurate crystallinity quantification requires appropriate reference materials. For cellulose crystallinity assessment, common standards include:
- Microcrystalline cellulose (MCC): Crystalline standard with average particle size of 50μm [16]
- Ball-milled cellulose: Amorphous reference prepared by planetary milling with zirconia balls [16]
- Xylan and lignin powders: Additional amorphous standards for mixture models [16]
Binary mixtures of crystalline and amorphous standards in known proportions can establish calibration curves for quantitative crystallinity determination.
Crystallinity-Property Relationships in Polymeric Systems
Mechanical Performance
Crystallinity profoundly influences polymer mechanical behavior. Highly crystalline polymers like PTFE, PEEK, and UHMWPE exhibit superior tensile strength, stiffness, and dimensional stability [3]. The crystalline regions act as physical crosslinks, enhancing load transfer and resistance to deformation. Under dynamic loading, crystalline polymers like polyethylene demonstrate chain alignment parallel to the shock direction, with diffraction studies revealing anisotropic reorganization during compression [14]. In contrast, amorphous polymers such as PEI and polyimide tend toward greater flexibility, reduced brittleness, and higher resistance to stress cracking [3].
The relationship between crystallinity and mechanical properties is particularly evident in polyethylene variants. UHMWPE, with long linear chains that effectively transfer load to the polymer backbone, demonstrates exceptional impact resistance despite having lower density than HDPE due to increased free volume from extended chains [14]. LDPE, with its long-chain branching that inhibits crystal packing, exhibits lower crystalline fractions and consequently different mechanical responses under compression [14].
Thermal Behavior
Thermal properties show perhaps the most direct correlation with crystallinity. Highly crystalline polymers display sharp melting points (Tm) due to their ordered structure, while amorphous polymers lack definite melting points and instead undergo glass transitions (Tg) over a temperature range [1]. For example, crystalline polymers like PVDF retain strength and stability at elevated temperatures, while amorphous polymers like PVC soften gradually, allowing versatile processing [3].
Table 3: Thermal Transitions of Common Polymers by Crystallinity Type
| Polymer | Type | Tg (°C) | Tm (°C) | Applications |
|---|---|---|---|---|
| PTFE | Crystalline | ~127 | ~327 | Seals, filters, non-stick coatings |
| PEEK | Crystalline | ~143 | ~343 | Aerospace, medical implants |
| UHMWPE | Crystalline | ~-100 | - | Wear-resistant components, artificial joints |
| PVDF | Crystalline | ~-35 | ~177 | Piping, chemical processing |
| PA66 | Crystalline | ~70 | ~255 | Automotive parts, textiles |
| PEI | Amorphous | ~215 | None | Aerospace, medical applications |
| Polyimide | Amorphous | ~250 | None | Electronics, flexible circuits |
| PVC | Amorphous | ~85 | None | Construction, healthcare tubing |
Chemical Resistance and Barrier Properties
Crystalline polymers generally exhibit superior chemical resistance due to their tight molecular packing, which limits solvent penetration and diffusion [3]. PTFE represents an extreme example, with exceptional chemical inertness making it ideal for harsh environments [3]. Recent developments in two-dimensional polymers like 2D polyaramid (2DPA-1) have demonstrated unprecedented barrier properties, with nitrogen permeability below 3.1 × 10⁻⁹ Barrer - nearly four orders of magnitude lower than conventional polymers and approaching the impermeability of graphene [18]. These materials achieve molecular impermeability through layered, orientational ordering with interlayer spacing of 3.3±0.2Å, effectively eliminating free volume between monolayers [18].
Optical Characteristics
The structural organization of polymers directly affects their optical properties. Amorphous polymers typically offer high transparency due to their homogeneous structure at the molecular level, which minimizes light scattering. In contrast, crystalline polymers are generally opaque or translucent because the refractive index differences between crystalline and amorphous regions scatter visible light. This property relationship makes amorphous polymers preferable for applications requiring optical clarity, while crystalline polymers dominate where opacity is acceptable or desirable.
Advanced Applications and Emerging Research Frontiers
Two-Dimensional Amorphous Materials
Recent breakthroughs in two-dimensional amorphous materials approaching the single-layer limit have revealed unique disorder-dominated properties with significant implications for electronics, catalysis, and energy applications [19]. These ultra-thin amorphous systems exhibit distinctive structural descriptors including local bonding variations, topological disorder characterized by parameters like disordered hyperuniformity (DHU) and ring statistics, and flexible chemical composition [19]. Monolayer amorphous carbon (MAC), for instance, demonstrates remarkable mechanical strength and tunable electrical conductivity dependent on synthesis temperature, with materials produced at 300°C showing electrical conductivity nine orders of magnitude higher than those synthesized at 400°C [19].
Crystalline Two-Dimensional Conjugated Polymers
The synthesis of crystalline two-dimensional conjugated polymers (2DCPs) via irreversible chemistry under mild conditions represents another frontier in polymer crystallinity research [20]. These materials feature long-range molecular ordering, robust olefin linkages, and well-controlled thickness from monolayer to multilayer architectures [20]. The pre-assembly of trimethylpyridinium monomers at water interfaces significantly enhances condensation reactivity, enabling crystalline 2DCP formation under ambient conditions [20]. Such advances highlight how molecular organization strategies can overcome traditional crystallinity limitations.
Multi-Material 3D Printing via Crystallinity Control
Innovative manufacturing approaches exploit crystallinity control for multi-material 3D printing from single formulations. By adjusting printing temperature and light intensity, researchers can selectively produce semi-crystalline or amorphous domains within a single printed part [15]. Using liquid crystalline monomers that form highly stable phases with trifunctional thiol crosslinkers, this approach achieves pixel-to-pixel resolution of material properties guided solely by printing parameters [15]. The technique enables fabrication of complex structures with spatially controlled crystallinity for shape memory applications, data storage, and encryption systems.
The Scientist's Toolkit: Essential Research Reagents and Materials
Successful crystallinity research requires specialized materials and analytical tools. The following table summarizes key resources for experimental investigations of polymer crystallinity.
Table 4: Essential Research Reagents and Materials for Crystallinity Studies
| Reagent/Material | Function/Application | Specifications |
|---|---|---|
| Microcrystalline Cellulose (MCC) | Crystalline standard for calibration | Average particle size ~50μm [16] |
| Ball-milled Cellulose | Amorphous reference material | Prepared by planetary milling with zirconia balls [16] |
| Xylan & Lignin Powders | Amorphous standards for mixture models | Commercial purity grades [16] |
| Polycrystalline Silicon | XRD calibration standard | Certified reference material |
| Deuterated Solvents | NMR spectroscopy | DMSO-d6, CDCl3 for polymer dissolution |
| Potassium Bromide (KBr) | FT-IR pellet preparation | FT-IR grade, purified |
| Langmuir-Blodgett Trough | 2D polymer monolayer assembly | Precision temperature control [20] |
| Trimethylpyridinium Monomers | 2D conjugated polymer synthesis | Alkyl-quaternized for interfacial polycondensation [20] |
| Liquid Crystalline Monomers | Multi-material 3D printing | Smectic X phase with sharp LC-isotropic transition [15] |
Experimental Workflow Visualization
Diagram 1: Comprehensive Workflow for Polymer Crystallinity Characterization. This workflow integrates multiple analytical techniques with machine learning enhancement for robust crystallinity quantification.
The spectrum of crystallinity from 0% to 100% provides a fundamental framework for understanding and engineering polymer properties. As characterization methodologies advance from traditional XRD to machine learning-enhanced spectroscopy, and synthesis techniques evolve toward two-dimensional polymers with controlled disorder, researchers gain unprecedented capability to tailor materials for specific applications. For pharmaceutical scientists, these developments offer new pathways to optimize drug delivery systems through precise crystallinity control, balancing stability, dissolution, and bioavailability. The continuing investigation of crystallinity relationships across material classes promises to unlock further innovations in polymer science and drug development.
Within polymer science, the concepts of the Glass Transition Temperature (Tg) and the Melting Point (Tm) are fundamental to understanding material behavior. These thermal transitions are not merely data points but are direct consequences of a polymer's molecular architecture, dictating its mechanical properties, processing conditions, and ultimate application suitability. Framed within the critical context of amorphous versus crystalline polymer structures, this guide delves into the distinct nature of Tg and Tm. For researchers and drug development professionals, a precise grasp of these transitions is indispensable for tasks ranging from selecting a polymer for a drug-delivery matrix to predicting the long-term stability of a medical device. The transition temperatures are not intrinsic material constants in the strictest sense but are influenced by molecular weight, thermal history, and the presence of additives, making their accurate measurement and interpretation a cornerstone of polymeric material science [21] [22].
Defining the Fundamental Transitions
Glass Transition Temperature (Tg)
The Glass Transition Temperature (Tg) is the critical temperature range below which an amorphous polymer or the amorphous regions of a semi-crystalline polymer behave as a rigid, glassy solid, and above which they become soft, flexible, and rubbery [23] [22]. This is a second-order transition, meaning it is not a true phase change between states of thermodynamic equilibrium but rather a kinetic and reversible change in the physical properties of the material [21] [22]. At the molecular level, below the Tg, the polymer chains are frozen in place, lacking the thermal energy for large-scale segmental motion. As the temperature surpasses the Tg, the chains gain sufficient mobility to begin sliding past one another, leading to the rubbery state [23] [24]. This transition dramatically alters key properties, including hardness, elasticity, volume, and thermal expansion coefficient [22].
Melting Temperature (Tm)
The Melting Temperature (Tm), in contrast, is the temperature at which the crystalline regions of a polymer melt, transitioning from an ordered solid to a disordered liquid state [21] [25]. This is a first-order transition, characterized by an abrupt, discontinuous change in properties and the absorption of latent heat [21] [26]. Tm is a property of the crystalline regions within a polymer. When heated to Tm, the highly ordered, stable crystalline structure breaks down as the polymer chains gain enough energy to overcome the intermolecular forces holding the crystal lattice together, resulting in a viscous liquid [23] [1]. It is crucial to note that 100% amorphous polymers do not possess a Tm, as they lack any crystalline structure to melt [21].
Comparative Analysis: Tg vs. Tm
The distinction between Tg and Tm is foundational to polymer morphology. The following diagram illustrates the relationship between polymer structure and its thermal transitions.
The core differences between these two transitions are systematized in the table below.
Table 1: Fundamental Differences Between Tg and Tm
| Characteristic | Glass Transition Temperature (Tg) | Melting Temperature (Tm) |
|---|---|---|
| Governing Principle | Onset of segmental motion in amorphous regions [21] [23] | Dissociation of the crystalline lattice [21] [26] |
| Order of Transition | Second-order (change in slope of properties) [21] [22] | First-order (discontinuity in properties) [21] [26] |
| Molecular Process | Chains gain mobility; transition from frozen to rubbery state [23] [24] | Crystalline structure is lost; transition from solid to liquid melt [21] [1] |
| Physical State Change | Glassy solid Rubbery/Viscous state [22] [27] | Crystalline Solid Isotropic Liquid [25] [26] |
| Dependence on Crystallinity | Property of amorphous regions [21] [1] | Property of crystalline regions [21] [1] |
Factors Influencing Tg and Tm
The specific values of Tg and Tm for a given polymer are not fixed but can be tuned by altering its chemical and physical structure. Understanding these factors is key for material design.
Table 2: Factors Affecting Tg and Tm
| Factor | Effect on Tg | Effect on Tm |
|---|---|---|
| Molecular Weight | Increases with molecular weight due to decreased chain-end free volume [23] | Generally increases with molecular weight [23] |
| Chain Stiffness / Rigidity | Increases with rigid backbone chains and bulky side groups [23] [27] | Increases with chain stiffness and restricted rotation [26] |
| Intermolecular Forces | Increases with strong polar groups and high cohesion [23] | Increases with strong intermolecular forces [26] |
| Cross-Linking | Increases significantly by restricting chain motion [23] [28] | Increases; highly cross-linked thermosets decompose before melting [24] |
| Plasticizers | Decreases by increasing free volume and chain mobility [23] [27] | Can be depressed, though less pronounced effect than on Tg [23] |
| Crystallinity | The amorphous regions undergo Tg; higher crystallinity can restrict mobility [27] [28] | Directly corresponds to the melting of the crystalline regions [1] |
| Branching | Random (atactic) branching typically decreases Tg [23] | Can depress Tm by disrupting crystal perfection [23] |
Experimental Determination of Thermal Transitions
Accurately measuring Tg and Tm requires specific and sensitive thermal analysis techniques. The following experimental workflow outlines the primary methods used.
Key Measurement Techniques
- Differential Scanning Calorimetry (DSC): This is a primary technique where the heat flow into a sample and a reference is monitored as a function of temperature or time. Tg is identified as a step change in the heat flow curve due to a change in heat capacity, while Tm is identified as a distinct endothermic peak as the crystals melt [23] [27]. Standard test methods include ASTM D3418 and ISO 11357-2 [23].
- Dynamic Mechanical Analysis (DMA): DMA is exceptionally sensitive for detecting Tg. It applies a oscillating stress to the sample and measures the resulting strain. The Tg is marked by a dramatic drop in the storage modulus (stiffness) and a peak in the loss modulus (damping), providing information on the mechanical manifestation of the transition [23] [22]. A standard method is ASTM E1640 [23].
- Differential Thermal Analysis (DTA): Similar to DSC, DTA measures the temperature difference between a sample and a reference material under controlled heating. Thermal transitions like Tg and Tm appear as deviations in the temperature difference plot [23].
- Thermomechanical Analysis (TMA): TMA measures dimensional changes in a polymer as it is heated. The Tg is observed as a change in the coefficient of thermal expansion, as the polymer transitions from a glassy to a rubbery state [27].
The Scientist's Toolkit: Essential Materials and Reagents
Table 3: Key Reagent Solutions and Materials for Thermal Analysis
| Item | Function / Relevance in Research |
|---|---|
| Differential Scanning Calorimeter | The core instrument for measuring heat flow associated with Tg and Tm transitions; essential for quality control and polymer identification [23] [27]. |
| Dynamic Mechanical Analyzer | Instrument for characterizing the viscoelastic properties of polymers; provides the most sensitive measurement of the mechanical glass transition [23] [27]. |
| Hermetic Sealed Crucibles | Sample pans for DSC that prevent volatile loss from the polymer sample during heating, ensuring data integrity [23]. |
| Inert Reference Materials | High-purity materials like alumina used as references in DSC and DTA to baseline the instrument's heat flow [23]. |
| Plasticizers (e.g., phthalates) | Chemical additives used to deliberately lower the Tg of a polymer system, increasing its flexibility and processability [23] [28]. |
| Cross-Linking Agents (e.g., peroxides) | Reagents used to create covalent bonds between polymer chains, increasing Tg and thermal stability [23] [28]. |
| High-Purity Polymer Standards | Materials with certified Tg and Tm values used for calibration and validation of thermal analysis equipment [23]. |
Tg and Tm Data for Common Polymers
The following table provides the thermal transition values for a selection of polymers relevant to industrial and research applications, illustrating the wide range of properties achievable.
Table 4: Glass Transition and Melting Temperatures of Selected Polymers
| Polymer | Abbreviation | Polymer Type | Tg (°C) | Tm (°C) |
|---|---|---|---|---|
| Polyisoprene (Natural Rubber) | PIP | Amorphous | -70 [22] | - |
| Polyethylene (High Density) | HDPE | Semi-crystalline | -120 [24] [28] | 137 [1] |
| Polypropylene (atactic) | PP | Amorphous | -20 to -17 [22] [1] | - |
| Polypropylene (isotactic) | PP | Semi-crystalline | 0 [22] | 174 [1] |
| Poly(vinyl acetate) | PVAc | Amorphous | 30 [22] | - |
| Poly(ethylene terephthalate) | PET | Semi-crystalline | 70 [22] [27] | 250 [27] |
| Poly(vinyl chloride) | PVC | Amorphous | 80 [22] | - |
| Polystyrene | PS | Amorphous | ~100 [22] [24] [28] | - |
| Poly(methyl methacrylate) | PMMA | Amorphous | ~105 [22] | - |
| Polycarbonate | PC | Amorphous | ~145 [24] [28] | - |
| Polyetheretherketone | PEEK | Semi-crystalline | 140 [24] | 340* |
| Polyetherimide | PEI | Amorphous | 210 [24] [28] | - |
*Note: Tm value for PEEK is from general scientific knowledge, as the provided search results did not contain it.
The distinction between the glass transition temperature (Tg) and the melting point (Tm) is a fundamental paradigm in polymer science, rooted in the amorphous and crystalline morphological structures of these materials. Tg, a second-order transition governing the rubbery state, and Tm, a first-order transition governing the crystalline melt, collectively define the thermal and mechanical performance window of any polymeric material. For researchers and scientists, particularly in demanding fields like drug development, a deep understanding of these transitions—and the factors that modulate them—is not merely academic. It is the bedrock of rational material selection, predictive performance modeling, and the innovative design of advanced polymeric systems tailored to specific technological and therapeutic challenges.
The properties of polymeric materials are profoundly influenced by their hierarchical structure, ranging from the molecular to the macroscopic scale. Within the context of amorphous versus crystalline polymer structures, the tacticity of a polymer—the stereochemical arrangement of pendant groups along the macromolecular backbone—serves as a critical determinant of its ultimate physical characteristics and application potential [29]. Tacticity arises when a polymer chain contains asymmetric carbon atoms, typically from the polymerization of vinyl monomers (CH2=CHX) [29]. The precise control over this stereoregularity enables materials scientists to tailor polymers for specific needs, from commodity plastics to advanced drug delivery systems.
At the most fundamental level, tacticity governs the ability of polymer chains to pack into ordered, crystalline regions or to remain in a disordered, amorphous state [30]. Isotactic and syndiotactic configurations, with their regular structures, facilitate chain alignment and crystallinity, leading to materials with enhanced mechanical strength, thermal resistance, and chemical stability [29] [30]. In contrast, atactic polymers, with their random stereochemistry, typically form amorphous glasses with lower strength and higher permeability but often with greater transparency [2] [30]. This whitepaper provides an in-depth technical examination of how tacticity influences polymer structure-property relationships, with particular emphasis on implications for pharmaceutical and materials research.
Defining Tacticity Configurations
Structural Isomerism in Polymers
Tacticity refers to the spatial arrangement of pendant groups (X) along the polymer backbone derived from vinyl monomers [29]. This configuration is determined during the polymerization process as each new monomer adds to the growing chain. The classification is based on the arrangement of consecutive stereocenters:
- Isotactic: Pendant groups are consistently located on the same side of the polymer backbone when viewed in a planar projection. This corresponds to a meso (m) diad placement between consecutive monomer units [29] [31].
- Syndiotactic: Pendant groups alternate regularly from one side to the other along the chain, corresponding to a racemic (r) diad placement [29] [31].
- Atactic: Pendant groups are arranged randomly along the polymer backbone with no discernible pattern, resulting in a statistical mixture of diad types [29].
The regularity of isotactic and syndiotactic structures enables long-range order and crystallinity, whereas the randomness of atactic structures generally prevents crystallization [30]. For a sequence of three monomer units (a triad), isotactic triads are denoted mm, syndiotactic triads rr, and heterotactic triads mr [31]. The relative prevalence of these triad sequences quantifies the overall tacticity of a polymer chain.
Historical Context and Significance
The profound implications of tacticity on polymer properties were first systematically recognized through the work of Giulio Natta in 1954 [30]. Natta's investigation of polypropylene demonstrated that the stereoregularity of the polymer chain dramatically influenced its physical characteristics. This discovery, building upon Karl Ziegler's catalyst systems, led to the development of stereospecific polymerization methods that could control the tacticity of the resulting polymers [29] [30]. The commercial impact of this discovery was monumental, creating what has been described as a "billion dollar industry" based on stereoregular polymers [29].
Table 1: Fundamental Characteristics of Tacticity Configurations
| Configuration | Stereochemical Pattern | Diad/Triad Notation | Degree of Order | Crystallization Tendency |
|---|---|---|---|---|
| Isotactic | All pendant groups on same side | m diad, mm triad | High long-range order | High |
| Syndiotactic | Alternating pendant groups | r diad, rr triad | Medium-to-high order | Moderate to high |
| Atactic | Random placement of pendant groups | Random m/r | Low order | Low |
Influence of Tacticity on Crystallinity and Physical Properties
Mechanisms of Crystallization in Stereoregular Polymers
The ability of polymer chains to organize into crystalline domains is fundamentally dependent on their stereoregularity [32]. Isotactic and syndiotactic polymers can form ordered structures because their regular configurations allow chains to align parallel to one another and fold into lamellae [2] [33]. These lamellae further organize into larger superstructures called spherulites, which can range from 1 to 100 micrometers in size [32]. In contrast, the irregular structure of atactic polymers prevents this orderly packing, resulting in predominantly amorphous materials [30].
The crystallization process involves nucleation followed by crystal growth [32]. Nucleation begins with small, nanometer-sized areas where chain segments align through thermal motion. These nuclei must reach a critical size to become stable before further growth can occur. For stereoregular polymers like isotactic polypropylene, crystal growth proceeds through the addition of folded polymer chain segments at temperatures between the glass transition (Tg) and melting temperature (Tm) [32]. The resulting crystalline regions act as physical crosslinks, significantly enhancing the mechanical properties of the material.
Comparative Physical Properties
The dramatic effect of tacticity on polymer properties is exemplified by polypropylene [30]. Atactic polypropylene is soft, elastic, somewhat sticky, and soluble in many organic solvents at room temperature. In contrast, isotactic polypropylene is a hard, strong crystalline polymer with a melting point of 175°C, and it is practically insoluble in all organic solvents at room temperature [30]. This striking difference originates solely from the configuration of the methyl groups attached to the polymer backbone.
The melting point difference between isotactic polypropylene (175°C) and polyethylene (110°C), despite the similarity in their chemical structures, arises from their different crystallization patterns [30]. While polyethylene forms extended zig-zag chains, isotactic polypropylene must form helical structures to accommodate the steric demands of the methyl groups. These helical coils are more rigid and exhibit stabilizing interchain interactions, thus requiring higher temperatures for melting [30].
Table 2: Property Comparison of Polypropylene Tacticity Variants
| Property | Atactic Polypropylene | Isotactic Polypropylene |
|---|---|---|
| State at Room Temperature | Soft, elastic, somewhat sticky | Hard, strong, rigid |
| Crystallinity | Amorphous (~0%) [32] | Highly crystalline (70-80%) [32] |
| Melting Point | No sharp melting point | 175°C [30] |
| Solubility | Soluble in solvents like tetrachloroethane | Insoluble in most solvents at room temperature |
| Optical Properties | Transparent | Translucent |
| Typical Applications | Adhesives, sealants | Detergent bottles, automotive parts, fibers |
Quantitative Impact of Tacticity on Polymer Behavior
Research on poly(methacrylic acid) (PMA) has quantitatively demonstrated how subtle changes in tacticity influence polymer behavior [31]. Studies comparing atactic and syndiotactic PMAs with slightly increasing amounts of rr triads (from 60% to 80%) revealed significant differences in solution conformation and interfacial behavior. Syndiotactic PMA with higher rr triad content showed a pronounced maximum in Small-Angle Neutron Scattering (SANS) profiles at pH 5.5, suggesting the presence of ordered conformations and/or aggregates not detectable in the atactic form [31].
Furthermore, the tacticity affected interactions with cationic surfactants like DTAB. Polymers with higher syndiotacticity demonstrated stronger interactions with surfactant micelles, which could significantly impact their performance in drug delivery applications where membrane interactions are crucial [31]. These findings underscore that even relatively small changes in triad content can cause measurable changes in solution and interfacial behavior that could impact biological properties when used as polymeric excipients or polymer therapeutics.
Experimental Characterization Methods
Determining Tacticity and Crystallinity
Several analytical techniques are employed to characterize polymer tacticity and its resulting effect on crystallinity:
- Nuclear Magnetic Resonance (NMR) Spectroscopy: ¹³C NMR is particularly powerful for determining tacticity, as it can distinguish between the different configurational sequences in polymer chains [30]. The chemical shifts of backbone carbons are sensitive to their stereochemical environment, allowing quantification of mm, mr, and rr triads.
- Differential Scanning Calorimetry (DSC): DSC measures thermal transitions in polymers, including the glass transition temperature (Tg) and melting point (Tm) [2]. The enthalpy of fusion measured during melting can be used to calculate the degree of crystallinity by comparing it to the value for a 100% crystalline reference material.
- X-Ray Diffraction (XRD): Wide-angle X-ray scattering (WAXS) can distinguish between crystalline and amorphous regions based on their diffraction patterns [32]. Crystalline regions produce sharp diffraction peaks, while amorphous regions result in broad halos.
- Density Measurements: Crystalline regions are typically more densely packed than amorphous areas, leading to density differences up to 15% depending on the material [32]. Density gradient columns provide a simple method to estimate crystallinity based on this principle.
Advanced Characterization Techniques
For more detailed structural analysis, several advanced techniques provide additional insights:
- Small-Angle Neutron Scattering (SANS): Used to study polymer conformation in solution and how tacticity influences chain dimensions and aggregation behavior [31].
- Dynamic Mechanical Analysis (DMA): Measures the viscoelastic properties of polymers as a function of temperature, providing information on stiffness (modulus) and damping characteristics across transitions [2].
- Polarized Light Microscopy: Visualizes spherulitic structures in semi-crystalline polymers, allowing observation of crystal growth and morphology [32].
Diagram 1: Polymer Tacticity and Crystallinity Characterization Workflow
Experimental Protocols for Tacticity Analysis
Protocol 1: Tacticity Determination via ¹³C NMR Spectroscopy
Objective: To determine the relative proportions of isotactic (mm), heterotactic (mr), and syndiotactic (rr) triads in a polymer sample.
Materials and Equipment:
- Polymer sample (≥10 mg)
- Deuterated solvent appropriate for the polymer (e.g., deuterated chloroform, DMSO-d6)
- NMR tubes
- High-resolution NMR spectrometer (300 MHz or higher)
Procedure:
- Sample Preparation: Dissolve 10-15 mg of polymer in 0.6 mL of deuterated solvent. Filter if necessary to remove insoluble impurities.
- Instrument Setup: Load sample into NMR spectrometer. Set temperature appropriate for the polymer-solvent system (typically 25-50°C).
- Data Acquisition:
- Use a 90° pulse width and sufficient relaxation delay (D1 ≥ 5 seconds)
- Collect a minimum of 64 scans to ensure adequate signal-to-noise ratio
- Set spectral width to encompass the region of interest (typically 0-200 ppm for ¹³C NMR)
- Data Analysis:
- Identify the resonance peaks corresponding to the backbone carbons or pendant groups sensitive to tacticity
- Integrate the peaks corresponding to mm, mr, and rr triads
- Calculate triad fractions: % mm = (Immi/Itotal) × 100, where Immi is the integrated area of the mm triad peak and Itotal is the sum of all triad peaks
Interpretation: Higher mm content indicates isotactic structure, while higher rr content indicates syndiotacticity. Approximately equal distribution suggests atactic configuration [30].
Protocol 2: Crystallinity Determination via Differential Scanning Calorimetry
Objective: To determine the degree of crystallinity in stereoregular polymers based on melting endotherms.
Materials and Equipment:
- Polymer sample (5-10 mg)
- Hermetic DSC pans and press
- Differential Scanning Calorimeter
- Nitrogen gas for purge
Procedure:
- Sample Preparation: Precisely weigh 5-10 mg of polymer and seal in a hermetic aluminum DSC pan. Prepare an empty reference pan.
- Method Programming:
- Equilibrate at -50°C (or 50°C below expected Tg)
- Ramp temperature at 10°C/min to 30°C above expected melting point
- Hold for 2 minutes to erase thermal history
- Cool at 10°C/min to initial temperature
- Second heat ramp at 10°C/min to 30°C above melting point (data from this cycle is typically used for analysis)
- Data Analysis:
- Identify the melting endotherm peak temperature (Tm)
- Integrate the area under the melting peak to determine the enthalpy of fusion (ΔHf)
- Calculate percentage crystallinity: Xc = (ΔHf / ΔHf°) × 100, where ΔHf° is the enthalpy of fusion for a 100% crystalline reference material
Interpretation: Higher crystallinity values indicate more ordered structures, typically associated with isotactic or syndiotactic configurations [2] [32].
Table 3: Research Reagent Solutions for Tacticity Studies
| Reagent/Equipment | Function/Application | Technical Notes |
|---|---|---|
| Deuterated Solvents (CDCl3, DMSO-d6) | Solvent for NMR spectroscopy | Must be appropriately matched to polymer solubility; stored under inert atmosphere |
| Ziegler-Natta Catalysts | Stereospecific polymerization | Titanium-based catalysts with aluminum co-catalysts for isotactic polypropylene |
| Metallocene Catalysts | Single-site polymerization for tacticity control | Can produce specific tacticities with narrow molecular weight distribution |
| Cationic Surfactants (DTAB, CTAB) | Studying polymer-surfactant interactions | Reveals tacticity-dependent interfacial behavior [31] |
| DSC Calibration Standards (Indium, Tin) | Temperature and enthalpy calibration for DSC | Essential for quantitative crystallinity measurements |
| Size Exclusion Chromatography | Molecular weight determination | Coupled with tacticity analysis to understand structure-property relationships |
Implications for Pharmaceutical and Materials Development
Tacticity in Polymer Therapeutics and Drug Delivery
The tacticity of polymers used in pharmaceutical applications significantly influences their behavior in biological systems [31]. Research on poly(methacrylic acid) (PMA) has demonstrated that the stereoregularity affects solution conformation, interactions with biological membranes, and even cytotoxicity [31]. Syndiotactic PMA with higher rr triad content showed different solution behavior compared to atactic forms, including the presence of ordered conformations and aggregates at specific pH values [31]. These structural differences directly impact biological interactions, making tacticity a crucial consideration in polymer therapeutic design.
In drug delivery systems, the crystallinity imparted by stereoregularity affects drug release kinetics, biodegradation rates, and mechanical properties of delivery devices [34]. Semi-crystalline polymers typically exhibit slower drug release rates compared to their amorphous counterparts due to the reduced permeability of crystalline domains [33]. This can be advantageous for sustained release formulations but may require modification for immediate-release applications. The degradation of biodegradable polymers like poly(lactic acid) and poly(glycolic acid) is also influenced by crystallinity, with amorphous regions degrading more rapidly than crystalline areas [34].
Biological Interactions and Toxicity Considerations
Preliminary biological studies using B16F10 cells have indicated that the tacticity of PMA can influence cytotoxicity and cellular uptake [31]. These findings suggest that stereoregularity may impact the safety profile of polymer therapeutics, an important consideration in pharmaceutical development. The observed differences likely stem from variations in polymer-cell membrane interactions, which are influenced by the chain conformation and aggregation behavior dictated by tacticity [31].
Furthermore, in stimuli-responsive drug delivery systems, the tacticity can influence the response to biological triggers such as pH changes or enzyme presence [34]. The ability of polymers to undergo conformational changes in response to these stimuli—a key mechanism for targeted drug release—depends on their chain flexibility and organization, both of which are tacticity-dependent [31] [34].
Diagram 2: Structure-Property Relationships in Stereoregular Polymers
The tacticity of polymers—whether isotactic, syndiotactic, or atactic—serves as a fundamental molecular-level parameter that dictates material behavior across multiple length scales. Through its control over crystallinity and chain packing, tacticity influences mechanical properties, thermal behavior, optical characteristics, and biological interactions [29] [30]. The recognition of these relationships has enabled the rational design of polymeric materials with tailored properties for specific applications.
In pharmaceutical development, understanding tacticity effects is increasingly important as polymer-based therapeutics grow more sophisticated [31]. The subtle influences of stereoregularity on solution conformation, surfactant interactions, and cellular responses underscore the need for comprehensive characterization of polymer tacticity in drug delivery systems [31]. Similarly, in materials science, the ability to control tacticity through advanced polymerization catalysts continues to enable new applications with precise performance requirements.
As research advances, the integration of tacticity control with other structural parameters—such as molecular weight distribution, branching, and block architecture—will further expand the possibilities for custom-designed polymeric materials. The continued development of analytical techniques for characterizing tacticity and its effects will support these innovations, providing researchers with the tools needed to establish robust structure-property relationships in this critical domain of polymer science.
From Theory to Therapy: Engineering Polymers for Advanced Drug Delivery Systems
Polymer-based platforms represent a transformative approach in modern drug delivery, enabling precise temporal and spatial control over the release of therapeutic agents. These systems offer significant improvements over conventional dosage forms by enhancing drug bioavailability, prolonging circulation time, and providing site-specific action while minimizing systemic side effects [35]. The fundamental ability of polymers to respond to specific biological stimuli or undergo predictable degradation kinetics makes them indispensable in addressing complex therapeutic challenges. Within this domain, the physical state of the polymer—whether amorphous or crystalline—plays a critical role in determining key performance characteristics, including drug loading capacity, release profile, and physical stability. This overview examines the core polymer platforms, their mechanisms, and the pivotal influence of polymer structure on controlled drug release, providing a technical foundation for researchers and drug development professionals.
Core Polymer Platforms and Drug Release Mechanisms
Advanced polymer platforms utilize various architectural designs and mechanisms to achieve controlled drug release. The following table summarizes the primary platforms, their core mechanisms, and key advantages.
Table 1: Key Polymer Platforms for Controlled Drug Release
| Platform | Mechanism of Drug Release | Key Characteristics | Common Polymers Used |
|---|---|---|---|
| Stimuli-Responsive (Smart) Polymers [35] | Undergo physical/chemical changes (e.g., swelling, dissolution) in response to specific triggers. | Enables precise, site-specific release; tunable response. | pH-sensitive polymers, thermo-sensitive polymers, enzyme-degradable polymers. |
| Polymeric Nanoparticles [36] [37] | Drug encapsulation followed by diffusion, polymer erosion, or a combination thereof. | Nanoscale size for cellular uptake; superior stability and versatility; can be functionalized for targeting. | PLGA, PLA, Silk Fibroin, Chitosan. |
| Amorphous Solid Dispersions (ASDs) [38] [39] | Drug molecularly dispersed in a polymer matrix; release governed by dissolution and diffusion through the polymer. | Significantly enhances solubility and bioavailability of poorly soluble drugs. | HPMC, HPMCAS, Kollidon VA 64, Eudragit EPO. |
| Phase-Separated Polymer Blends [40] | Utilizes morphology; a hydrophilic polymer phase dissolves to create channels for drug release from a hydrophobic matrix. | Release profile is tuned by varying the polymer ratio and resulting morphology. | Blends of Hydrophobic (e.g., PLA) and Hydrophilic (e.g., HPMC) polymers. |
The effectiveness of these platforms is highly dependent on the polymer's physicochemical properties. Smart polymers, also known as stimuli-responsive polymers, can respond to internal stimuli (such as pH, redox conditions, or enzyme levels) or external triggers (like temperature or light) [35]. This adaptability allows for drug release precisely at the diseased site. Polymeric nanoparticles (PNPs) leverage their nanoscale size for targeted cellular uptake and navigation of biological barriers [36] [37]. Recent innovations have led to "smart" PNPs that combine responsiveness with targeting capabilities. Amorphous Solid Dispersions (ASDs) are a leading strategy to improve the dissolution and bioavailability of poorly soluble drugs by stabilizing the amorphous form of the drug within a polymeric matrix [39]. Finally, phase-separated polymer blends offer a novel mechanism where the connectivity of a dissolving hydrophilic phase within a continuous hydrophobic matrix creates a porous network that dictates the release rate [40].
The Amorphous vs. Crystalline State in Polymer-Based Drug Delivery
The physical state of a polymer—amorphous or crystalline—is a Critical Material Attribute (CMA) that profoundly impacts the performance of a drug delivery system. This distinction is central to formulation design and stability.
Fundamental Properties and Their Impact
The amorphous state, characterized by a disordered molecular structure and higher free energy, offers distinct advantages for drug delivery but also presents challenges regarding stability.
Table 2: Impact of Amorphous vs. Crystalline States on Key Properties
| Property | Amorphous State | Crystalline State |
|---|---|---|
| Energy & Thermodynamics | Higher energy, thermodynamically metastable [38]. | Lower energy, thermodynamically stable [38]. |
| Solubility & Bioavailability | Higher apparent solubility and dissolution rate [38] [39]. | Lower solubility, often leading to lower bioavailability [38]. |
| Physical Stability | Prone to recrystallization over time, which reduces solubility [38] [39]. | Physically stable, no risk of recrystallization [38]. |
| Drug Release Mechanism | Release governed by diffusion through the polymer matrix; highly tunable [39] [40]. | Release often limited by the dissolution rate of the crystal lattice. |
Crystallization Kinetics and Molecular Interactions
The tendency of an amorphous system to recrystallize is not universal and is influenced by molecular-level interactions. Research on benzodiazepine derivatives (Diazepam, Nordazepam, Tetrazepam) provides direct evidence for this. Despite similar molecular structures and identical "kinetic fragility indices" (mp ≈ 32), the three compounds exhibited vastly different recrystallization behaviors [38]. Nordazepam, which can form N-H···O hydrogen bonds in both crystalline and amorphous phases, had a higher glass transition temperature (Tg) by 30–40 K and slower crystal growth kinetics compared to Tetrazepam and Diazepam [38]. Diazepam itself showed no recrystallization over short periods, even near its melting point [38]. This demonstrates that recrystallization kinetics cannot be predicted solely by global parameters like Tg or fragility, but are strongly correlated with specific intermolecular interactions like hydrogen bonding [38].
Experimental Protocols for Characterization and Development
Robust experimental characterization is essential for developing and optimizing polymer-based drug delivery systems. Below are detailed methodologies for key experiments cited in this field.
Protocol: Constructing Phase Diagrams for Amorphous Solid Dispersions
Objective: To determine the solubility and miscibility of an Active Pharmaceutical Ingredient (API) in a polymer matrix to guide the development of stable Amorphous Solid Dispersions (ASDs) [39].
- Sample Preparation: Prepare binary mixtures of the API (e.g., Ibuprofen) and polymer (e.g., KOLVA64, HPMCAS) across a range of compositions (e.g., 10-90% w/w API).
- Differential Scanning Calorimetry (DSC):
- Load a few milligrams of each mixture into a pierced aluminum pan.
- Run a heat-cool-heat cycle under a nitrogen atmosphere. A typical method uses a heating rate of 10 K/min.
- From the first heating scan, record the end-set melting temperature of the API in each mixture.
- Data Analysis & Modeling:
- Plot the depressed melting point (Tm) against the API concentration in the mixture.
- Fit the melting point depression data using thermodynamic models such as:
- Flory-Huggins (FH) Theory: To estimate the polymer-API interaction parameter (χ).
- Perturbed-Chain Statistical Associating Fluid Theory (PC-SAFT): A more advanced equation of state to model the solid-liquid equilibrium (SLE) and liquid-liquid equilibrium (LLE) boundaries.
- The output is a temperature-composition phase diagram predicting the stable and meta-stable zones for the ASD.
Protocol: Direct Quantification of Drug Loading in Polymeric Nanoparticles
Objective: To directly and accurately quantify the amount of drug encapsulated within polymeric nanoparticles, overcoming limitations of indirect methods [41].
- Calibration Curve:
- Prepare a series of calibration samples with known masses of the drug (e.g., Naringenin) and blank nanoparticles (e.g., Silk Fibroin Nanoparticles, SFN). The total volume should be kept constant.
- The drug percentage (NAR%) is calculated as: NAR% = [mNAR / (mNAR + m_SFN)] × 100 [41].
- Using Attenuated Total Reflection Fourier Transform Infrared (ATR-FTIR) spectroscopy, measure the infrared absorption spectrum of each calibration sample.
- Plot the intensity of a characteristic drug absorption band against the known NAR% to create a calibration curve.
- Sample Analysis:
- The drug-loaded nanoparticles (e.g., SFNNAR) are prepared and washed to remove unbound drug.
- The final nanoparticle pellet is re-dispersed and analyzed directly via ATR-FTIR without drug extraction.
- The measured absorption intensity is interpolated using the calibration curve to determine the Drug Loading Content (DLC) and Entrapment Efficiency (EE) [41]:
- DLC (%) = (Weight of drug in nanoparticle / Weight of drug-loaded nanoparticle) × 100
- EE (%) = (Weight of drug in nanoparticle / Weight of drug in loading solution) × 100
Protocol: Investigating Release from Phase-Separated Polymer Blends
Objective: To correlate the morphology of phase-separated polymer blends (e.g., PLA/HPMC) with their drug release profiles [40].
- Formulation Processing:
- Blend a hydrophobic polymer (e.g., Polylactic Acid, PLA), a hydrophilic polymer (e.g., Hydroxypropyl methylcellulose, HPMC), and a model drug (e.g., Nicotinamide) at specific ratios (e.g., 70/30, 50/50 PLA/HPMC).
- Process the blend using Hot Melt Extrusion to form an amorphous solid dispersion filament.
- Physical Characterization:
- Differential Scanning Calorimetry (DSC): Confirm the amorphous nature of the drug and identify the glass transition temperature (Tg) of the polymer phases to prove phase separation.
- X-ray Diffraction (XRD): Verify the absence of crystalline drug peaks.
- Morphology Imaging:
- Scanning Electron Microscopy (SEM): Image the filament surface before and after dissolution to observe porosity.
- Ptychographic X-ray Computed Nanotomography (PXCT): Obtain 3D nanoscale resolution of the phase-separated morphology within the pristine filament and quantify phase connectivity.
- In-vitro Dissolution Study:
- Place the extruded filament in a dissolution medium (e.g., phosphate buffer) under sink conditions.
- Use USP apparatus and maintain constant temperature and agitation.
- Collect samples at predetermined time points and analyze drug concentration via HPLC or UV-Vis spectroscopy.
- Plot the cumulative drug release over time to generate the release profile.
Essential Research Toolkit
The following table details key reagents, materials, and computational tools essential for research in polymer-based controlled drug delivery.
Table 3: The Scientist's Toolkit for Polymer Drug Delivery Research
| Tool/Reagent | Function/Application | Example Use-Case |
|---|---|---|
| PLGA (Poly(lactide-co-glycolide)) [42] | A biodegradable, biocompatible copolymer; the "gold standard" for sustained-release microparticles and nanoparticles. | Forming long-acting injectable microparticles (e.g., Lupron Depot) [42]. |
| Cellulose Derivatives (e.g., HPMC, HPMCAS) [39] [40] | Polymers for amorphous solid dispersions (ASDs) and controlled release matrices; provide swelling and erosion release mechanisms. | Acting as a hydrophilic carrier in ASDs or as a channeling agent in phase-separated blends with PLA [40]. |
| Silk Fibroin Nanoparticles (SFN) [41] | A model polymeric nanoparticle carrier known for biodegradability, biocompatibility, and high drug loading capacity. | Used as a carrier for flavonoids like Naringenin to improve therapeutic delivery [41]. |
| Differential Scanning Calorimeter (DSC) [38] [39] | Characterizes melting point, glass transition temperature (Tg), and miscibility in API-polymer blends. | Measuring melting point depression to construct phase diagrams for ASDs [39]. |
| ATR-FTIR Spectroscopy [41] | Directly quantifies drug loading in nanoparticles and analyzes chemical composition and interactions. | Validating drug loading content (DLC) in Silk Fibroin Nanoparticles without need for extraction [41]. |
| Machine Learning (ML) / Artificial Neural Networks (ANNs) [43] | Predicts complex drug release profiles from polymeric systems, accelerating formulation design. | Predicting drug release from 3D-printed dosage forms to advance personalized medicine [43]. |
Visualizing Workflows and Relationships
Drug Release from Phase-Separated Polymer Blends
The following diagram illustrates the mechanism of drug release from a phase-separated polymer blend, a key strategy for tuning release profiles.
Characterization of Amorphous Solid Dispersions (ASD)
This workflow outlines the key experimental and modeling steps for developing and characterizing a stable Amorphous Solid Dispersion.
In the field of controlled drug delivery, diffusion-controlled systems represent a cornerstone technology for achieving predictable and sustained release of therapeutic agents. Among these, monolithic devices, where a drug is uniformly dispersed or dissolved within a polymer matrix, are particularly significant. The release kinetics from these systems are often described by the Higuchi model, a foundational mathematical relationship that has profoundly influenced pharmaceutical development [44]. The properties of the polymer matrix itself—specifically whether it is amorphous or crystalline—are critical in determining the drug release profile and the overall performance of the delivery system [45] [1]. The deliberate selection of polymer morphology allows researchers to fine-tune drug release rates, enhance stability, and improve therapeutic outcomes. This guide provides an in-depth technical examination of monolithic devices, the application of the Higuchi model, and the pivotal role of polymer structure in designing advanced drug delivery systems.
Theoretical Foundations of Diffusion and the Higuchi Model
Fick's Laws of Diffusion
Drug release from monolithic systems is primarily governed by diffusion, a mass transfer process driven by random molecular motion down a concentration gradient [46]. This process is quantitatively described by Fick's first law:
J = -D (dC/dx)
In this equation, J represents the flux (the rate of mass transfer per unit area), D is the diffusion coefficient of the drug in the polymer matrix, and dC/dx is the concentration gradient across the diffusion path. The negative sign indicates that diffusion occurs in the direction of decreasing concentration. The diffusion coefficient (D) is influenced by factors such as the size and shape of the drug molecule, the viscosity of the diffusion medium, and, critically, the morphology of the polymer matrix [46].
Derivation and Application of the Higuchi Model
The Higuchi model was one of the first theoretical frameworks to quantitatively describe drug release from a matrix system. Its derivation, as detailed in the seminal work, was based on several key assumptions [44]:
- The initial drug concentration in the matrix is much higher than the drug's solubility in the matrix material.
- Drug diffusion is one-dimensional and follows Fickian kinetics.
- The matrix is considered a "perfect sink," meaning the drug concentration at the matrix surface is effectively zero.
- The drug particles are much smaller than the thickness of the matrix.
- The matrix structure remains unchanged during the release process.
Under these conditions, the cumulative amount of drug released per unit area (Q) at time t is given by the classic Higuchi equation:
Q = [D(2C₀ - Cₛ)Cₛ t]^1/2
where C₀ is the initial drug concentration, Cₛ is the drug's solubility in the matrix, and D is the diffusion coefficient. This equation simplifies to Q = Kᴴ √t, where Kᴴ is the Higuchi dissolution constant, indicating that drug release is proportional to the square root of time [44] [46]. This relationship is a hallmark of diffusion-controlled release from a planar matrix.
Limitations and Misuse of the Model
The Higuchi equation is a simplified model, and its misuse often stems from applying it outside its intended scope. Key limitations and common misunderstandings include [44]:
- Swelling or Erosion: The model assumes an inert, non-swellable, and non-erodible matrix. It is not applicable to systems where polymer swelling, relaxation, or chemical degradation significantly influences release.
- Geometry: The original derivation was for a thin, planar film. Different equations are required for spherical or cylindrical geometries.
- Concentration: The assumption that the initial drug load (C₀) is much greater than solubility (Cₛ) is critical. If C₀ is less than or equal to Cₛ, the release kinetics will follow a different, non-Higuchi profile.
The Critical Role of Polymer Morphology
The physical structure of the polymer matrix—whether it is amorphous, crystalline, or semi-crystalline—is a primary determinant of drug diffusivity and, consequently, the release profile.
Amorphous vs. Crystalline Polymers: A Fundamental Distinction
- Amorphous Polymers: These polymers have their atoms arranged in a random, loose structure with no long-range order, often described as a "chain entanglement" similar to a pile of cooked spaghetti [1]. They do not have a true melting point (Tₘ) but undergo a gradual transition from a glassy to a rubbery state at a specific temperature known as the glass transition temperature (T𝑔). Below T𝑔, the material is hard and brittle; above it, the chains gain mobility, making the polymer soft and flexible [1]. This transition directly impacts drug diffusion, which is typically higher in the rubbery state.
- Crystalline Polymers: The chains in these polymers fold into orderly, stacked structures known as lamellae, imparting long-range order [1]. They are characterized by a distinct melting point (Tₘ). The tightly packed crystalline regions act as barriers to drug diffusion, slowing the release rate. No polymer is 100% crystalline; most are semi-crystalline, containing both crystalline and amorphous regions [1]. The ratio of these regions, known as the degree of crystallinity, directly controls properties like tensile strength, opacity, and drug release behavior [6].
Table 1: Key Characteristics of Amorphous and Crystalline Polymers
| Property | Amorphous Polymers | Crystalline Polymers |
|---|---|---|
| Long-Range Order | No | Yes |
| Thermal Transition | Glass Transition Temperature (T𝑔) | Melting Point (Tₘ) |
| Chain Arrangement | Random, entangled | Ordered, folded lamellae |
| Effect on Drug Diffusion | Generally higher and more variable | Restricted by crystalline domains |
| Mechanical Properties | Ductile, less rigid | Hard, rigid, strong |
| Example Polymers | Atactic Polypropylene, Poly(methyl methacrylate) [1] | Polyethylene, Nylon, Isotactic Polypropylene [1] |
Impact on Drug Release and Stability
The choice between amorphous and crystalline polymers has direct implications for drug delivery:
- Amorphous Polymers for Enhanced Solubility: Amorphous solid dispersions can significantly improve the dissolution rate and bioavailability of poorly water-soluble drugs (BCS Class II) because the drug in its high-energy amorphous form has greater thermodynamic activity [45]. A key challenge is the physical instability of the amorphous drug, which can recrystallize over time or during dissolution, negating the solubility advantage. Amorphous polymers like polyvinylpyrrolidone (PVP) are often used to inhibit this crystallization by forming specific molecular interactions with the drug, thereby stabilizing the supersaturated state [45].
- Crystalline Polymers for Sustained Release: The tortuous path created by crystalline lamellae in semi-crystalline polymers like Poly(lactic-co-glycolic acid) (PLGA) or polyethylene can effectively slow down drug diffusion, making them ideal for sustained-release applications [47] [1]. The study on letrozole-loaded PLGA microparticles embedded in a pHEMA matrix is a prime example of using a relatively hydrophobic, semi-crystalline polymer to achieve a sustained release profile over 32 days [47].
Experimental Case Study: A Hybrid Hydrogel System
A 2025 study on a letrozole-loaded hybrid hydrogel system provides an excellent experimental protocol for a monolithic-type device, showcasing the integration of polymer science and release kinetics modeling [47].
Research Reagent Solutions
Table 2: Essential Materials and Their Functions in the Hybrid Hydrogel Experiment [47]
| Research Reagent | Function in the Experiment |
|---|---|
| Poly(lactic-co-glycolic acid) (PLGA) | A biodegradable, semi-crystalline copolymer forming the drug-loaded microparticles; its hydrophobicity and erosion tune release. |
| Letrozole | Model drug (anti-breast cancer agent) for encapsulation and release studies. |
| 2-Hydroxyethyl methacrylate (HEMA) | Monomer used to form the continuous poly(HEMA) (pHEMA) hydrogel matrix. |
| Acrylamide-grafted LDPE (AAm-g-LDPE) | Backbone film providing mechanical stability for the coated hydrogel. |
| Polyvinyl Alcohol (PVA) | Stabilizer used in the formation of PLGA microparticles. |
| N,N-methylenebisacrylamide (BIS) | Cross-linker for the pHEMA matrix, controlling mesh size and swelling. |
| Potassium Persulfate (KPS) | Redox initiator for the free radical polymerization of HEMA. |
| N,N,N',N'-Tetramethylethylenediamine (TEMED) | Accelerator for the polymerization reaction. |
| Simulated Uterine Fluid (SUF, pH 7.6) | Dissolution medium for in vitro release studies, mimicking the biological environment. |
Detailed Experimental Protocol
- Preparation of Drug-Loaded Microparticles: Letrozole-encapsulated PLGA microparticles were first prepared using a solvent evaporation method. Different formulations (F1-F4) with varying drug loads (0.5%, 1%, 2% w/w) were produced [47].
- Fabrication of the Hybrid System: The prepared PLGA microparticles were uniformly dispersed in a HEMA monomer solution. The AAm-g-LDPE films were immersed in this mixture under a nitrogen purge to remove oxygen. The initiator (KPS) and cross-linker (BIS) were added and homogenized. Finally, TEMED was added to accelerate the polymerization, which proceeded for 24 hours at 22°C to form the pHEMA matrix coated onto the AAm-g-LDPE backbone [47].
- System Characterization:
- Morphology: Field emission scanning electron microscopy (FE-SEM) was used to confirm the uniform distribution of the PLGA microparticles within the pHEMA matrix and to measure the coating thickness (50–70 µm) [47].
- Internal Structure: Confocal laser scanning microscopy (CLSM) was employed to verify the uniform internal dispersion of microparticles, revealing spherical particles and some slight deformations due to processing stress [47].
- In-Vitro Release Study: The drug release from the prepared systems was evaluated in SUF (pH 7.6) at 37°C. The amount of letrozole released was quantified over time using a spectroscopic method [47].
- Kinetic Modeling: The release data was fitted to various mathematical models, including the Higuchi model, to determine the underlying release mechanism [47].
Diagram 1: Experimental workflow for the hybrid hydrogel system.
Results and Data Analysis
The study successfully demonstrated a sustained release of letrozole over 32 days. The system showed a reduced initial burst effect (approximately 15% lower than conventional PLGA systems), which is often a challenge in monolithic devices [47]. The release kinetics were best described by the Higuchi model, with a high coefficient of determination (R² = 0.803–0.996), indicating that the primary mechanism of drug release was Fickian diffusion through the polymer matrix [47].
Table 3: Quantitative Release Kinetics Data from the Case Study [47]
| Kinetic Model | Coefficient of Determination (R²) | Interpretation |
|---|---|---|
| Higuchi Model | 0.803 – 0.996 | Strong fit, indicating drug release is primarily controlled by Fickian diffusion. |
| Zero-Order | Not specified (lower than Higuchi) | Weaker fit, ruling out constant release rate over time. |
| First-Order | Not specified (lower than Higuchi) | Weaker fit, ruling out release rate proportional to remaining drug. |
Essential Characterization Techniques
A thorough understanding of a monolithic system requires a multi-faceted characterization approach to link material properties to performance.
- Thermal Analysis (DSC): Differential Scanning Calorimetry is critical for identifying thermal transitions such as the glass transition temperature (T𝑔) of amorphous regions and the melting point (Tₘ) of crystalline domains. This reveals the polymer's physical state, miscibility with the drug, and potential for recrystallization [45] [6].
- Morphological Analysis (XRD and Microscopy): X-ray Diffraction (XRD) quantitatively measures the crystalline/amorphous ratio within a polymer, which is a key design parameter [6]. Scanning Electron Microscopy (SEM/FE-SEM) and Confocal Microscopy visualize surface and internal structure, particle distribution, and coating integrity [47].
- Release Kinetics Modeling: As demonstrated, fitting dissolution data to models like Higuchi, Korsmeyer-Peppas, and zero-order is essential for identifying the drug release mechanism and optimizing the formulation [47] [48].
Diagram 2: Polymer characterization techniques and their linked properties.
The design of diffusion-controlled monolithic devices is a sophisticated process that hinges on the synergistic application of the Higuchi model and a deep understanding of polymer morphology. The distinction between amorphous and crystalline polymers provides a powerful toolset for formulators. Amorphous polymers can enhance the dissolution of poorly soluble drugs but require careful stabilization, while semi-crystalline polymers are excellent for creating robust, sustained-release profiles. As the case study of the letrozole-loaded hybrid hydrogel shows, combining different polymer types (e.g., semi-crystalline PLGA microparticles within an amorphous pHEMA matrix) can yield advanced systems with tailored release kinetics, reduced burst effects, and improved patient compliance. Future trends in polymer science, including the development of novel biohybrids and nanocomposites, promise to further expand the capabilities of these foundational drug delivery platforms [49].
Solvent-activated systems are foundational to controlled drug delivery, with their performance governed by the swelling kinetics of the polymer matrix. The fundamental distinction between amorphous and crystalline polymer structures creates divergent pathways for solvent penetration and drug release. In amorphous polymers, the lack of long-range order and presence of free volume facilitate rapid solvent penetration, leading to a sharp, advancing swelling front and often case-II transport kinetics. In contrast, the dense, ordered lamellae of crystalline polymers present a significant barrier, resulting in much slower, Fickian diffusion-dominated solvent ingress. Research on ternary amorphous solid dispersions (TASDs) demonstrates how exploiting the amorphous state can enhance the delivery of poorly water-soluble drugs; a 50% drug-loaded TASD showed a ~197-fold increase in dissolved drug compared to its crystalline counterpart after 1 hour [50]. The swelling and erosion behaviors of the polymer matrix are thus critical, as they directly determine the drug release profile from the dosage form [51].
Quantitative Data on Swelling and Dissolution Kinetics
Drug Release Kinetics from Amorphous Solid Dispersions
Table 1: Experimental Drug Release Performance of Amorphous Solid Dispersions
| Formulation Type | Drug Loading (% w/w) | Polymer System | Release Enhancement (vs. Crystalline) | Key Release Mechanism | Physical Stability |
|---|---|---|---|---|---|
| Ternary Amorphous Solid Dispersion (TASD) | 50% | Curcumin/Resveratrol/Eudragit EPO | ~197-fold (Curcumin), ~4-fold (Resveratrol) | Polymer-controlled dissolution & strong drug-polymer interactions | 12 months at room temperature [50] |
| Binary Amorphous Solid Dispersion (ASD) | 50% | Curcumin/Resveratrol with HPMCAS or S100 | Lower than TASD | Drug-polymer complexation susceptible to media pH | N/A |
| ASD with Enteric Polymer | 25% | Bedaquiline/HPMCAS | Highly variable (pH-dependent) | Insoluble drug-polymer complex formation at neutral pH | Disrupted in biorelevant media [52] |
Swelling and Dissolution Kinetics of Cellulose Fibers
Table 2: Swelling and Dissolution Kinetics of Natural and Man-Made Cellulose Fibers in Ionic Liquid ([EMIM][OAc]) [53]
| Fiber Type | Classification | Dissolution Rate in Neat [EMIM][OAc] | Sensitivity to Solvent Power (Water Content) | Dominant Kinetics Factor |
|---|---|---|---|---|
| Ioncell | Man-made (Lyocell-type) | Fastest | Moderate | Fiber accessibility & solvent viscosity |
| Cordenka | Man-made | Slowest | Moderate | Fiber accessibility & solvent viscosity |
| Flax | Natural | Intermediate | Highest (Most Sensitive) | Hierarchical structure & solvent power |
Experimental Protocols for Assessing Swelling Behaviors
Advanced, non-destructive techniques are essential for real-time monitoring of swelling and erosion, providing insights beyond conventional methods.
Magnetic Resonance Imaging (MRI)
- Principle: Utilizes the magnetic properties of atoms (e.g., 1H in water) to visualize internal structures. It can non-invasively track the movement of the solvent front and map water concentration gradients within a hydrating polymer matrix in real-time [51].
- Protocol: A tablet or polymer sample is placed in a suitable holder and exposed to the dissolution medium. A series of MR images are acquired over time. The signal intensity, proportional to water concentration, is used to quantify the thickness of the swollen gel layer and track the movement of the rubbery-glassy interface [51].
- Key Application: Successfully used to monitor swelling behavior and drug release kinetics from chitosan acetate matrix tablets [51].
X-ray Microtomography (XμT)
- Principle: Generates high-resolution 3D images of a specimen's internal structure without destruction by collecting a series of X-ray images from different angles and reconstructing them computationally [51].
- Protocol: Tracer particles are embedded in the gel-forming tablet. As the sample swells, XμT scans are performed at set intervals. The movement of the tracer particles, which is initiated by the swelling and gel formation, is tracked to visualize and quantify the dynamic swelling process [51].
- Key Application: Has been applied to study the movement of tracer particles in gel-forming tablets to reveal swelling progress [51].
Attenuated Total Reflectance Fourier Transform Infrared (ATR-FTIR) Spectroscopy
- Principle: Probes chemical reactions and structures at the solid/liquid interface by measuring the interaction of infrared radiation with the sample. It is highly sensitive to molecular bonds and their interactions [51] [52].
- Protocol: The polymer or dosage form is placed in contact with the ATR crystal. As the solvent enters the system, FTIR spectra are collected continuously. Changes in the spectra (e.g., shifts in absorption peaks) indicate polymer solvation, water uptake, and the formation of specific drug-polymer complexes [51] [52].
- Key Application: Used to study the sorption and diffusion of water into polymers and to confirm the formation of an insoluble complex between bedaquiline and HPMCAS in certain media [52].
Texture Analysis
- Principle: Measures physical properties such as force, deformation, and hardness by applying a controlled stress to a sample. For swelling studies, a probe simulates the mechanical forces encountered in the GI tract [51].
- Protocol: A swelling tablet is placed under a probe, which periodically compresses the sample at a defined force. The resistance of the gel layer to penetration is measured over time, providing data on gel layer strength, swelling rate, and erosion rate [51].
- Key Application: Provides useful information on swelling and erosion rates, and the strength of the swollen gel, which affects the drug diffusion coefficient [51].
Visualization of Swelling Mechanisms and Experimental Workflows
Swelling-Front Mechanism in Solvent-Activated Delivery
Workflow for Advanced Swelling and Release Analysis
The Scientist's Toolkit: Essential Research Reagents and Materials
Table 3: Key Research Reagents and Materials for Swelling and Release Studies
| Reagent/Material | Function in Research | Example Application |
|---|---|---|
| Eudragit EPO | Cationic polymer for pH-dependent release and ternary ASDs. | Used in high drug-loaded (50%) TASDs to enhance dissolution and provide physical stability [50]. |
| HPMCAS (Hypromellose Acetate Succinate) | Enteric polymer for pH-responsive release; can form insoluble complexes. | Investigated for ASDs of weakly basic drugs; complexation can limit release at neutral pH unless disrupted by biorelevant media [52]. |
| Ionic Liquids (e.g., [EMIM][OAc]) | Tunable solvents for studying dissolution and swelling kinetics. | Used to study the dissolution kinetics of cellulose fibers by varying solvent power with water content [53]. |
| Bio-relevant Media (FaSSIF/FeSSIF) | Simulates intestinal fluids; contains solubilizing species. | Used to demonstrate the disruption of drug-polymer complexes, leading to improved drug release from ASDs [52]. |
| Fluorescent Dyes & Tracers | Molecular probes for visualizing pore structure and material movement. | Embedded in tablets for XμT studies to track swelling progression and gel formation [51] [53]. |
Designing Biodegradable and Bioerodible Polymeric Carriers
The design of biodegradable and bioerodible polymeric carriers represents a frontier in modern drug delivery, enabling targeted therapeutic release, improved bioavailability, and reduced dosing frequency. The efficacy of these systems is fundamentally governed by their underlying polymer morphology—the arrangement of molecular chains into amorphous or crystalline structures. This technical guide explores the deliberate engineering of polymer morphology to control degradation kinetics, drug release profiles, and mechanical performance of delivery carriers.
The distinction between amorphous and crystalline regions in polymers significantly influences their physical properties and biodegradation behavior. Amorphous polymers possess randomly arranged, entangled chains with no long-range order, creating a more open structure that permits faster penetration by water and enzymes. In contrast, semi-crystalline polymers contain densely packed, orderly regions (lamellae) that slow degradation, as hydrolytic attack must first penetrate the disordered zones before disrupting crystalline domains. A polymer's degree of crystallinity—ranging from entirely amorphous to predominantly crystalline—directly determines whether it exhibits a sharp melting point (Tm) or a gradual glass transition temperature (Tg), both critical parameters for drug delivery system design [1].
Advances in precision polymer synthesis now enable unprecedented control over molecular architecture, facilitating the creation of carriers with tailored erosion profiles. This guide provides researchers with the fundamental principles, experimental methodologies, and formulation strategies required to effectively design polymeric carriers for specific therapeutic applications.
Fundamental Principles of Polymer Morphology
Structural Characteristics of Amorphous and Crystalline Polymers
The behavior of biodegradable polymers in drug delivery systems stems from their molecular-level organization. Understanding these structural differences is essential for rational carrier design.
Amorphous polymers exhibit chains that are randomly arranged and highly entangled, lacking any long-range molecular order. This disordered structure, often likened to a plate of cooked spaghetti, creates relatively large free volumes between chains. These voids allow greater penetration by water, enzymes, and drug molecules, generally resulting in faster degradation rates and more rapid drug release. Amorphous polymers do not melt at a specific temperature but instead undergo a gradual transition from a glassy, rigid state to a rubbery, flexible state as temperature increases beyond their Tg [1] [4].
Semi-crystalline polymers possess both organized crystalline regions and disordered amorphous areas. The crystalline domains (lamellae) consist of folded polymer chains packed in an orderly fashion, creating dense regions that resist penetration by solvents and degrade slowly. These crystalline regions are held together by strong intermolecular forces, giving the polymer enhanced mechanical strength and chemical resistance. The amorphous zones between crystalline regions provide pathways for initial hydrolytic attack and drug diffusion [1].
Table 1: Fundamental Characteristics of Amorphous and Semi-Crystalline Polymers
| Characteristic | Amorphous Polymers | Semi-Crystalline Polymers |
|---|---|---|
| Molecular Structure | Randomly entangled chains, no long-range order | Ordered lamellae with disordered interlamellar regions |
| Thermal Transition | Glass transition temperature (Tg) | Melting point (Tm) and glass transition (Tg) |
| Degradation Profile | Typically faster, more continuous | Typically slower, often biphasic |
| Drug Diffusion | Generally faster | Generally slower, diffusion-limited |
| Mechanical Properties | Softer, more flexible, higher impact strength | Harder, more rigid, better wear resistance |
| Solvent Resistance | Lower, more susceptible to solvent penetration | Higher, resistant to many solvents |
Degradation Mechanisms and Morphological Implications
The degradation of polymeric carriers occurs through two primary mechanisms: bulk erosion and surface erosion. In bulk erosion, water penetration occurs faster than the polymer's degradation rate, leading to homogeneous degradation throughout the matrix. This mechanism is characteristic of hydrophilic, amorphous polymers like poly(lactic-co-glycolic acid) (PLGA). In contrast, surface erosion occurs when the degradation rate exceeds water penetration, resulting in layer-by-layer erosion from the surface inward. This profile is often observed in highly crystalline or hydrophobic polymers [54].
The crystallinity of a polymer significantly influences its degradation pathway. During hydrolysis, amorphous regions degrade preferentially, potentially increasing the overall crystallinity of the remaining matrix—a phenomenon known as crystallization-mediated degradation. This self-reinforcing mechanism can lead to accelerated late-stage release as the crystalline regions eventually become compromised [1].
Material Selection and Characterization
Classes of Biodegradable Polymers for Drug Delivery
Biodegradable polymers for drug delivery systems are broadly categorized as natural or synthetic, each offering distinct advantages for specific applications. The selection of polymer type directly influences carrier performance, degradation kinetics, and biocompatibility.
Natural biodegradable polymers, including chitosan, collagen, albumin, and gelatin, are derived from biological sources and typically exhibit excellent biocompatibility and inherent bioactivity. Chitosan, sourced from crustacean shells, possesses mucoadhesive properties that enhance residence time at mucosal surfaces and inherent antimicrobial activity that can reduce preservative requirements in formulations [55] [54]. These materials are particularly valuable for tissue engineering applications and delivery systems where natural remodeling is desired.
Synthetic biodegradable polymers offer greater control over mechanical properties, degradation rates, and reproducibility. The most extensively studied class includes aliphatic polyesters such as poly(lactic acid) (PLA), poly(glycolic acid) (PGA), and their copolymer PLGA. These polymers degrade through hydrolysis of ester bonds into metabolizable acids, with degradation rates tunable through molecular weight, crystallinity, and copolymer ratio. Other significant synthetic polymers include polycaprolactone (PCL) with its slower degradation profile, polyanhydrides known for surface-eroding characteristics, and polyphosphoesters offering versatile backbone chemistry [54].
Table 2: Selected Biodegradable Polymers for Drug Delivery Applications
| Polymer | Type | Crystallinity | Degradation Time | Key Applications |
|---|---|---|---|---|
| PLA | Synthetic | Semi-crystalline | 12-24 months | Long-term implants, microspheres |
| PGA | Synthetic | Semi-crystalline | 2-4 months | Sutures, short-term delivery |
| PLGA | Synthetic | Amorphous to semi-crystalline | 1-6 months (adjustable) | Microparticles, nanoparticles, scaffolds |
| PCL | Synthetic | Semi-crystalline | 24+ months | Long-term implants, contraceptive devices |
| Chitosan | Natural | Semi-crystalline | Weeks to months | Mucoadhesive systems, gene delivery |
| Polyanhydrides | Synthetic | Amorphous | Days to months | Surface-eroding systems, localized therapy |
Characterization Techniques for Polymer Morphology
Comprehensive characterization of polymer morphology is essential for predicting carrier performance. Multiple analytical techniques provide complementary information about structural properties.
Thermal analysis using Differential Scanning Calorimetry (DSC) determines key transition temperatures including Tg, Tm, and enthalpy of fusion (ΔHf). The degree of crystallinity (Xc) can be calculated from ΔHf using the equation: Xc = (ΔHf / ΔHf°) × 100%, where ΔHf° is the enthalpy of fusion for a 100% crystalline reference. These thermal parameters directly influence drug release kinetics and processing conditions [1].
X-ray Diffraction (XRD) measures crystalline structure and orientation through diffraction patterns. Sharp peaks indicate crystalline regions, while broad halos suggest amorphous domains. The crystallite size can be estimated using the Scherrer equation: τ = Kλ / (βcosθ), where τ is crystallite size, K is the shape factor, λ is the X-ray wavelength, β is line broadening at half the maximum intensity, and θ is the Bragg angle [1].
Spectroscopic techniques including Fourier-Transform Infrared (FTIR) and Raman spectroscopy identify chemical bonds and molecular interactions. FTIR can detect crystalline-sensitive bands, such as the 920 cm⁻¹ band in PLA that indicates crystalline content. Nuclear Magnetic Resonance (NMR) spectroscopy provides detailed information about polymer composition, sequence distribution, and chain dynamics [54].
Chromatographic methods like Gel Permeation Chromatography (GPC) determine molecular weight and polydispersity, critical parameters influencing both mechanical properties and degradation rates. Advanced techniques such as atomic force microscopy (AFM) and scanning electron microscopy (SEM) visualize surface morphology and erosion patterns throughout degradation [56].
Experimental Protocols for Carrier Development
Nanoparticle Preparation by Emulsion-Solvent Evaporation
The emulsion-solvent evaporation method is widely used for preparing polymeric nanoparticles with controlled size and drug loading. This protocol describes the preparation of PLGA nanoparticles, modifiable for other biodegradable polymers.
Materials and Equipment:
- Polymer: PLGA (50:50, acid-terminated, MW 10-20 kDa)
- Drug: Hydrophobic model compound (e.g., dexamethasone)
- Organic solvent: Dichloromethane (DCM, HPLC grade)
- Aqueous phase: Polyvinyl alcohol (PVA, 1-3% w/v in DI water)
- Equipment: Probe sonicator, magnetic stirrer, rotary evaporator, centrifugation, dynamic light scattering (DLS) instrument
Procedure:
- Organic phase preparation: Dissolve 100 mg PLGA and 5-20 mg drug in 5 mL DCM by vortexing until clear.
- Aqueous phase preparation: Dissolve PVA (1% w/v) in DI water at 60°C with stirring, then cool to room temperature.
- Primary emulsion formation: Add organic phase to 20 mL aqueous PVA solution while probe sonicating (40% amplitude, 2 minutes on ice bath) to form oil-in-water emulsion.
- Solvent evaporation: Transfer emulsion to 100 mL aqueous PVA solution (0.1-0.3% w/v) and stir magnetically (500 rpm, 4-6 hours) at room temperature to evaporate DCM.
- Nanoparticle collection: Centrifuge at 15,000 × g for 30 minutes at 4°C, wash twice with DI water to remove excess PVA and unencapsulated drug.
- Lyophilization: Resuspend nanoparticles in cryoprotectant solution (e.g., 5% trehalose) and freeze-dry for 48 hours to obtain free-flowing powder.
Characterization:
- Size and zeta potential: Dilute nanoparticles in DI water (0.1 mg/mL) and analyze by DLS
- Drug loading: Dissolve 5 mg nanoparticles in DCM, extract drug into suitable solvent, and quantify by HPLC against standard curve
- Morphology: Examine by SEM or TEM after negative staining
This method typically yields nanoparticles of 150-300 nm with encapsulation efficiency of 50-80%, depending on drug hydrophobicity and polymer composition [54] [57].
Degradation Kinetics Study
Understanding polymer degradation profiles is essential for predicting drug release and carrier lifetime. This protocol systematically evaluates degradation kinetics.
Materials and Equipment:
- Polymer films or nanoparticles
- Buffer solutions: Phosphate-buffered saline (PBS, pH 7.4), acetate buffer (pH 5.0)
- Equipment: Incubator/shaker, analytical balance, GPC, DSC, pH meter
Procedure:
- Sample preparation: Prepare polymer films by solvent casting (5% w/v polymer solution in suitable solvent, cast onto glass, dry under vacuum) or use pre-formed nanoparticles.
- Degradation conditions: Weigh samples (W₀) and place in vials with degradation medium (10 mL buffer per 100 mg sample). Maintain at 37°C with constant shaking (100 rpm).
- Sampling schedule: At predetermined time points (e.g., days 1, 3, 7, 14, 28, etc.), remove triplicate samples for analysis.
- Mass loss measurement: Rinse retrieved samples with DI water, dry under vacuum to constant weight (Wt), and calculate mass loss: Mass Loss (%) = [(W₀ - Wt) / W₀] × 100%.
- Molecular weight analysis: Dissolve dried samples in appropriate solvent and analyze by GPC to track molecular weight changes.
- Morphological changes: Examine selected samples by SEM and DSC to correlate mass loss with structural changes.
Data Analysis:
- Plot mass loss and molecular weight reduction versus time
- Determine degradation rate constants from linear regression of molecular weight data
- Correlate morphological changes with degradation stages
This systematic approach reveals how polymer composition, crystallinity, and morphology influence degradation profiles, enabling rational design of carriers with predetermined lifespans [1] [54].
Advanced Design Strategies and Applications
Morphology-Controlled Release Systems
Advanced delivery systems exploit polymer morphology to achieve precise release kinetics. Layer-by-layer (LbL) nanoparticles represent a sophisticated platform for controlling biologic delivery through sequential polyelectrolyte deposition. For instance, insulin-loaded nanocapsules with carboxymethyl starch and spermine-modified starch demonstrated colon-targeted delivery, with release profiles directly tunable through shell compactness and layer composition [57].
Stimuli-responsive systems leverage morphological transitions in response to biological cues. pH-sensitive polymers containing ionizable groups undergo swelling or dissolution at specific pH values, enabling targeted release in acidic tumor microenvironments or cellular compartments. Temperature-responsive systems utilizing polymers with lower critical solution temperature (LCST) behavior can be designed for pulsatile release in response to mild hyperthermia [15].
Multi-material 3D printing from single formulations represents a cutting-edge approach for creating devices with spatially controlled morphology and release properties. Recent advances demonstrate that simple adjustments in printing temperature and light intensity can produce semi-crystalline and amorphous regions within a single printed structure, enabling programmable degradation and release profiles without changing material composition [15].
Targeting and Biointeraction Engineering
Surface engineering of polymeric carriers enhances their interaction with biological systems. Ligand functionalization with targeting moieties (e.g., peptides, antibodies, aptamers) enables receptor-mediated uptake in specific tissues. For EGFR+ tumors, nanoparticles functionalized with epidermal growth factor (EGF) showed significantly enhanced cellular association and internalization compared to non-targeted systems [57].
Stealth properties conferred by polyethylene glycol (PEG) coatings or biomimetic polymers reduce opsonization and extend circulation half-life. The degree of PEGylation and polymer crystallinity jointly influence protein adsorption patterns, with optimal combinations dramatically improving pharmacokinetic profiles [57].
The Scientist's Toolkit: Essential Research Reagents
Table 3: Key Research Reagents for Polymeric Carrier Development
| Reagent/Category | Function | Examples & Specifications |
|---|---|---|
| Biodegradable Polymers | Carrier matrix providing structural framework and controlling release | PLGA (50:50, 75:25, acid-terminated, MW 10-100 kDa); PLA (D- and L-isomers); PCL (MW 20-100 kDa); Chitosan (low, medium, high MW) |
| Stabilizers & Surfactants | Control nanoparticle formation and stability | Polyvinyl alcohol (PVA, 87-89% hydrolyzed); Poloxamers (Pluronic F68, F127); Polysorbate 80; Dioctyl sulfosuccinate (AOT) |
| Crosslinkers | Modify degradation rate and mechanical properties | Glutaraldehyde (for natural polymers); Genipin (natural crosslinker); N,N'-methylenebisacrylamide |
| Targeting Ligands | Enable specific tissue/cell recognition | Folic acid; Transferrin; RGD peptides; Aptamers; Monoclonal antibody fragments |
| Characterization Standards | Calibrate analytical instruments | Polystyrene standards (GPC); Reference materials for DSC (indium, tin); Size standards (DLS) |
The field of biodegradable polymeric carriers continues to evolve with emerging trends focusing on intelligent systems that respond to multiple biological stimuli, high-throughput screening methodologies for accelerated formulation development, and computational approaches for predictive design. Machine learning frameworks like PolyCL demonstrate how polymer representation learning can accelerate property prediction and candidate selection without extensive experimental iteration [58].
The integration of amorphous-crystalline composite systems represents a promising direction for creating carriers with optimized mechanical integrity and release profiles. Multi-temperature 3D printing techniques that generate semi-crystalline and amorphous regions from a single formulation enable unprecedented spatial control over drug release kinetics within implantable devices [15].
In conclusion, the deliberate design of biodegradable and bioerodible polymeric carriers requires deep understanding of polymer morphology and its profound influence on degradation behavior, drug release kinetics, and in vivo performance. By applying the principles and methodologies outlined in this guide, researchers can engineer sophisticated delivery systems that maximize therapeutic efficacy while minimizing adverse effects, advancing toward the ultimate goal of personalized medicine.
Stimuli-Responsive and Recognitive Polymer Systems for Intelligent Delivery
Stimuli-responsive polymers (SRPs), or "smart polymers," represent a transformative class of materials capable of undergoing predictable and often reversible physicochemical changes in response to specific internal or external stimuli. These dynamic properties enable sophisticated applications in intelligent drug delivery, allowing for precise spatiotemporal control over therapeutic release. The efficacy of these systems is profoundly influenced by their underlying morphological structure, particularly the balance between amorphous and crystalline domains within the polymer matrix. This guide provides an in-depth technical examination of SRP design, synthesis, and functionality, framed within the critical context of polymer crystallinity to inform researchers and drug development professionals.
The fundamental appeal of SRPs lies in their ability to transcend the limitations of traditional passive drug carriers. Whereas conventional systems release therapeutics at a constant rate, SRPs can modulate drug release in direct response to pathological triggers, such as the acidic pH of a tumor microenvironment, the presence of specific enzymes, or localized redox conditions [59]. This targeted, on-demand release enhances therapeutic efficacy while minimizing off-target effects. The manifestation of these intelligent behaviors is not merely a function of chemical composition but is intrinsically governed by the physical arrangement of polymer chains—from highly ordered crystalline lamellae to disordered amorphous regions [1]. Understanding and controlling this amorphous-crystalline dichotomy is, therefore, paramount to engineering next-generation recognitive delivery systems.
Amorphous vs. Crystalline Polymer Structures: A Foundational Framework
The properties and stimulus-response dynamics of any polymeric drug delivery system are dictated by its morphology. Polymers are rarely entirely crystalline or amorphous; most exist on a spectrum characterized by their degree of crystallinity [1].
Structural and Property Characteristics
Amorphous polymers possess a loose, random, and entangled chain structure with no long-range order, analogous to a tangled pile of cooked spaghetti [1]. This lack of order results in several key characteristics:
- They do not have a sharp melting point ((Tm)) but instead undergo a gradual transition from a glassy to a rubbery state at the glass transition temperature ((Tg)) [1].
- They are generally more transparent, as the disordered regions do not scatter light as effectively [60].
- They exhibit higher permeability, which can be advantageous for diffusion-controlled drug release but offers poor resistance to chemical penetrants [60].
Semi-crystalline polymers contain densely packed, ordered regions known as crystalline lamellae, dispersed within a continuous amorphous phase [1] [60]. This composite structure confers distinct properties:
- They display a well-defined melting point ((T_m)) where the crystalline regions disintegrate [1].
- The crystalline domains act as physical crosslinks, providing enhanced mechanical strength, stiffness, and chemical resistance, even above the material's (T_g) [60].
- They are typically opaque unless the crystallites are smaller than the wavelength of visible light [60].
Table 1: Comparative Properties of Amorphous and Semi-Crystalline Polymers in Drug Delivery
| Property | Amorphous Polymers | Semi-Crystalline Polymers |
|---|---|---|
| Chain Arrangement | Random, disordered | Ordered lamellae within a disordered matrix |
| Thermal Transition | Glass Transition Temperature ((T_g)) | Melting Point ((T_m)) |
| Optical Clarity | High transparency | Typically opaque or translucent |
| Chemical Resistance | Poor | Good |
| Permeability to Solutes | High | Low |
| Mechanical Strength | Lower, more formable | Higher, stiff and tough |
| Typical Drug Release Profile | Often faster, diffusion-driven | Slower, more controlled by crystal dissolution |
Implications for Drug Delivery System Design
The morphological structure of a polymer directly impacts its performance as a drug delivery vehicle. Amorphous polymers are often favored for their faster and more consistent drug release profiles, as the disordered regions facilitate easier diffusion of drug molecules. However, they may be prone to instability and a phenomenon known as "aging," where gradual structural relaxation can alter release kinetics over time [1].
Semi-crystalline polymers offer superior control over drug release. Active ingredients are predominantly housed and diffuse through the permeable amorphous regions, while the crystalline domains provide structural integrity and act as barrier sites, slowing down release. The degree of crystallinity becomes a critical parameter; a higher crystallinity typically results in a slower, more sustained release profile and better stability against the biological environment [60]. Furthermore, certain stimuli, such as temperature or enzymatic activity, can be designed to disrupt the crystalline order, triggering a burst of drug release [61].
Design and Synthesis of Stimuli-Responsive Polymer Systems
The creation of effective SRPs requires careful selection of monomers and synthesis strategies to incorporate recognitive elements that respond to specific triggers.
Synthesis Techniques for Tailored Architectures
Advanced polymerization techniques allow for precise control over the molecular architecture of SRPs, which in turn governs their self-assembly, drug loading capacity, and release mechanism [59].
- Controlled/Living Polymerization (e.g., RAFT): Methods like Reversible Addition-Fragmentation chain Transfer (RAFT) polymerization are indispensable for producing well-defined block and graft copolymers with narrow molecular weight distributions. This is crucial for creating reproducible and predictable stimulus-response behavior [62].
- Graft and Block Copolymerization: These strategies are used to create amphiphilic polymers that self-assemble into micelles or nanoparticles in aqueous environments. The hydrophobic core serves as a drug reservoir, while the hydrophilic shell provides steric stability. Stimuli-responsive segments can be incorporated into either block to trigger disassembly [59] [62].
- Functionalization Approaches: Post-polymerization modification is used to introduce specific responsive groups (e.g., pH-labile linkers, enzymatically cleavable peptides, or chromophores) onto a pre-formed polymer backbone [62].
- Green Synthesis Methods: There is a growing emphasis on developing SRPs using renewable feedstocks and green solvents, such as ionic liquids, to enhance the sustainability and biocompatibility of the resulting delivery systems [63].
Stimuli-Response Mechanisms and Material Selection
SRPs can be engineered to respond to a wide array of biological and external stimuli. The following table outlines key mechanisms and representative polymers for each category.
Table 2: Classification of Stimuli-Responsive Mechanisms and Materials
| Stimulus Type | Response Mechanism | Example Polymers & Systems | Application in Drug Delivery |
|---|---|---|---|
| pH | Protonation/deprotonation of ionic groups, cleavage of acid-labile bonds (e.g., hydrazone, acetal) | Poly(acrylic acid) (PAA), Chitosan, polymers with sulfonamide groups [59] | Targeted release in acidic tumor microenvironments (pH ~6.5-6.8) or endosomal/lysosomal compartments (pH 4.5-6.0) |
| Temperature | Change in chain hydration/solubility at LCST/UCST; alteration of crystalline/amorphous ratio | Poly(N-isopropylacrylamide) (PNIPAM), Pluronics, Poly(2-oxazoline)s [62] | Hyperthermia-triggered release; in-situ gelation upon injection for sustained release |
| Redox Potential | Cleavage of disulfide (-S-S-) linkages in the presence of high glutathione (GSH) concentrations | Disulfide-cross-linked micelles/dendrimers; polymers with thiol functionalization [59] | Intracellular drug release, exploiting the significant redox potential difference between the extracellular space and the cell cytoplasm |
| Enzymes | Cleavage of specific peptide or other sequences by overexpressed enzymes (e.g., MMPs, phosphatases) | Peptide-conjugated polymers; polysaccharide-based systems (e.g., dextran) [59] | Site-specific release in diseased tissues characterized by enzyme overexpression, such as tumor metastases or inflamed joints |
| Light | Photo-isomerization, photo-cleavage, or light-induced heating | Polymers incorporating azobenzene, o-nitrobenzyl, or spiropyran groups; gold nanoparticle composites [59] [64] | Spatiotemporally precise, on-demand release of therapeutics using non-invasive external light triggers |
Experimental Protocols for Synthesis and Characterization
This section provides detailed methodologies for key experiments in the development and analysis of SRP-based drug delivery systems.
Protocol: Synthesis of pH-Responsive Nanoparticles via RAFT Polymerization
This protocol describes the synthesis of a block copolymer nanoparticle designed for pH-triggered drug release in the tumor microenvironment [59] [62].
Objective: To synthesize and characterize poly(ethylene glycol)-b-poly(2-(diisopropylamino)ethyl methacrylate) (PEG-b-PDPA) nanoparticles, which self-assemble into micelles at neutral pH and disassemble in acidic conditions.
Materials:
- PEG Macro-CTA: Poly(ethylene glycol) macro-chain transfer agent.
- DPA Monomer: 2-(diisopropylamino)ethyl methacrylate.
- AIBN Initiator: 2,2'-Azobis(2-methylpropionitrile), recrystallized from methanol.
- Solvent: 1,4-Dioxane, anhydrous.
- Dialysis Membrane: MWCO 3.5 kDa.
Procedure:
- Polymerization: In a Schlenk flask, combine PEG Macro-CTA (1.0 equiv), DPA monomer (200 equiv), and AIBN (0.2 equiv) in anhydrous 1,4-dioxane to achieve a monomer concentration of 2 M. Degas the solution by performing three freeze-pump-thaw cycles. Seal the flask under an inert atmosphere and place it in an oil bath at 70 °C for 24 hours with constant stirring.
- Purification: After 24 hours, cool the reaction mixture to room temperature to terminate the polymerization. Precipitate the crude block copolymer into a 10-fold excess of cold n-hexane. Re-dissolve the precipitate in tetrahydrofuran (THF) and re-precipitate into cold n-hexane. Repeat this process twice. Dry the resulting white solid under vacuum overnight.
- Nanoparticle Formation: Dissolve the purified PEG-b-PDPA copolymer in dimethyl sulfoxide (DMSO) at a concentration of 10 mg/mL. Using a syringe pump, slowly add this solution (1 mL) to 10 mL of vigorously stirred phosphate-buffered saline (PBS, pH 7.4) over 1 hour. Allow the mixture to stir for an additional 4 hours. Transfer the solution to a dialysis membrane (MWCO 3.5 kDa) and dialyze against PBS (pH 7.4) for 48 hours to remove organic solvent and any unencapsulated material.
Characterization:
- Dynamic Light Scattering (DLS): Measure the hydrodynamic diameter and size distribution of the nanoparticles in PBS at pH 7.4 and pH 5.0. A significant increase in size or polydispersity at low pH indicates disassembly.
- Critical Micelle Concentration (CMC): Determine the CMC using a pyrene fluorescence probe method.
- Transmission Electron Microscopy (TEM): Image the nanoparticles (negative staining with uranyl acetate) to confirm spherical morphology and size.
Protocol: Investigating Crystallinity-Release Relationships
This experiment quantifies how the degree of crystallinity in a polymer matrix influences the release kinetics of a model drug [61] [60].
Objective: To fabricate polyvinyl alcohol (PVA) hydrogel films with varying crystallinity and monitor the release of a fluorescent dye.
Materials:
- Polymer: Polyvinyl alcohol (PVA, Mw ~89,000-98,000, >99% hydrolyzed).
- Cross-linker: Glutaraldehyde (GA, 25% aqueous solution).
- Catalyst: Hydrochloric acid (HCl, 1M).
- Model Drug: Fluorescein isothiocyanate–dextran (FITC-dextran, 20 kDa).
- Characterization Equipment: Differential Scanning Calorimeter (DSC), UV-Vis Spectrophotometer.
Procedure:
- Hydrogel Fabrication: Prepare a 10% w/v solution of PVA in deionized water by heating at 90°C with stirring until clear. Divide the solution into three parts.
- Sample A (Low Crystallinity): Add FITC-dextran (1 mg/mL), then add GA (0.5% v/v) and HCl (catalyst, 0.1% v/v). Cast into a film and allow to cross-link at room temperature for 6 hours.
- Sample B (Medium Crystallinity): Follow the same procedure as Sample A, but after cross-linking, anneal the film at 100°C for 30 minutes, followed by slow cooling.
- Sample C (High Crystallinity): Follow the same procedure as Sample A, but after cross-linking, anneal the film at 100°C for 2 hours, followed by quenching in an ice-water bath.
- Crystallinity Measurement: Cut sections from each film and analyze using DSC. The degree of crystallinity ((Xc)) can be calculated using the formula: (Xc (\%) = (\Delta Hf / \Delta Hf^0) \times 100), where (\Delta Hf) is the measured heat of fusion of the sample, and (\Delta Hf^0) is the heat of fusion for 100% crystalline PVA (138 J/g).
- Drug Release Study: Place each pre-weighed hydrogel film into a vial containing 50 mL of PBS (pH 7.4) at 37°C with gentle agitation. At predetermined time intervals, withdraw 1 mL of the release medium and replace it with fresh PBS. Analyze the concentration of released FITC-dextran using a UV-Vis spectrophotometer (measure absorbance at 490 nm).
Analysis:
- Plot cumulative release (%) versus time for each sample.
- Fit the release data to mathematical models (e.g., Higuchi, Korsmeyer-Peppas) to understand the release mechanism (e.g., Fickian diffusion, Case-II transport).
- Correlate the release rate constant and mechanism with the measured degree of crystallinity.
Visualization of Mechanisms and Workflows
Stimuli-Responsive Drug Release Mechanism
This diagram illustrates the core operational principle of a multi-stimuli-responsive nanoparticle for intelligent drug delivery, highlighting the role of morphological changes.
Experimental Workflow for SRP Development
This flowchart outlines a comprehensive research and development pipeline for creating and evaluating a novel stimuli-responsive polymer system for drug delivery.
The Scientist's Toolkit: Essential Research Reagents and Materials
The following table details key reagents, materials, and instrumentation essential for research and development in the field of stimuli-responsive polymers for intelligent delivery.
Table 3: Key Research Reagent Solutions for SRP Development
| Reagent/Material | Function/Application | Key Characteristics |
|---|---|---|
| N-Isopropylacrylamide (NIPAM) | Monomer for synthesizing temperature-responsive polymers (e.g., PNIPAM) with an LCST near physiological temperature [62]. | Enables fabrication of polymers that undergo a sharp phase transition in response to mild thermal stimuli. |
| RAFT Chain Transfer Agents | Mediates controlled radical polymerization to produce well-defined block copolymers with complex architectures [62]. | Crucial for achieving narrow polydispersity and predetermined molecular weights, ensuring reproducible stimulus-response. |
| Disulfide Cross-linkers (e.g., cystamine) | Introduces redox-sensitive linkages into polymer networks or core of nanoparticles for glutathione-mediated triggered release [59]. | Provides stability in circulation but allows rapid disassembly and drug release in the reductive intracellular environment. |
| Enzyme-Sensitive Peptides | Incorporated as cross-linkers or pendent groups to confer enzyme-specific degradation (e.g., by MMP-2 for tumor targeting) [59]. | Offers high specificity for disease sites where particular enzymes are overexpressed. |
| Schiff Base Precursors | Used to create dynamic covalent bonds in polymer networks, enabling pH-responsive behavior and self-healing properties [64]. | The imine bond is stable at neutral pH but cleaves in acidic environments, useful for both targeting and material robustness. |
| Differential Scanning Calorimeter (DSC) | Instrument for measuring thermal transitions (Tg, Tm, crystallinity) of polymers, linking structure to function [1] [60]. | Provides quantitative data on the degree of crystallinity, a critical parameter controlling drug release kinetics and mechanical properties. |
The strategic integration of stimuli-responsive and recognitive mechanisms into polymer systems marks a significant leap toward truly intelligent drug delivery. The journey from a conceptual smart material to a clinically viable delivery platform hinges on a deep understanding of polymer science fundamentals, particularly the critical role of amorphous and crystalline domains. By deliberately engineering the polymer's morphology and incorporating specific recognitive elements, researchers can exert precise control over the rate, location, and timing of drug release. Future progress in this field will be driven by the development of multi-stimuli-responsive systems, the adoption of sustainable and highly biocompatible polymers, and the seamless integration of advanced manufacturing techniques like 3D printing [15] [63]. As these technologies mature, stimuli-responsive and recognitive polymer systems are poised to redefine therapeutic paradigms, enabling unprecedented levels of precision and personalization in medicine.
The development of miniaturized bioelectronic devices represents a frontier in medical technology, requiring materials that can seamlessly integrate with biological systems. Within this context, the fundamental distinction between amorphous and crystalline polymer structures becomes critically important for designing next-generation biomedical interfaces. Hydrogels, with their highly hydrated, three-dimensional polymer networks, are predominantly amorphous materials that provide an ideal foundation for bioelectronics due to their structural similarity to native tissues [1] [65]. Unlike crystalline polymers with tightly packed, organized molecular chains that create rigid, opaque structures, the random, entangled chains of amorphous polymers enable the transparency, flexibility, and softness essential for biomedical applications [1] [66]. This amorphous architecture allows hydrogels to achieve a unique combination of properties, including tissue-like mechanical behavior, efficient transport of biomolecules, and excellent biocompatibility [65] [67].
The amorphous nature of hydrogels facilitates the incorporation of conductive elements—whether electronic conductors or ionic species—creating composite materials that bridge the gap between biological and electronic systems. While crystalline polymers like polyethylene and polypropylene offer superior chemical resistance and mechanical strength for structural applications, their organized molecular structure and hydrophobicity make them unsuitable for direct, conformable tissue interfaces [66]. In contrast, the loose, disordered network of amorphous hydrogels enables high water content, tunable elasticity, and porous structures that are suboptimal for traditional electronics but ideal for biointegration [1] [65]. This review explores how recent advances in materials science have leveraged these amorphous polymer characteristics to develop hydrogel-based bioelectronics with transformative potential for health monitoring, drug delivery, and tissue engineering.
Material Foundations: Conductivity in Amorphous Hydrogel Networks
The electrical functionality of hydrogel bioelectronics stems from strategic modifications to their inherently insulating amorphous polymer networks. Researchers have developed two primary approaches for imparting conductivity: incorporating electronically conductive materials or leveraging ionic transport mechanisms. The choice between these approaches depends on the specific application requirements, with each offering distinct advantages for different biomedical contexts [65].
Table 1: Comparison of Conductive Hydrogel Types
| Conductivity Type | Conductive Mechanism | Key Materials | Advantages | Limitations |
|---|---|---|---|---|
| Electronic Conduction | Electron transfer via conjugated structures or conductive fillers | PANI, PPy, PEDOT; CNTs, Graphene, MXene, Liquid Metal [65] | High environmental stability, Excellent conductivity [65] | Potential cytotoxicity, Complex fabrication [65] |
| Ionic Conduction | Ion mobility through porous hydrated network | LiCl, KOH, CaCl₂, various ionic liquids [65] | Biologically similar signal transmission, Excellent biocompatibility [65] | Lower conductivity, Sensitive to environmental conditions [65] |
The creation of electronically conductive hydrogels typically involves integrating conductive polymers with π-conjugated backbones (such as polyaniline (PANI), polypyrrole (PPy), or poly(3,4-ethylenedioxythiophene) (PEDOT)) into the hydrogel matrix [65]. These polymers can be copolymerized with the hydrogel network or polymerized in situ within a pre-formed hydrogel. For instance, Cong et al. developed a dual-network hydrogel using chitosan and polyacrylamide (PAAm) doped with PANI, where hydrogen bonding between networks maintained electrical conductivity even under extreme conditions [65]. Alternatively, carbon-based nanomaterials (carbon nanotubes, graphene) or metallic nanoparticles can be incorporated as conductive fillers, though their natural hydrophobicity often requires surface modifications or compatibilizers to prevent aggregation within the hydrophilic hydrogel network [65].
Ionically conductive hydrogels leverage the porous, hydrated structure of amorphous polymers to enable ion mobility similar to biological signal transmission systems. The most common method involves immersing hydrogels in conductive salt solutions, allowing ions to permeate the network. Ye et al. created an ionic hydrogel with conductivity up to 3.2 S/m at room temperature using polyvinyl alcohol (PVA) and cellulose nanofibers (CNF) through sol-gel synthesis [65]. More advanced approaches, such as the freezing cross-linking method developed by Liu et al., have achieved higher conductivity (5.2 S/m) by forming cluster network structures within PVA matrices [65]. Recent breakthroughs have demonstrated exceptionally high ionic conductivity (19.1-22.35 S/m) using poly(amidoxime)/polyethyleneimine (PAO/PEI) hydrogels with LiCl and KOH, where new ion channels and synergistic effects between metal ions and the polymer network significantly enhanced performance [65].
Experimental Protocols: Fabrication and Characterization Methodologies
Solvent Exchange Process for Hydrogel Semiconductors
A groundbreaking methodology for creating intrinsically conductive hydrogels has been developed by researchers at the UChicago Pritzker School of Molecular Engineering, addressing the fundamental incompatibility between traditional semiconductors (rigid, hydrophobic) and hydrogels (soft, hydrophilic) [67]. This protocol enables the fabrication of a single material that simultaneously exhibits both semiconducting properties and hydrogel characteristics.
Table 2: Key Reagents for Hydrogel Semiconductor Fabrication
| Research Reagent | Function | Application Notes |
|---|---|---|
| Polymer Semiconductors | Provide electronic functionality | Typically π-conjugated polymers; selection depends on desired electronic properties [67] |
| Water-Miscible Organic Solvent | Initial dissolution medium for semiconductors | Must be miscible with water to enable solvent exchange; tetrahydrofuran or dioxane often suitable [67] |
| Hydrogel Precursors | Form the cross-linked amorphous network | Typically hydrophilic polymers like PVA, PAAm, or naturally derived polymers [65] |
| Cross-linking Agents | Enable gelation of hydrogel precursors | Chemical or physical cross-linkers depending on application requirements [65] |
Experimental Workflow:
- Initial Dissolution: Dissolve polymer semiconductors in a water-miscible organic solvent at appropriate concentrations (typically 1-5% w/v) to create a homogeneous solution [67].
- Precursor Preparation: Prepare hydrogel precursors (e.g., 10-20% w/v polymer solution in deionized water) with appropriate cross-linking agents [67].
- Solvent Exchange: Combine the semiconductor solution with hydrogel precursors under controlled mixing conditions (typically 200-500 rpm for 1-2 hours at room temperature) to facilitate gradual solvent exchange [67].
- Gelation: Induce cross-linking through appropriate mechanisms (UV irradiation, thermal initiation, or chemical catalysts) based on the selected hydrogel chemistry [65].
- Equilibration: Transfer the formed hydrogel semiconductor to deionized water for 24-48 hours to remove residual organic solvent and achieve equilibrium swelling [67].
This method preserves the semiconducting functionality while creating a fully hydrated, tissue-like material that demonstrates enhanced biosensing response and stronger photo-modulation effects compared to traditional semiconductor-hydrogel composites [67].
Interpenetrating Network Hydrogels for Enhanced Performance
Another significant approach involves creating interpenetrating networks (IPNs) that combine multiple polymer systems to achieve superior mechanical and electrical properties. This methodology addresses the challenge of balancing conductivity with mechanical robustness in hydrogel bioelectronics [68].
Experimental Protocol:
- Network Formation: Synthesize the primary hydrogel network using standard cross-linking techniques (e.g., free radical polymerization of acrylamide monomers with N,N'-methylenebisacrylamide cross-linker) [65].
- Conductive Polymer Incorporation: Introduce conductive polymer precursors (e.g., pyrrole, aniline) into the swollen primary network. For electronic conductivity, immerse the hydrogel in a solution containing both the monomer and oxidizing agent (e.g., ammonium persulfate for pyrrole polymerization) [65].
- In Situ Polymerization: Initiate polymerization of the conductive component within the existing hydrogel network through thermal, chemical, or electrochemical means. For ionic conductivity, immerse the hydrogel in concentrated salt solutions (e.g., LiCl, CaCl₂) for 24-72 hours to achieve equilibrium [65].
- Mechanical Enhancement: Implement additional strategies such as dual-cross-linking (combining covalent and ionic cross-links) or nanocomposite incorporation (e.g., LAPONITE nanosheets, cellulose nanofibers) to improve mechanical durability [65].
The resulting materials exhibit excellent conductivity while maintaining softness and elasticity suitable for use as epidermal or implantable bioelectrodes [68].
Diagram Title: Hydrogel Bioelectronics Development Workflow
Device Applications and Performance Metrics
Hydrogel-based bioelectronics can be categorized based on their level of integration with the body, with each category presenting distinct design requirements and performance characteristics rooted in their amorphous polymer structure.
Table 3: Hydrogel Bioelectronic Device Categories and Performance
| Device Category | Key Applications | Material Requirements | Performance Metrics |
|---|---|---|---|
| Skin-Attachable | Motion sensors, Bioelectric monitoring, Biomolecular detection [65] | High adhesion, Moderate conductivity, Good mechanical matching to skin [65] | Conductivity: 0.1-5 S/m, Adhesion strength: 10-50 kPa, Stretchability: 100-500% strain [65] |
| Implantable | Pacemakers, Neural interfaces, Drug delivery systems [69] [67] | High biocompatibility, Tissue-like softness, Sustainable conductivity in physiological environment [69] | Young's modulus: 0.1-10 kPa (matching target tissue), Continuous operation: weeks to months, Reduced foreign body response [67] |
| Semi-Implantable | Peripheral nerve interfaces, Subcutaneous sensors [65] [69] | Balance between durability and biocompatibility, Controlled permeability [65] | Stable signal acquisition: >30 days, Biofouling resistance, Minimal inflammation [65] |
The amorphous structure of hydrogels is particularly advantageous for implantable applications, where their high water content and porous architecture enable efficient diffusion of nutrients and metabolic waste, reducing foreign body responses and improving long-term stability [67]. Recent advances in piezoelectric hydrogels (PHs) have further expanded application possibilities by enabling self-powered devices that harvest biomechanical energy from physiological processes such as heartbeat, respiration, and muscle movement [69]. These materials combine the mechanical adaptability of amorphous hydrogel networks with the energy conversion capabilities of piezoelectric materials, creating new paradigms for implantable electronics that don't require external power sources [69].
For neural interfaces, hydrogel-based electrodes significantly reduce the mechanical mismatch between traditional electrodes (Young's modulus ~GPa) and neural tissue (Young's modulus ~kPa), minimizing inflammation and improving signal fidelity [65]. Similarly, in cardiac applications, hydrogel-based pacemakers can conform to the dynamic, curved surface of the heart, maintaining stable contact during muscle contraction without causing tissue damage [67]. The amorphous, hydrated structure also enables enhanced biosensing capabilities by allowing biomarkers to diffuse into the sensing region, significantly increasing interaction sites and improving detection sensitivity compared to conventional sensors [67].
The development of hydrogel-based bioelectronics represents a paradigm shift in how we interface electronic devices with biological systems, largely enabled by the unique properties of amorphous polymer networks. Unlike their crystalline counterparts with rigid, organized structures, amorphous hydrogels provide the tissue-like mechanical properties, hydration, and molecular permeability essential for successful biointegration. Recent breakthroughs in material design—particularly the creation of unified hydrogel semiconductors and sophisticated interpenetrating networks—have overcome historical challenges in combining conductivity with softness and stretchability.
Looking forward, several key challenges and opportunities will shape the next generation of hydrogel bioelectronics. First, achieving long-term stability and consistent performance in physiological environments remains a significant hurdle, as hydrogel properties can evolve through swelling, degradation, or biofouling. Second, standardized in vivo evaluation protocols are needed to better predict clinical performance and accelerate translation from laboratory to clinic [69]. Third, the development of sophisticated manufacturing techniques will be crucial for creating complex, multi-functional devices with spatially controlled properties. Finally, advancing our fundamental understanding of structure-property relationships in these complex amorphous materials will enable more rational design strategies.
As research progresses, hydrogel bioelectronics are poised to transform numerous medical fields, from continuous health monitoring and targeted drug delivery to advanced neural interfaces and tissue engineering. By embracing the unique advantages of amorphous polymer structures while addressing current limitations, scientists and engineers can create increasingly sophisticated biointegrated devices that blur the distinction between biology and technology, ultimately leading to more effective and seamless healthcare solutions.
Navigating Material Selection and Processing Challenges in Pharmaceutical Development
The selection of a polymeric carrier is a critical determinant in the success of solid dispersion formulations, influencing not only the physical stability of the drug but also its dissolution profile and ultimate bioavailability. This choice fundamentally hinges on the polymer's molecular architecture—specifically, whether it is amorphous or semi-crystalline. Within the context of modern pharmaceutical development, where nearly 90% of new active pharmaceutical ingredients (APIs) exhibit poor aqueous solubility, the role of the polymer extends beyond that of a mere inert matrix to an active stabilizer and release modulator [70]. Amorphous solid dispersions (ASDs) leverage high-energy, non-crystalline APIs to achieve superior solubility, yet their inherent thermodynamic instability necessitates a polymeric carrier that can effectively inhibit recrystallization [70] [71]. The dichotomy between amorphous and semi-crystalline polymers presents formulators with a strategic trade-off: amorphous polymers often excel at molecular-level stabilization through vitrification and specific drug-polymer interactions, while semi-crystalline polymers can provide superior long-term structural integrity and controlled release due to their ordered domains [72] [73]. This technical guide provides an in-depth analysis of these material classes, their properties, and their implications for drug formulation, supported by contemporary research and experimental data.
Fundamental Polymer Structures in Pharmaceuticals
Amorphous Polymers
Amorphous polymers are characterized by a random arrangement of polymer chains lacking long-range molecular order. This disordered structure results in a glass transition temperature (Tg), a critical physical property where the polymer transitions from a hard, glassy state to a soft, rubbery state. In the glassy state, molecular mobility is significantly restricted, which helps to trap the API in its amorphous form and prevent crystallization. Above the Tg, increased chain mobility can lead to phase separation and drug crystallization, compromising formulation stability [70] [74]. The absence of crystalline regions allows for faster water penetration and polymer dissolution, which is beneficial for rapid drug release. Common amorphous polymers used in ASDs include polyvinylpyrrolidone (PVP), hydroxypropyl methylcellulose (HPMC), and poly(acrylic acid) derivatives, all of which stabilize amorphous APIs through molecular mixing and hydrogen bonding [70] [71] [74].
Semi-Crystalline Polymers
Semi-crystalline polymers possess a heterogeneous structure comprising both ordered crystalline regions and disordered amorphous domains. The crystalline domains act as physical cross-links, imparting mechanical strength, reducing solubility, and slowing down water penetration and polymer erosion. The degree of crystallinity directly influences key properties such as degradation rate, drug diffusion, and release kinetics [73]. Polycaprolactone (PCL), for instance, is a semi-crystalline polymer with a crystallinity of 20-33% and a very low Tg (approximately -60°C), resulting in a flexible material with a slow degradation profile that can extend to years [73]. Polylactic acid (PLA), another prominent example, can vary from highly crystalline to entirely amorphous depending on the ratio of its D- and L-isomers, allowing for tailored release periods from days to months [73] [40].
Diagram 1: A decision pathway for selecting polymers based on primary formulation goals, linking objectives to specific polymer properties and common examples.
Material Properties and Performance Characteristics
The thermal, mechanical, and degradation properties of polymers directly govern their performance in drug delivery systems. The following table summarizes key characteristics of representative amorphous and semi-crystalline polymers.
Table 1: Properties of Representative Amorphous and Semi-Crystalline Pharmaceutical Polymers
| Polymer | Structure Type | Glass Transition (Tg) | Key Characteristics | Typical Drug Release Profile | Stabilization Mechanism |
|---|---|---|---|---|---|
| PVP [74] | Amorphous | ~150-180°C | Highly hydrophilic, hygroscopic; can absorb ~28% water. | Rapid dissolution; potential for spring-and-parachute. | Vitrification; hydrogen bonding. |
| HPMCAS [75] | Amorphous | ~120°C | pH-dependent solubility; dissolves at intestinal pH. | Limited gastric release; enhanced intestinal release. | Hydrophobic interaction; ionic interaction for basic drugs. |
| PAA [71] | Amorphous | Varies with MW | High acidic group density; forms salts with basic drugs. | High apparent solubility via nanoparticle release. | Ionic interaction; molecular encapsulation. |
| PCL [73] | Semi-Crystalline | ~ -60°C | Slow degradation (months to years); highly hydrophobic. | Sustained release over extended periods. | Crystalline domains act as diffusion barriers. |
| PLA [73] [40] | Semi-Crystalline | ~60°C | Crystallinity and degradation rate depend on D/L isomer ratio. | Tunable from days to months. | Crystallinity controls water ingress and erosion. |
| PLGA [73] | Amorphous to Semi-Crystalline | 40-60°C | Degradation rate fastest at 50:50 LA:GA ratio. | Precisely controlled by LA:GA ratio. | Copolymer composition dictates hydrophilicity and degradation. |
The degradation mechanism is a pivotal differentiator between polymer classes. Amorphous polymers like PVP and HPMCAS do not erode in a classical sense but dissolve upon contact with aqueous media, potentially generating a supersaturated drug solution [70] [75]. In contrast, semi-crystalline polymers such as PCL, PLA, and PLGA degrade primarily through hydrolysis of their ester bonds in the amorphous regions, with the crystalline zones remaining intact longer, leading to a more controlled and sustained release profile [73]. This degradation directly impacts drug release kinetics; for instance, high crystallinity in PCL suppresses the initial burst release and enables near-zero-order release kinetics, while the tunable amorphousness of PLGA allows for precise release profile design [73].
Experimental Protocols for Polymer Evaluation and ASD Development
Pre-formulation Screening: Miscibility and Interaction Assessment
Successful ASD development begins with rational polymer selection based on drug-polymer miscibility.
- Hansen Solubility Parameter (HSP) Calculation: This theoretical method predicts miscibility by comparing the total (δT) and partial (δD, δP, δH) solubility parameters of the drug and polymer. Components with similar HSP values (typically < 7 MPa¹/² difference) are likely miscible. The HSP is calculated using the group contribution method: δT² = δD² + δP² + δH² [76].
- Film Casting: This experimental technique validates theoretical predictions. The drug and polymer are dissolved in a common volatile solvent at various ratios (e.g., 1:1, 1:2, 2:1) and cast into a thin film. A transparent, homogeneous film indicates good miscibility and solubilization capacity, while an opaque film suggests phase separation. The film can be re-dissolved and inspected to assess the polymer's ability to inhibit API recrystallization [76].
- Molecular Modeling: Computational studies using software like the Schrodinger Material Science Suite can model and optimize the chemical structures of the drug and polymer. These simulations predict favorable interaction energies and the potential for complex formation, correlating with the formation of a stable ASD and enhanced dissolution performance [76].
ASD Manufacturing: Hot Melt Extrusion (HME) and Spray Drying
Two primary manufacturing techniques for ASDs are Hot Melt Extrusion (HME) and Spray Drying (SD).
- Hot Melt Extrusion (HME): A solvent-free, continuous process. The API and polymer are fed into an extruder barrel equipped with rotating twin screws and multiple heating zones. The combination of heat and shear forces melts and homogeneously mixes the components, which are then extruded through a die to form a filament. HME is favored for its scalability, content uniformity, and absence of residual solvents [76] [40]. Process parameters include temperature profile along the barrel, screw speed, and feed rate.
- Spray Drying (SD): A solvent-based process. The API and polymer are dissolved in a common organic solvent (e.g., dichloromethane, methanol). The solution is atomized into a hot drying chamber, where rapid solvent evaporation produces solid, spherical ASD particles with a high surface area. SD is suitable for heat-sensitive compounds but requires solvent handling and removal [76]. Critical parameters include inlet/outlet temperature, feed flow rate, and atomization pressure.
Comprehensive Characterization of the Final ASD
A multifaceted analytical approach is essential to confirm the formation of a successful ASD and predict its performance.
- Solid-State Analysis: Powder X-ray Diffraction (PXRD) is used to confirm the absence of crystalline drug peaks, verifying the amorphous nature of the dispersion. Differential Scanning Calorimetry (DSC) detects the glass transition temperature (Tg) of the ASD; a single, composition-dependent Tg indicates a homogeneous, single-phase system [76] [40] [75].
- Drug-Polymer Interaction Analysis: Attenuated Total Reflectance Fourier-Transform Infrared Spectroscopy (ATR-FTIR) can identify specific molecular interactions, such as hydrogen bonding or ionic interactions, evidenced by shifts in characteristic absorption bands [76] [71].
- Morphological and Performance Characterization: Scanning Electron Microscopy (SEM) visualizes particle surface morphology and, after dissolution studies, can reveal the porous structure of the remaining polymer matrix [40]. Dissolution testing under non-sink conditions in physiologically relevant media (e.g., FaSSGF, FaSSIF) evaluates the formulation's ability to generate and maintain supersaturation [75] [74]. Dynamic Light Scattering (DLS) is employed to detect and size drug-rich nanoparticles that may form during dissolution, contributing to the apparent solubility [71].
Diagram 2: The comprehensive experimental workflow for developing and evaluating amorphous solid dispersions, from pre-formulation screening to performance testing.
The Scientist's Toolkit: Key Research Reagent Solutions
Table 2: Essential Materials and Reagents for ASD Research and Development
| Reagent / Material | Function / Application | Representative Examples |
|---|---|---|
| Synthetic Polymers | Carrier matrix for ASDs; provide stability and modulate release. | PVP [74], PVP/VA [71], Soluplus [76], Eudragit EPO [76]. |
| Natural & Semi-Synthetic Polymers | Biocompatible, biodegradable carriers; often with inherent functionality. | Chitosan [70], Alginate [70], HPMC (e.g., Methocel E5) [75], HPMCAS (e.g., AQOAT) [76] [75]. |
| Biodegradable Polyesters | For sustained-release and implantable formulations; degrade into safe metabolites. | PCL [73], PLA [73] [40], PLGA [73]. |
| Cyclodextrins | Oligosaccharides that form inclusion complexes; enhance stability and solubility. | β-CD, γ-CD, HP-β-CD [70] [77]. |
| Acidic Polymers | Can form ionic salts with basic drugs, enhancing physical stability. | Poly(Acrylic Acid) - PAA [71], HPMCP, CAP [71]. |
| Surfactants | Improve wettability and inhibit crystallization during dissolution. | Sodium Lauryl Sulfate (SLS) [74], Polysorbate 80 [76]. |
| Biorelevant Media | Simulate gastrointestinal fluids for predictive dissolution testing. | FaSSGF, FaSSIF, FeSSIF-V2 [75]. |
| Plasticizers | Reduce processing temperature in HME by lowering polymer Tg. | Triethyl Citrate [76], Polyethylene Glycol (PEG) [76]. |
Advanced Formulation Strategies and Case Studies
Leveraging Polymer Blends and Phase Separation
Advanced formulations are moving beyond single-polymer systems. Research demonstrates that intentionally engineered phase-separated polymer blends can be harnessed for controlled drug release. A study combining hydrophobic PLA with hydrophilic HPMC resulted in a matrix where the HPMC phase acts as a channeling agent. Upon contact with dissolution media, the HPMC dissolves and swells, creating a porous network through which the drug is released. The connectivity and tortuosity of this network, dictated by the PLA/HPMC ratio (e.g., 30/70, 50/50, 70/30), directly control the release rate, enabling profiles ranging from rapid release to an extended, nearly linear release over 6 hours [40].
The Impact of Chirality and Polymer Selection
The case study of Praziquantel (PZQ) highlights the nuanced interplay between API properties and polymer functionality. ASDs of the active (R)-PZQ enantiomer were prepared with both HPMCAS and HPMC. HPMCAS-based ASDs showed poor release at gastric pH but achieved near-complete release at intestinal pH, effectively inhibiting crystallization. In contrast, HPMC-based ASDs exhibited faster gastric release but reduced stability due to crystallization. This underscores how a polymer's pH-dependent solubility profile (HPMCAS vs. HPMC) must be matched to the API's properties and the physiological target for release [75].
Performance at High Drug Loading
A critical challenge is maintaining good release performance at high drug loading. A comparative study of Lumefantrine (LMF) in 10 different polymers revealed that poly(acrylic acid) (PAA) significantly outperformed others, even at 50% drug loading. While a neutral polymer like PVPVA showed good release at 25% loading but virtually none at 50%, PAA facilitated the release of LMF as stable, sub-micron drug-rich nanoparticles. This mechanism results in a high apparent solubility without conflicting with the thermodynamic stability of the formulation, demonstrating that the release mechanism (nanoparticle-based vs. molecular dissolution) is as critical as the stability itself [71].
The selection between amorphous and semi-crystalline polymers is a foundational decision that dictates the stability, release profile, and clinical applicability of a solid dispersion formulation. Amorphous polymers, with their capacity for molecular-level interactions and rapid dissolution, are often the default choice for overcoming solubility barriers of BCS Class II drugs. Semi-crystalline polymers, offering mechanical robustness and predictable, extended release, provide powerful alternatives for long-acting therapies. Contemporary research illuminates a path beyond this simple binary, advocating for sophisticated strategies such as engineered phase separation in polymer blends and the selection of polymers that enable novel release mechanisms like nanoparticle formation. The future of polymer selection lies in a holistic, API-centric approach that integrates computational prediction, robust characterization, and a deep understanding of the complex interplay between polymer structure, API properties, and the physiological environment to design precise and effective drug delivery solutions.
The classification of polymers into amorphous and crystalline states is a cornerstone of materials science, directly dictating the processing behavior and final properties of plastic products. Unlike small molecules, polymers are rarely entirely crystalline; they more commonly exist in a semi-crystalline state, featuring both ordered crystalline regions and disordered amorphous areas [1]. This morphological characteristic is paramount, as the degree of crystallinity influences virtually all material properties, including mechanical strength, thermal resistance, chemical stability, and, critically for processing, dimensional stability and shrinkage [1] [3]. For researchers and scientists, particularly in fields like drug development where precision is critical, mastering the control of crystallization is not merely beneficial—it is essential for overcoming significant processing hurdles such as unpredictable shrinkage, warpage, and the formation of undesirable polymorphs.
This whitepaper provides an in-depth technical guide framed within the broader context of amorphous versus crystalline polymer research. It synthesizes fundamental principles with advanced characterization techniques and contemporary experimental protocols to equip professionals with the knowledge to predict, measure, and control crystallization and its effects during processing.
Theoretical Foundation: Amorphous vs. Semi-Crystalline Polymers
Structural and Thermal Characteristics
At the molecular level, the distinction between amorphous and semi-crystalline polymers is defined by the arrangement of their long-chain molecules.
Amorphous Polymers: These materials possess chains that are arranged in a random, loose structure with no long-range order, often described as a "chain entanglement" akin to a pile of cooked spaghetti [1]. This lack of order means they do not have a true melting point. Instead, they undergo a gradual transition from a hard, glassy state to a soft, rubbery state upon heating, characterized by the glass transition temperature (Tg). Below the Tg, chain motion is frozen; above it, small-scale chain movements are possible [1]. This leads to properties like transparency, flexibility, and relatively low shrinkage during cooling [3].
Semi-Crystalline Polymers: These polymers contain regions where the molecular chains are folded into orderly, stacked structures known as lamellae, creating a highly ordered, repeating pattern [1]. These crystalline zones coexist with amorphous regions. The proportion of crystalline material is quantified by the degree of crystallinity. These materials exhibit a distinct melting point (Tm), at which the orderly lamellae structure transitions to a disordered melt [1]. The coexistence of ordered and disordered regions results in high mechanical strength, chemical resistance, and greater, more complex shrinkage behavior due to the densification during crystallization [3].
The Direct Link Between Crystallization and Shrinkage
Shrinkage during the cooling of polymers is governed by two primary mechanisms:
- Thermal Shrinkage: This is universal to all materials and is caused by the reduction in molecular kinetic energy and vibrational space as temperature decreases. It is described by the polymer's coefficient of thermal expansion/contraction [78].
- Crystalline Shrinkage: This is specific to semi-crystalline polymers and is the dominant factor in their overall shrinkage. When processed, these polymers are heated above their Tm, becoming entirely amorphous. During cooling, the chains reorganize into densely packed crystalline structures. This transition from a disordered melt to an ordered crystal results in a significant increase in density and a correspondingly large volumetric shrinkage [78].
Table 1: Comparative Shrinkage Behavior of Polymer Types
| Polymer Type | Primary Shrinkage Mechanism | Typical Shrinkage Magnitude (m/m) | Shrinkage Timeline | Key Influencing Factors |
|---|---|---|---|---|
| Amorphous (e.g., PMMA, PVC) | Thermal contraction [78] | 0.001 – 0.005 [78] | 90-95% complete immediately; 100% within 3-4 hours [78] | Coefficient of thermal expansion, cooling rate [78] |
| Semi-Crystalline (e.g., HDPE, PP) | Crystallization + Thermal contraction [78] | 0.010 – 0.025 (PP) [78] | 85% in 24 hours; 98% in a week; full equilibrium over months [78] | Cooling rate, nucleation density, temperature profile between Tg and Tm [78] |
The data for HDPE is particularly illustrative: its melt density is 0.74 g/cm³, while the final product density is 0.94 g/cm³, resulting in a substantial 27% crystalline shrinkage [78]. Furthermore, the kinetics of crystallization are slow and temperature-dependent. The fastest rate of crystallization occurs midway between the Tg and Tm [78]. For a polymer like HDPE with a Tg of -125°C and a Tm of 135°C, crystallization can continue slowly even at room temperature over extended periods, leading to post-molding dimensional changes and the potential for warpage and internal stresses [78].
Advanced Characterization and Experimental Protocols
Modern Techniques for Analyzing Crystallization
Understanding and controlling crystallization requires sophisticated tools capable of probing structure and kinetics at the nanoscale. While traditional methods like Differential Scanning Calorimetry (DSC) and X-ray Diffraction (XRD) provide bulk information on crystallinity and melting behavior, Atomic Force Microscopy (AFM) has emerged as a powerful technique for direct, nanoscale visualization.
Table 2: Techniques for Characterizing Polymer Crystallization
| Characterization Method | Crystallographic Information Obtained | Key Advantages | Key Limitations |
|---|---|---|---|
| Differential Scanning Calorimetry (DSC) | Crystallinity, melting/crystallization enthalpy & temperature [79] | Highly automated, quantitative thermal data [79] | Bulk measurement only, no spatial information [79] |
| X-Ray Diffraction (XRD) | Crystallinity, crystal form, orientation [79] | Non-destructive, high sensitivity to crystal structure [79] | Low spatial resolution [79] |
| Atomic Force Microscopy (AFM) | Hierarchical crystal morphology, physical properties (modulus), in-situ kinetics [79] | High spatial resolution (nanometer), minimal sample prep, can be used in various environments, near-non-destructive [79] | Slow scanning speed, requires operational expertise [79] |
AFM excels in visualizing hierarchical polymer crystal structures such as spherulites, dendritic crystals, and shish-kebab crystals that arise under flow conditions [79]. Its capability for in-situ monitoring allows researchers to track the real-time growth of crystals, providing direct data to validate and supplement crystallization kinetics theories [79]. Furthermore, functionalized AFM modes like PeakForce Tapping can map nanomechanical properties, establishing direct structure-property relationships by correlating crystalline domains with local modulus [79].
Experimental Workflow for Crystallization Control
The following diagram outlines a generalized experimental workflow for investigating and controlling polymer crystallization, integrating the characterization techniques discussed.
Detailed Experimental Protocols
Protocol 1: In-Situ AFM Monitoring of Crystal Growth
Objective: To visualize and quantify the real-time growth kinetics of polymer crystals in a thin film under isothermal conditions [79].
Research Reagent Solutions:
Table 3: Key Reagents and Materials for AFM Crystallization Studies
| Item | Function/Description | Experimental Consideration |
|---|---|---|
| Polymer Sample | The material under investigation (e.g., PEEK, PVDF, Polypropylene). | Select based on Tg and Tm. Must be processable into a thin film for AFM [79]. |
| AFM with Hot Stage | Provides nanoscale imaging and precise temperature control. | Essential for in-situ experiments. Tapping mode is preferred for soft samples to avoid damage [79]. |
| Solvent (if applicable) | e.g., Chloroform, Toluene. For preparing polymer thin films via spin-coating or solution-casting. | Must be high purity and chemically compatible with the polymer. |
| Quenching Medium | e.g., Liquid Nitrogen, cold plate. To rapidly freeze the molten polymer into an amorphous state. | Enables the study of crystallization from a well-defined initial state [78]. |
Methodology:
- Sample Preparation: Prepare a thin polymer film (e.g., 100-500 nm thickness) on a clean substrate (e.g., silicon wafer) via spin-coating or melt-pressing [79].
- Amorphization: Place the sample on the AFM hot stage. Heat it to a temperature ~30°C above its Tm for 5 minutes to erase thermal history and destroy any existing crystalline structures.
- Rapid Quenching: Rapidly cool the sample to the desired isothermal crystallization temperature (Tx), which is selected to be between the polymer's Tg and Tm.
- In-Situ Imaging: Immediately engage the AFM tip and begin scanning in tapping mode to monitor the nucleation and growth of crystals in real-time [79]. Capture images of the same area at regular time intervals.
- Data Analysis: Analyze the image sequence to measure crystal growth rates, nucleation density, and final morphology. Parameters like spherulite radius can be plotted against time to determine linear growth rates.
Protocol 2: Multi-Temperature 3D Printing for Multi-Material Properties
Objective: To fabricate a single 3D-printed part with spatially controlled amorphous and semi-crystalline regions from a single feedstock, enabling localized property differentiation [15].
Research Reagent Solutions:
Table 4: Key Reagents for Multi-Temperature 3D Printing
| Item | Function/Description | Experimental Consideration |
|---|---|---|
| Liquid Crystalline (LC) Monomer | e.g., BPLC (smectic X phase, Tm=77°C, Tiso=111°C). The primary building block [15]. | Its phase behavior is the foundation of the property differentiation. |
| Trifunctional Thiol Crosslinker | Forms the polymer network with the LC monomer via thiol-ene photopolymerization [15]. | Creates a uniform network that can trap the LC order. |
| Photoinitiator | A compound that generates radicals upon light exposure to initiate polymerization. | Must have an absorption spectrum matching the printer's light source. |
| Digital Light Processing (DLP) Printer | A vat photopolymerization 3D printer with a heated vat and precise light intensity control [15]. | The heated vat is critical for controlling the monomer's phase before polymerization. |
Methodology:
- Resin Formulation: Prepare a homogenous resin mixture containing the LC monomer, trifunctional thiol crosslinker, and photoinitiator.
- Printing Parameter Mapping: Define the digital design, assigning specific printing parameters to different voxels or regions:
- For Stiff, Opaque (Semi-Crystalline) Regions: Set the printing temperature (e.g., 80°C) to be within the monomer's LC phase. Polymerization from this state "traps" the ordered structure, resulting in a semi-crystalline network with high stiffness and opacity [15].
- For Soft, Transparent (Amorphous) Regions: Set the printing temperature (e.g., >95°C) to be above the monomer's isotropic transition temperature (Tiso). Polymerization from this disordered state results in an amorphous network with softer, more flexible properties and higher transparency [15].
- Multi-Material Printing: Execute the print job. The printer's software and hardware must be capable of varying the vat temperature and potentially light intensity in sync with the layer-by-layer printing process.
- Post-Processing and Validation: Gently clean the printed part. Validate the property differentiation using techniques like micro-indentation (for mechanical properties) and optical microscopy or AFM (for morphology and structure).
The journey to overcoming processing hurdles related to crystallization and shrinkage is a multifaceted challenge that requires a deep understanding of polymer morphology. The fundamental distinction between amorphous and semi-crystalline polymers dictates a divide in their thermal behavior, shrinkage mechanisms, and ultimate dimensional stability. For researchers, leveraging advanced characterization tools like AFM provides the nanoscale insight necessary to decode crystallization kinetics and morphology. Furthermore, innovative processing strategies, such as multi-temperature 3D printing, demonstrate a paradigm shift towards actively controlling crystallinity to design material properties in-situ. As these techniques continue to evolve, they promise to unlock new frontiers in the manufacturing of high-performance, dimensionally stable polymer components for demanding applications across pharmaceuticals, aerospace, and advanced engineering.
The performance and longevity of polymeric materials in research and development are critically dependent on their stability against environmental factors, with moisture and chemical exposure representing two of the most significant challenges. The fundamental behavior of polymers when confronted with these stressors is intrinsically governed by their molecular architecture—specifically, the distinction between amorphous and crystalline morphologies. For researchers, scientists, and drug development professionals, understanding this structure-property relationship is not merely academic but a practical necessity for selecting appropriate materials, designing stable formulations, and predicting product lifecycle performance.
Polymer morphology describes the arrangement of molecular chains, which can range from a state of long-range order to one of complete disorder [1]. This spectrum of order directly dictates how a polymer interacts with its environment. Crystalline polymers exhibit regions where chains are packed tightly in an orderly, repeating pattern, while amorphous polymers possess a loose, random, and entangled chain structure with no long-range order [1]. Most high-performance polymers are semi-crystalline, containing a mixture of both crystalline and amorphous regions [60]. The ratio of these regions, known as the degree of crystallinity, is a primary factor determining a polymer's susceptibility to degradation via moisture ingress and chemical attack [1].
Fundamental Mechanisms of Interaction
Moisture Sorption in Polymers
Moisture absorption occurs as water molecules diffuse into the polymer structure. The rate and extent of this absorption are heavily influenced by the polymer's morphology. Water molecules penetrate more readily through the disordered, open structure of amorphous regions compared to the tightly packed crystalline zones [80]. In amorphous polymers, the loose structure allows for greater free volume, facilitating the ingress and mobility of water molecules.
The absorbed water exists in different states within the polymer matrix [80]:
- Free Water: Occupies void spaces and is relatively easily removed.
- Freezing-Bound Water (Intermediate Water): Partially bound to the polymer structure.
- Non-Freezing Water (Non-Freezing-Bound Water): Tightly bound to polar groups on the polymer chains via hydrogen bonding.
The presence of moisture, particularly in amorphous regions, can act as a potent plasticizer. This plasticization effect reduces the glass transition temperature (Tg) of the polymer, a phenomenon extensively documented in pharmaceutical research. For instance, moisture sorption by amorphous polymers like polyvinylpyrrolidone (PVP) leads to a drastic decrease in Tg, which can subsequently compromise the physical stability of amorphous solid dispersions (ASDs) and promote crystallization of the active pharmaceutical ingredient (API) [81].
Chemical Resistance and Degradation
Chemical resistance is the ability of a polymer to resist attack from chemicals, maintaining its physical and mechanical properties over time [82]. The mechanism of attack can involve solvent penetration, swelling, cracking, or chemical reaction with the polymer chains.
Crystallinity is a key defender against chemical assault. The dense, ordered packing of chains in crystalline regions creates a barrier that hinders the penetration of solvents and corrosive agents [60] [3]. As a result, semi-crystalline polymers generally exhibit superior chemical resistance compared to their amorphous counterparts. Polymers are more readily attacked by corrosives at temperatures above their Tg, where chain mobility increases significantly [82]. Chemical resistance is enhanced by crystallization, fillers, and cross-links, but is reduced by the presence of plasticizers or contact with compatible solvents [82].
Diagram: Molecular Pathways of Moisture and Chemical Interaction in Polymers
Quantitative Comparison of Material Properties
The theoretical mechanisms of interaction translate directly into measurable differences in material performance. The following tables summarize key property differences relevant to stability and degradation.
Table 1: Comparative Properties of Amorphous and Semi-Crystalline Polymers [1] [60] [3]
| Property | Amorphous Polymers | Semi-Crystalline Polymers |
|---|---|---|
| Molecular Structure | Random, disordered chains [1] | Ordered crystalline regions dispersed in amorphous matrix [60] |
| Density | Lower [3] | Higher (crystalline regions are denser) [60] |
| Thermal Transition | Glass transition temperature (Tg) only [1] | Distinct melting point (Tm) and Tg [1] |
| Moisture Absorption | Higher (more permeable) [81] [80] | Lower (crystalline regions act as barriers) [80] |
| Chemical Resistance | Generally poor to moderate [60] [3] | Generally good to excellent [60] [3] |
| Optical Clarity | Often transparent [60] | Usually opaque or translucent [60] |
| Dimensional Stability | Lower, prone to swelling [80] | Higher, reduced swelling [80] |
| Post-Processing Shrinkage | Minimal [3] | Greater (due to crystallization) [3] |
Table 2: Moisture Absorption and Chemical Resistance of Common Polymers
| Polymer | Type | Moisture Absorption (%) | Key Chemical Resistance Attributes |
|---|---|---|---|
| PEEK | Semi-crystalline | Very Low (~0.1-0.5%) [80] | Excellent resistance to a wide range of chemicals, oils, and solvents [60] [3] |
| PTFE | Semi-crystalline | Extremely Low (≈0%) [80] | Inert to most chemicals; exceptional solvent resistance [3] |
| Nylon (Unfilled) | Semi-crystalline | High (up to 4-8%) [80] | Good resistance to hydrocarbons, but poor to strong acids/bases [82] |
| PVP | Amorphous | Very High (can exceed 25-45% at high RH) [81] | Hygroscopic; chemical stability can be compromised by moisture [81] |
| Polypropylene (PP) | Semi-crystalline | Low (<0.03%) [82] | Resistant to most acids, bases, and solvents [82] |
| PVC | Amorphous | Low | Good resistance to acids, bases, salts; variable with plasticizer [82] |
| Polyethylene (HDPE) | Semi-crystalline | Very Low | Excellent resistance to strong acids and bases; not resistant to strong oxidizing agents [82] |
Experimental Protocols for Stability Assessment
Robust experimental assessment is crucial for predicting long-term polymer stability. Standardized methodologies exist for quantifying moisture uptake and chemical resistance.
Moisture Sorption Analysis
Objective: To determine the equilibrium moisture content of a polymer under specific humidity conditions and its effect on the glass transition temperature [81] [80].
Workflow:
Diagram: Moisture Sorption and Tg Analysis Workflow
Methodology Details:
- Sample Preparation: Specimens are dried to a constant weight in an oven and then cooled in a desiccator. For aerospace and plastics testing, standards like ASTM D570 or ISO 62 are often followed, which specify specimen dimensions (e.g., 60 mm x 60 mm x 1 mm) [80].
- Conditioning: Samples are exposed to a controlled humidity environment. This can be achieved using desiccators with saturated salt solutions or, more precisely, using automated dynamic vapor sorption (DVS) instruments. These analyzers allow for precise control of relative humidity (RH) and temperature, using milligram quantities of material [81].
- Gravimetric Analysis: The sample is weighed periodically until equilibrium moisture uptake is reached. The percentage moisture absorption is calculated using the formula [80]:
- Percent Water Absorption = [(Wet weight – Dry weight) / Dry weight] x 100
- Thermal Analysis: The glass transition temperature (Tg) of both the dry and moisture-conditioned samples is measured using Differential Scanning Calorimetry (DSC). The plasticizing effect of water is observed as a depression in Tg [81].
Chemical Resistance Testing
Objective: To evaluate the resistance of plastics to chemical reagents by assessing changes in mechanical properties, mass, and dimensions after exposure [82].
Workflow:
Diagram: Chemical Resistance Testing Workflow
Methodology Details:
- Pre-Exposure Characterization: Key properties of the test specimen are measured before exposure. This includes mass, volume, dimensions, and mechanical properties such as tensile strength, elongation at break, and hardness [82].
- Immersion Exposure: Specimens are fully immersed in the test chemical reagent for a specified duration and temperature. The test conditions (chemical concentration, temperature, time) should be selected to simulate the intended service environment as closely as possible [82].
- Post-Exposure Analysis: After immersion, specimens are removed, rinsed, dried (if applicable), and re-weighed and measured. Mechanical properties are re-tested and compared to pre-exposure values. Visual inspection is conducted for signs of degradation like swelling, cracking, blistering, or discoloration [82].
- Performance Evaluation: Chemical resistance is evaluated by the percentage retention of original properties. Standards like ASTM D543 ("Standard Practices for Evaluating the Resistance of Plastics to Chemical Reagents") and ASTM D5747 (for geomembranes) provide frameworks for this evaluation [82]. A significant drop in mechanical properties or a large change in mass/volume indicates poor chemical resistance.
The Scientist's Toolkit: Key Reagents & Materials
Table 3: Essential Materials and Analytical Techniques for Stability Research
| Item / Technique | Function / Relevance | Examples & Notes |
|---|---|---|
| Dynamic Vapor Sorption (DVS) Instrument | Precisely measures moisture uptake and desorption as a function of humidity and temperature [81]. | Critical for characterizing hygroscopicity of amorphous polymers and ASDs. |
| Differential Scanning Calorimetry (DSC) | Determines thermal transitions: Glass Transition (Tg) and Melting Point (Tm) [1]. | Used to measure Tg depression due to plasticization by moisture [81]. |
| Chemical Resistance Test Cells | Containers for immersion testing of polymer specimens in chemical reagents [82]. | Must be chemically inert (e.g., glass) to avoid contamination. |
| Universal Testing Machine (UTM) | Measures mechanical properties (tensile strength, elongation, modulus) before and after chemical exposure [82]. | Quantifies degradation of mechanical integrity. |
| Atomic Layer Deposition (ALD) | Deposits ultra-thin, conformal inorganic barrier layers (e.g., SiO2, Al2O3) on polymers [83]. | Used to dramatically enhance moisture barrier properties of substrates [83]. |
| Hydrophobic Agents / Surface Modifiers | Chemicals used to treat polymers to reduce surface energy and water wettability [84]. | e.g., Silane emulsions, rosin; used in "soaking" or "coating" methods to impart waterproofness [84]. |
Mitigation Strategies for Enhanced Stability
Understanding degradation mechanisms enables the development of effective mitigation strategies, which can be material-centric or processing-oriented.
- Material Selection and Design: The most fundamental strategy is selecting a polymer with intrinsic resistance. Semi-crystalline polymers like PEEK, PPS, and PTFE are preferred for applications demanding low moisture uptake and high chemical inertness [3] [80]. At the molecular level, reducing polar groups in the polymer chain can decrease hydrophilicity [81].
- Polymer Blending and Alloying: Combining polymers can yield materials with balanced properties. For example, ethylene interpolymer alloys (EIA/KEE) have been developed to provide improved chlorine resistance compared to standard plasticized PVC [82].
- Additives and Fillers: Incorporating fillers like glass or carbon fiber can reduce overall moisture absorption and improve dimensional stability [80]. Additives such as chemical stabilizers and antioxidants can mitigate specific degradation pathways like oxidation [85].
- Surface Engineering and Coatings: Applying hydrophobic coatings or depositing inorganic barrier layers (e.g., SiO2 via PECVD) can drastically reduce a material's permeability to moisture and oxygen [84] [83]. This is particularly valuable for protecting otherwise moisture-sensitive amorphous materials.
- Processing Control: For semi-crystalline polymers, processing parameters critically influence the degree of crystallinity. In injection molding, higher mold temperatures (e.g., 170-200°C for PEEK) allow for slower cooling, facilitating the formation of a more consistent and higher crystalline structure, which enhances chemical resistance [60]. Annealing (post-processing heat treatment) can be used to increase crystallinity and relieve internal stresses [60].
The management of moisture and chemical resistance is a central challenge in polymer science, with profound implications for material stability and degradation. The amorphous versus crystalline dichotomy provides a powerful framework for understanding and predicting polymer behavior. Semi-crystalline polymers, with their densely packed ordered regions, inherently offer superior barrier properties and chemical resistance, making them indispensable for demanding applications in aerospace, medical devices, and chemical processing. In contrast, amorphous polymers, while often offering processing advantages and transparency, require careful formulation and protective strategies to mitigate their inherent susceptibility to environmental stressors.
For researchers and drug development professionals, this knowledge translates into informed material selection, robust experimental assessment using standardized protocols, and the strategic implementation of mitigation techniques. By leveraging the principles outlined in this guide—from fundamental mechanisms to advanced testing and protection strategies—scientists can effectively address stability and degradation challenges, ensuring the performance and reliability of polymeric materials throughout their intended lifecycle.
Optimizing Drug-Polymer Interactions for Targeted Release Profiles
The strategic design of drug-polymer systems is fundamental to achieving targeted release profiles in modern pharmaceuticals. The core distinction in this design lies in the choice between amorphous and crystalline polymer structures, each imparting distinct physicochemical properties that govern drug release kinetics and mechanism. Amorphous solid dispersions (ASDs), where a drug is molecularly dispersed within an amorphous polymer matrix, have emerged as a transformative technology for enhancing the solubility and bioavailability of poorly water-soluble drugs (PWSDs) [86]. In contrast, delivery systems based on semi-crystalline or crystalline polymers often provide a more rigid, diffusion-controlled matrix suitable for prolonged, sustained release [87].
The optimization process requires a deep understanding of the interplay between the polymer's inherent properties (e.g., glass transition temperature, crystallinity, functional groups), the drug's characteristics (e.g., log P, pKa, glass-forming ability), and their mutual interactions. These interactions—whether hydrogen bonding, ionic, van der Waals, or hydrophobic—are pivotal in stabilizing the amorphous drug, preventing recrystallization, and dictating the release mechanism upon hydration [88] [89] [86]. This guide delves into the core principles and methodologies for engineering these interactions to achieve precise control over drug release profiles, framed within the ongoing research into amorphous versus crystalline polymer structures.
Core Principles of Drug-Polymer Interactions
Fundamental Interaction Mechanisms
The physical stability and release performance of a drug-polymer system are governed by several key interaction mechanisms. A summary of these interactions and their impact on formulation is provided in the table below.
Table 1: Fundamental Drug-Polymer Interaction Mechanisms
| Interaction Type | Molecular Basis | Impact on Formulation | Common Polymer Examples |
|---|---|---|---|
| Hydrogen Bonding | Dipole-dipole attraction between H-donor and H-acceptor groups. | Increases miscibility, raises Tg, inhibits drug recrystallization, stabilizes supersaturation [88] [86]. | PVPVA, HPMCAS, Cellulose derivatives |
| Hydrophobic Interactions | Association of non-polar regions in an aqueous environment. | Enhances condensation into colloidal nanodroplets, can sustain supersaturation [90] [88]. | Polyesters (PLGA, PCL), Eudragit polymers |
| Ionic Interactions | Electrostatic attraction between ionized drug and polymer. | Provides strong, specific binding, can drastically prolong supersaturation and enable salt formation (ASSDs) [88]. | Chitosan, Alginate, HPMCAS (at specific pH) |
| Van der Waals Forces | Weak, non-specific attractive forces between atoms/molecules. | Contributes to overall miscibility and cohesion, though less specific than other bonds [86]. | Most polymers |
The Role of Polymer Architecture: Amorphous vs. Crystalline
The physical state of the polymer matrix is a critical determinant of the drug release mechanism.
Amorphous Polymers: Polymers like PVPVA and HPMCAS are characterized by a random molecular arrangement and a glass transition temperature (Tg). Below the Tg, the polymer is a rigid glass, immobilizing the dispersed drug. Upon water ingress, the matrix can swell, allowing drug release via diffusion through a hydrated gel layer. The formation of this gel layer and the potential for water-induced amorphous-amorphous phase separation (AAPS) are key release rate-controlling events [90] [91]. The primary goal is to maintain molecular dispersion and prevent phase separation or crystallization that can halt release.
Semi-Crystalline Polymers: Polymers such as Poly(ε-caprolactone) (PCL) possess ordered, crystalline regions dispersed within amorphous domains. Drug molecules are typically excluded from the crystalline regions and reside in the amorphous zones. Release is predominantly controlled by diffusion through the tortuous amorphous pathways and is generally slower than from amorphous matrices [87]. The degree of crystallinity can be engineered to fine-tune release kinetics; higher crystallinity typically leads to denser matrices and slower release.
Analytical and Characterization Techniques
A multi-faceted analytical approach is essential to fully characterize drug-polymer interactions and the resulting microstructure. The following workflow outlines a recommended sequence for comprehensive formulation analysis.
Diagram 1: Experimental Workflow for ASD Characterization
Key Experimental Protocols
Protocol 1: Investigating Phase Separation Morphology via Confocal Microscopy [90]
This protocol is critical for visualizing phase separation during dissolution, a key factor in release failure at high drug loading.
- Sample Preparation: Prepare ASDs (e.g., Ritonavir-PVPVA) via solvent evaporation. Incorporate trace amounts (e.g., 0.02% w/w) of hydrophobic (e.g., Nile Red) and hydrophilic (e.g., Alexa Fluor 488) fluorescent dyes during manufacturing.
- Compact Formation: Compress the ASD powder into a compact to simulate a tablet surface.
- In-Situ Dissolution: Place the compact in a dissolution chamber mounted on a confocal fluorescence microscope. Use a phosphate buffer (pH 6.8) or other biorelevant medium at 37°C.
- Real-Time Imaging: Monitor the compact-solution interface in real-time using appropriate laser lines for the dyes. The hydrophobic dye will partition into the drug-rich phase, and the hydrophilic dye into the polymer/water-rich phase.
- Image Analysis: Analyze the time-dependent evolution of phase morphology. A continuous, interconnected drug-rich phase at the surface is indicative of a barrier layer detrimental to release, while discrete, isolated drug-rich domains are preferable.
Protocol 2: Molecular Dynamics (MD) Simulation of Drug-Polymer Interactions [88] [89]
MD simulations provide atomistic-level insight into interaction energies and dynamics that are challenging to probe experimentally.
- System Construction: Obtain 3D structures of the drug and polymer from databases (e.g., PubChem). Use software like GaussView and Gaussian for geometry optimization using Density Functional Theory (DFT).
- Force Field Selection: Assign atomistic parameters using common force fields such as AMBER99SB-ILDN and GAFF.
- Simulation Setup:
- Solvent Evaporation Method: Simulate a system containing drug and polymer molecules in an explicit solvent (e.g., ethanol). Gradually remove solvent molecules during the simulation.
- Melt-Quenching Method: Simulate a system of drug and polymer without solvent. Heat the system above its melting point and then cool it rapidly to room temperature.
- Production Run & Analysis: Run the simulation for a sufficient time (e.g., hundreds of nanoseconds) to achieve equilibrium. Analyze trajectories to calculate:
- Root Mean Square Deviation (RMSD/RMSF): For system stability and molecular mobility.
- Radial Distribution Function (RDF): To identify preferential interactions between specific atom pairs (e.g., drug-polymer vs. drug-drug).
- Hydrogen Bond Count & Interaction Energy: Quantify the strength and number of drug-polymer interactions.
Formulation Optimization Strategies
Polymer and Excipient Selection
The choice of polymer is the cornerstone of formulation success. The table below compares key synthetic and natural polymers.
Table 2: Key Polymer Classes for Targeted Release Profiles
| Polymer Class | Example Polymers | Key Mechanisms & Advantages | Targeted Release Profile |
|---|---|---|---|
| Synthetic Amorphous | PVPVA, Soluplus | Hydrogen bonding, antiplasticization, inhibition of crystallization [90] [86]. | Rapid release and supersaturation for PWSDs. |
| Semi-Crystalline | PCL, PLA | Diffusion-controlled release through amorphous domains; rate tunable via crystallinity [87]. | Sustained, prolonged release (weeks to months). |
| Enteric/Soluble | HPMCAS, HPMC | pH-dependent solubility, stabilizes supersaturation in intestine [88] [86]. | Delayed release (intestinal targeting). |
| Natural Polymers | Chitosan, Alginate, Starch | Biocompatibility, biodegradability, mucoadhesion [70]. | Sustained or targeted release, often for sensitive therapeutics. |
Advanced Strategy: Amorphous Salt Solid Dispersions (ASSDs) For ionizable drugs, forming an amorphous salt within the polymer matrix (e.g., Celecoxib-Na+/K+ with PVP-VA) can create exceptionally stable supersaturated systems. The strong ionic interactions between the drug counterion and the polymer lead to more stable intermolecular energies compared to neutral ASDs, correlating with prolonged supersaturation and improved bioavailability [88].
The Scientist's Toolkit: Essential Research Reagent Solutions
Table 3: Key Reagents for Investigating Drug-Polymer Interactions
| Reagent / Material | Function in Research | Technical Notes |
|---|---|---|
| PVP-VA (Kollidon VA 64) | A model amorphous polymer for ASDs; provides good hydrogen bonding capacity and dissolution enhancement [90] [88]. | Monitor for "falling-off-the-cliff" release at high drug loading. |
| HPMCAS (AQOAT/Affinisol) | A common enteric polymer for colonic targeting; stabilizes supersaturation via hydrophobic interactions [88]. | Performance is highly pH-dependent. |
| Poloxamers (e.g., PLX) | Surfactant polymers used to inhibit phase separation, enhance wetting, and plasticize matrices [89]. | Can increase molecular mobility; stability testing is critical. |
| Fluorescent Dyes (Nile Red, Alexa 488) | Hydrophobic/Hydrophilic probes for visualizing phase separation dynamics via confocal microscopy [90]. | Ensure dye partitioning is specific and does not perturb the system. |
| Biocompatible Solvents (Methanol, Ethanol, DCM) | Used in solvent evaporation preparation methods for ASDs [90] [89]. | Residual solvent levels must be controlled and monitored. |
Optimizing drug-polymer interactions is a multifaceted endeavor that bridges fundamental material science and practical therapeutic outcomes. The choice between amorphous and crystalline polymer structures defines the primary release mechanism, which can be finely tuned through strategic polymer selection, thoughtful excipient use, and a deep understanding of phase behavior. Advanced analytical techniques, particularly confocal microscopy and molecular dynamics simulations, have transitioned from specialized tools to essential components of the formulation scientist's arsenal, providing unprecedented insight into the microstructure and molecular interactions that govern performance. As the field progresses, the integration of computational prediction with high-throughput experimentation and the adoption of biocompatible natural polymers will undoubtedly drive the development of next-generation targeted drug delivery systems with enhanced efficacy and safety profiles.
Ensuring Biocompatibility and Managing Toxicity of Degradation Products
The development of polymers for biomedical applications represents a rapidly advancing frontier where material science intersects with biological systems. Within the context of amorphous versus crystalline polymer structures, ensuring biocompatibility and managing the toxicity of degradation products becomes paramount for patient safety and therapeutic efficacy. The fundamental definition of biocompatibility, as established by the 2018 Chengdu conference, is "the ability of a material to perform with an appropriate host response in a specific application" [92]. This definition emphasizes that biocompatibility is not a passive property but an active performance requirement that varies depending on the application context.
The transition from traditional crystalline polymers to amorphous solid dispersions (ASDs) in pharmaceutical development highlights the critical importance of degradation product management. While ASDs effectively enhance the solubility and bioavailability of poorly water-soluble drugs, their high-energy, non-crystalline state introduces unique challenges for stability and degradation profiling [70] [93]. The degradation of these polymer-based systems, whether through hydrolytic, enzymatic, or oxidative pathways, generates breakdown products that may elicit entirely different biological responses compared to the parent polymer. Consequently, understanding and controlling this degradation process is essential for advancing both amorphous and crystalline polymer applications in biomedical fields, particularly in drug delivery systems and implantable devices where long-term tissue interaction occurs.
Fundamental Principles of Polymer Degradation
Degradation Mechanisms and Pathways
Polymer degradation involves the fragmentation of macromolecules into lower molecular weight components through various mechanisms that depend on the polymer's chemical structure, morphology, and environmental conditions. Understanding these pathways is essential for predicting and managing degradation product toxicity.
Primary degradation mechanisms include:
Hydrolytic degradation: Water molecules cleave chemical bonds in the polymer backbone, particularly effective for polymers containing ester, anhydride, amide, or carbonate functional groups. The rate of hydrolysis depends on factors including humidity, temperature, pH, and catalyst presence. For instance, polylactic acid (PLA) experiences a 30-50% increase in hydrolysis rate when temperature increases by 50°C under humidity above 90%, and the presence of just 0.5% SnCl2 can accelerate PLA hydrolysis by approximately 40% [94].
Enzymatic degradation: Biological catalysts specifically cleave polymer bonds, often with greater specificity than hydrolysis. Enzymes such as lipases, proteases, esterases, and glycosidases target specific functional groups. For example, α-amylase and β-glucosidase act on α-1,4-glycosidic linkages in starch-based polymers [94].
Oxidative degradation: Reactive oxygen species or other oxidative agents cleave polymer chains, particularly affecting polymers with vulnerable functional groups or unsaturated bonds.
Photodegradation: UV radiation initiates chain scission, often through free radical mechanisms, which is particularly relevant for environmental degradation but less common in biomedical applications [95].
The degradation kinetics vary significantly between amorphous and crystalline regions within polymers. Amorphous regions typically degrade more rapidly due to their looser packing and greater accessibility to water, enzymes, and other degradative agents. This differential degradation behavior has profound implications for drug delivery systems, where the predominantly amorphous nature of ASDs can lead to faster initial release profiles but potentially different degradation product mixtures compared to their crystalline counterparts [70].
Degradation Product Formation and Characteristics
As polymers degrade, they generate various byproducts including oligomers, monomers, and chemical additives that may have toxicological profiles distinct from the parent polymer. For example, polyethylene terephthalate (PET) degradation can produce oligomers formed as side products of incomplete polymerization, which may migrate from packaging into products [96]. Similarly, residual monomers in plastics—such as bisphenol A (BPA), styrene, and vinyl chloride—have demonstrated endocrine disruption, carcinogenic, and mutagenic properties [97].
The size and surface area of degrading particles significantly influence leaching behavior, with smaller particles exhibiting greater release capacity due to higher surface-area-to-volume ratios [97]. This is particularly relevant for microplastic and nanoplastic formation from conventional polymers like polyethylene and polypropylene, which can persist in the environment for centuries while continuously leaching additives and degradation products [96] [98].
Table 1: Common Polymer Degradation Mechanisms and Associated Products
| Degradation Mechanism | Target Functional Groups | Primary Degradation Products | Factors Influencing Rate |
|---|---|---|---|
| Hydrolytic Degradation | Ester, anhydride, amide, carbonate | Oligomers, monomers, carboxylic acids, alcohols, amines | pH, temperature, humidity, catalyst presence |
| Enzymatic Degradation | Glycosidic, ester, amide | Oligosaccharides, monosaccharides, fatty acids, amino acids | Enzyme concentration, specificity, temperature |
| Oxidative Degradation | Unsaturated bonds, ethers, aldehydes | Peroxides, alcohols, carbonyl compounds, chain scission products | Oxygen concentration, transition metal catalysts, UV exposure |
| Thermal Degradation | All, but especially vinyl, ester, chloride | Monomers, cross-linked structures, gaseous products | Temperature, oxygen presence, polymer structure |
Assessment Methodologies for Biocompatibility and Degradation
Biocompatibility Evaluation Frameworks
Evaluating biocompatibility requires a multifaceted approach that assesses material-tissue interactions at molecular, cellular, and systemic levels. According to ASTM guidelines and contemporary research practice, comprehensive biocompatibility assessment should evaluate toxicity, allergic potential, and immunogenicity to prevent adverse events and ensure patient safety [94]. The host response to biomaterials involves various components of the immune system, making immunological profiling an essential component of biocompatibility testing.
Key assessment techniques include:
- In vitro cytotoxicity testing: Using relevant cell lines to evaluate acute toxicity, often following ISO 10993-5 standards.
- Genotoxicity assays: Assessing DNA damage and mutagenic potential through Ames test, micronucleus assay, or comet assay.
- Sensitization testing: Evaluating potential allergic responses using direct contact methods or in vitro alternatives.
- Irritation and intracutaneous reactivity: Assessing local inflammatory responses through skin contact tests.
- Systemic toxicity evaluation: Examining effects on major organ systems following material implantation or extract injection.
- Implantation studies: Evaluating local tissue response through histopathological examination of implant sites.
Each assessment must be tailored to the material's intended application, with consideration of the duration of exposure (limited, prolonged, or permanent) and nature of contact (surface, external communicating, or implant) [92] [99]. For biodegradable systems, testing must account for not only the initial material but also its degradation products throughout the degradation lifecycle.
Degradation Monitoring Techniques
Monitoring polymer degradation requires both inferential methods that suggest degradation is occurring and confirmatory techniques that definitively identify chemical changes. The American Society for Testing and Materials (ASTM) provides guidelines through standards such as ASTM F1635-11, which recommends monitoring mass loss, changes in molar mass, and mechanical properties [99].
Physical characterization approaches include:
- Gravimetric analysis: Measuring mass loss over time, though this approach risks confusing dissolution with degradation [99].
- Surface morphology assessment: Using scanning electron microscopy (SEM) to visualize surface erosion, cracking, or pore formation.
- Molecular weight monitoring: Employing size exclusion chromatography (SEC) or viscosity measurements to track chain scission.
Chemical characterization approaches provide definitive degradation confirmation:
- Fourier Transform Infrared Spectroscopy (FTIR): Identifying changes in functional groups and chemical structure [99].
- Nuclear Magnetic Resonance (NMR) spectroscopy: Characterizing degradation products and quantifying structural changes [99].
- Mass spectrometry: Identifying and quantifying specific degradation products with high sensitivity [99].
- Chromatographic techniques (HPLC, HPAEC-PAD): Separating and quantifying degradation products in complex mixtures [99].
Each technique presents limitations, with physical approaches potentially mistaking solubility for degradation, and chemical methods often requiring specialized equipment and expertise. Consequently, a multimodal approach combining several techniques provides the most comprehensive degradation assessment [99].
Diagram 1: Polymer Degradation Assessment Workflow. This diagram illustrates the integrated approach required for comprehensive degradation monitoring, combining environmental exposure with physical and chemical assessment techniques.
Advanced Analytical Approaches
Emerging technologies enable more sophisticated degradation monitoring:
- Real-time degradation monitoring: Using fluorescent tags or embedded sensors to track degradation without sample destruction.
- High-throughput screening: Employing multi-well plate systems to simultaneously test multiple degradation conditions.
- Computational modeling: Predicting degradation pathways and kinetics based on polymer structure and environmental factors.
- Accelerated aging studies: Applying elevated temperature, humidity, or radiation to predict long-term degradation behavior.
These advanced approaches help address limitations of conventional methods, particularly the invasive nature of sampling that can disturb ongoing degradation processes and the inability to monitor degradation continuously in real-time [99].
Strategic Approaches for Managing Degradation Toxicity
Material Selection and Design Strategies
Strategic material selection forms the foundation for managing degradation product toxicity. The growing shift toward natural polymer-based systems reflects the pharmaceutical industry's response to toxicity concerns with synthetic carriers. Natural polymers like chitosan, alginate, hyaluronic acid, and cellulose offer inherent advantages including better recognition by biological systems, enzymatic breakdown pathways, and potentially safer degradation profiles [70] [92].
Key material design considerations include:
- Polymer origin and structure: Natural polymers typically exhibit better biocompatibility due to structural similarity to biological macromolecules [70].
- Chemical functionality: Selecting monomers and functional groups that yield non-toxic degradation products.
- Molecular weight and distribution: Controlling these parameters to influence degradation rate and product size.
- Crystallinity: Amorphous regions degrade faster than crystalline domains, enabling tuning of degradation profiles through crystallinity control [70].
The emergence of natural polymer-based amorphous solid dispersions (NP-ASDs) represents a significant advancement for drug delivery applications. These systems leverage natural polymers like chitosan oligosaccharide to stabilize amorphous drugs while enhancing dissolution profiles. For example, chitosan-based ASDs for curcumin increased solubility from 60.62 µg/mL to over 97 µg/mL while maintaining supersaturation for 24 hours [70]. Similarly, sodium alginate-based solid dispersions of indomethacin achieved nearly complete drug release within five minutes compared to mere 5.3% release from the pure drug [70].
Processing and Modification Techniques
Material processing significantly influences both degradation behavior and biocompatibility. Surface modification techniques enhance biocompatibility by improving biomaterial-tissue interactions:
- Cold gas plasma treatment: Modifies surface chemistry, crystallinity, roughness, and charge to improve cellular attachment [92].
- Chemical functionalization: Introducing specific functional groups to direct biological responses.
- Polymer blending: Combining natural and synthetic polymers to balance biocompatibility with mechanical performance.
- Cross-linking control: Regulating degradation rates through controlled cross-link density.
For implant applications, surface modification creates bioinspired and biomimetic surfaces that actively promote positive tissue integration while minimizing foreign body responses. These fourth-generation biomaterials represent the current state-of-the-art in biocompatibility management [92].
Table 2: Biocompatibility Enhancement Strategies for Polymeric Biomaterials
| Strategy Category | Specific Techniques | Mechanism of Action | Applications |
|---|---|---|---|
| Surface Modification | Plasma treatment, chemical grafting, topographic patterning | Alters surface energy, chemistry, and topography to direct cell response | Implants, tissue engineering scaffolds |
| Bioactive Coatings | Heparin, albumin, chitosan, phospholipid layers | Creates antithrombotic, antibacterial, or pro-adhesive surfaces | Vascular devices, blood-contacting implants |
| Material Blending | Natural-synthetic polymer blends, ceramic composites | Combines favorable properties of multiple material classes | Bone tissue engineering, drug delivery systems |
| Degradation Rate Control | Cross-linking, crystallinity adjustment, monomer selection | Matches degradation rate with tissue healing/regeneration time | Temporary implants, drug depots |
| By-product Management | pH buffering, reactive group capping, purification | Neutralizes or removes toxic degradation products | All biodegradable systems |
Experimental Protocols for Degradation and Biocompatibility Assessment
Standardized Degradation Monitoring Protocol
A comprehensive degradation study should follow this methodological framework:
Pre-degradation characterization:
- Determine initial molecular weight via SEC or intrinsic viscosity
- Characterize chemical structure using FTIR and NMR
- Establish baseline mechanical properties
- Document initial morphology via SEM
Degradation environment setup:
- Prepare simulated body fluid (SBF) or appropriate buffer (typically pH 7.4)
- Consider enzyme supplementation for enzymatic degradation studies
- Maintain controlled temperature (typically 37°C) and humidity
- Use triplicate samples for statistical significance
Sampling and analysis timeline:
- Establish regular sampling intervals (e.g., 1, 3, 7, 14, 21, 28 days)
- At each interval, remove samples for:
- Gravimetric analysis (mass loss)
- Molecular weight determination
- Microscopic examination
- Degradation product analysis
- Continue until complete degradation or plateau in degradation kinetics
Degradation product identification:
- Analyze release media via HPLC-MS to identify and quantify degradation products
- Characterize any insoluble residues via FTIR and SEM
- Monitor pH changes in degradation media
This protocol aligns with ASTM F1635-11 guidelines while incorporating contemporary analytical techniques [99].
Tiered Biocompatibility Testing Framework
A systematic approach to biocompatibility assessment includes:
Level 1: In vitro screening
- Cytotoxicity testing (ISO 10993-5):
- Direct contact test: Place material specimens in direct contact with cell monolayers (e.g., L929 mouse fibroblasts)
- Extract testing: Prepare material extracts using appropriate solvents and expose to cells
- Assess cell viability via MTT, XTT, or neutral red uptake assays
- Include positive (latex) and negative (HDPE) controls
- Hemocompatibility assessment (for blood-contacting devices):
- Hemolysis test: Quantify red blood cell lysis following material contact
- Platelet adhesion and activation: Assess thrombogenic potential
- Coagulation assays: Measure PT, aPTT, and other coagulation parameters
Level 2: In vivo evaluation
- Sensitization testing (ISO 10993-10):
- Guinea Pig Maximization Test or Murine Local Lymph Node Assay
- Assess potential for allergic contact dermatitis
Irritation testing:
- Intracutaneous reactivity or skin irritation tests
- Evaluate local inflammatory response
Acute systemic toxicity:
- Administer material extracts via appropriate routes
- Monitor for signs of toxicity over 72 hours
Level 3: Application-specific testing
- Subchronic and chronic toxicity studies: Longer-term implantation studies
- Genotoxicity assessment: Ames test, chromosomal aberration assay, mouse micronucleus test
- Implantation studies: Histopathological evaluation of tissue response at implantation sites
This tiered approach ensures comprehensive safety assessment while conserving resources by eliminating unsuitable materials early in development [92] [99].
The Scientist's Toolkit: Essential Research Reagents and Materials
Successful research in polymer biocompatibility and degradation requires specialized materials and analytical tools. The following toolkit highlights essential components for designing robust studies in this field.
Table 3: Essential Research Toolkit for Biocompatibility and Degradation Studies
| Category | Specific Items | Function/Purpose | Key Considerations |
|---|---|---|---|
| Polymer Systems | Chitosan, alginate, hyaluronic acid, PLA, PCL, PHA | Representative natural and synthetic biodegradable polymers | Select based on degradation mechanism, processing requirements, and application |
| Degradation Media | Phosphate buffered saline (PBS), simulated body fluid (SBF), enzyme solutions (esterases, lipases, proteases) | Simulate physiological or specific degradation environments | Control pH, ionic strength, enzyme activity throughout experiment |
| Cell Culture Systems | L929 fibroblasts, human mesenchymal stem cells, endothelial cells, macrophage lines | In vitro biocompatibility and cytotoxicity assessment | Select cell types relevant to intended application; include appropriate controls |
| Analytical Standards | Polymer monomers, anticipated degradation products, internal standards for quantification | Calibration and method validation for analytical techniques | Source certified reference materials when available |
| Characterization Tools | SEM, FTIR, NMR, HPLC-MS, SEC-MALS | Comprehensive material characterization before, during, and after degradation | Establish standardized protocols across experiments |
| Testing Equipment | Universal mechanical testers, pH meters, incubators, biological safety cabinets | Performance testing under controlled conditions | Regular calibration and maintenance critical for reproducible results |
Diagram 2: Polymer Degradation Toxicity Pathways. This diagram illustrates the progression from initial polymer degradation through product formation to potential toxicity mechanisms that must be assessed.
The strategic management of polymer degradation products represents a critical challenge and opportunity in advancing biomedical materials. The field is evolving from simply observing degradation to actively designing degradation profiles that yield safe, predictable, and therapeutically beneficial outcomes. Several key trends are shaping future research directions:
Advanced material systems including functionally graded polymers, smart stimuli-responsive systems, and multi-component composites offer increasingly sophisticated control over degradation behavior. The continuing development of natural polymer-based amorphous solid dispersions demonstrates how natural and synthetic approaches can merge to create systems with optimized performance and safety profiles [70] [93].
Analytical advancements in real-time monitoring, high-resolution characterization, and computational modeling will enable more precise prediction and control of degradation processes. The integration of machine learning and artificial intelligence in material design promises to accelerate the development of polymers with predetermined degradation characteristics and minimal toxicity [100].
Regulatory science continues to evolve with increasingly sophisticated requirements for demonstrating biocompatibility, particularly for complex combination products and long-term implantables. The implementation of quality by design principles and comprehensive risk management frameworks will further strengthen the safety profile of future polymeric biomaterials.
As the field advances, the fundamental principles of understanding degradation pathways, comprehensively assessing biocompatibility, and proactively managing toxicity will remain essential for translating promising polymer systems into clinically successful applications. The integration of these considerations early in material design—rather than as retrospective additions—represents the most effective strategy for ensuring the safety and efficacy of polymer-based biomedical products.
A Rigorous Comparison: Validating Material Properties for Biomedical Applications
The performance of polymeric materials in research and industrial applications is fundamentally governed by their microstructure. The primary structural division in polymers lies between amorphous and semi-crystalline states, a distinction that dictates their thermal, mechanical, and chemical behavior [1]. This whitepaper provides an in-depth technical analysis of how these underlying structures influence three critical mechanical properties: strength, stiffness, and impact resistance. Understanding this relationship is crucial for researchers and drug development professionals who must select materials for applications ranging from medical device components to drug delivery systems, where predicting performance under mechanical stress and thermal cycling is paramount.
Semi-crystalline polymers exhibit a mixed morphology, containing organized, tightly packed crystalline regions (spherulites) surrounded by disordered amorphous areas [101]. This structure results from molecular chains folding into orderly stacks called lamellae [1]. In contrast, amorphous polymers possess a completely random molecular chain arrangement, often visualized as a plate of cooked spaghetti, with no long-range order [1] [66]. This fundamental architectural difference is the origin of the divergent property profiles explored in this document.
Structural Fundamentals and Property Relationships
The following diagram illustrates the fundamental structural differences between amorphous and semi-crystalline polymers and their direct relationship to key mechanical properties.
Comparative Mechanical Properties
The structural differences between amorphous and semi-crystalline polymers create a distinct trade-off in their mechanical performance. Semi-crystalline polymers generally provide superior strength and stiffness, while amorphous polymers excel in impact resistance and dimensional stability during processing.
Quantitative Mechanical Property Comparison
Table 1: Quantitative comparison of key mechanical and thermal properties between amorphous and semi-crystalline polymers.
| Property | Semi-Crystalline Polymers | Amorphous Polymers |
|---|---|---|
| Tensile Strength | High [3] [4] | Moderate [66] |
| Stiffness (Modulus) | High [3] [66] | Moderate to Low [66] |
| Impact Resistance | Low to Moderate [66] [4] | High [66] [4] |
| Dimensional Stability (Post-Processing) | Lower (Anisotropic shrinkage, warpage) [66] [4] | Higher (Isotropic shrinkage, less warpage) [66] [101] |
| Wear / Abrasion Resistance | High [66] [4] | Low [4] |
| Max Continuous Use Temperature | Higher (Up to ~120-250°C, based on Tm) [3] | Lower (Up to ~100-200°C, based on Tg) [3] |
| Chemical Resistance | High [3] [66] | Low to Moderate [66] [4] |
| Optical Clarity | Opaque or Translucent [66] | Often Transparent [66] [4] |
Qualitative Characteristics and Applications
Table 2: Qualitative characteristics, associated polymer examples, and typical applications.
| Aspect | Semi-Crystalline Polymers | Amorphous Polymers |
|---|---|---|
| Molecular Structure | Ordered, closely packed chains with crystalline regions (lamellae/spherulites) and amorphous zones [1] [101]. | Random, entangled, disordered chain arrangement [1] [102]. |
| Thermal Transition | Sharp Melting Point (Tm) [1] [66]. Exhibits a distinct crystal melt transition. | Glass Transition Temperature (Tg) [1] [102]. Softens over a temperature range. |
| Example Polymers | PEEK, Nylon (PA66, PA12), POM, PBT, PP, HDPE, PTFE [3] [66]. | Polycarbonate (PC), ABS, PS, PMMA, PVC, Polyimide [3] [66]. |
| Typical Applications | Gears, bearings, wear-resistant parts (POM, Nylon), chemical-resistant piping (PVDF), high-temperature components (PEEK) [3] [66]. | Automotive interiors (PC/ABS), transparent lenses and glazing (PMMA, PC), medical devices, electronic housings [3] [66] [4]. |
Thermal Properties as a Window to Mechanical Behavior
The thermal transitions of a polymer provide critical insight into its mechanical performance. Semi-crystalline polymers possess a sharp melting point (Tm), where the orderly arrangement of crystalline regions breaks down into a disordered melt [1] [66]. This transition is a first-order phase change and occurs at a specific temperature. Below Tm but above the glass transition temperature (Tg), semi-crystalline polymers in a leathery state retain significant stiffness and strength due to the reinforcing effect of the intact crystalline domains.
In contrast, amorphous polymers do not have a Tm. Instead, they undergo a glass transition (Tg), which is a second-order transition where the material changes from a hard, glassy state to a soft, rubbery state over a temperature range [1] [102]. Below Tg, the chains in an amorphous polymer are frozen in place, making the material rigid and often brittle. Above Tg, the chains gain sufficient energy for segmental motion, allowing the material to become flexible and tough, which is the origin of its high impact resistance [1].
Experimental Protocols for Property Investigation
Protocol 1: Investigating Polymer Additive Effects on Organic Semiconductor Crystallinity
Objective: To compare the effects of semi-crystalline versus amorphous polymer additives on the crystallinity, morphology, and electrical hysteresis of high-mobility organic semiconductors like TIPS pentacene [103].
Methodology Workflow:
Detailed Procedure:
- Solution Preparation: Prepare a 3 mg/mL solution of TIPS pentacene in toluene. Separately prepare solutions of the semi-crystalline polymer additive (e.g., PEO - Poly(ethylene oxide)) and the amorphous polymer additive (e.g., PαMS - Poly(α-methylstyrene)) at varying molecular weights (e.g., 100K and 300K g/mol) and mixing ratios (e.g., 10-50% by weight) [103]. The PEO solution may require heating to ~70°C to ensure complete dissolution [103].
- Film Deposition: Blend the TIPS pentacene solution with the polymer additive solutions. Deposit the blended solutions onto prepared substrates (e.g., SiO₂/Si wafers with patterned electrodes for bottom-gate, top-contact OTFTs) using spin-coating or drop-casting techniques [103].
- Solvent Annealing: Place the cast films in a controlled solvent vapor environment (e.g., in a sealed chamber with a toluene reservoir) to promote self-assembly and enhance crystallinity of the organic semiconductor [103].
- Characterization:
- Crystallinity: Use Powder X-ray Diffraction (PXRD) to analyze the degree of crystallinity and crystal structure [103].
- Morphology: Employ Scanning Electron Microscopy (SEM) and Atomic Force Microscopy (AFM) to study crystal morphology, grain size, and surface roughness [103].
- Electrical Testing: Measure the electrical characteristics of the OTFTs, focusing on charge carrier mobility, current on/off ratio, and electrical hysteresis. Evaluate air stability by monitoring performance degradation over time in ambient conditions [103].
Protocol 2: Multi-Temperature 3D Printing for In-Situ Control of Crystallinity
Objective: To fabricate multi-material parts with spatially controlled amorphous and semi-crystalline regions from a single monomer formulation using vat photopolymerization 3D printing [15] [104].
Detailed Procedure:
- Resin Formulation: Synthesize or procure a liquid crystalline (LC) diene monomer (e.g., BPLC) that exhibits a sharp transition from a smectic LC phase to an isotropic liquid upon heating. Formulate a resin by combining this monomer with a trifunctional thiol crosslinker and a photoinitiator [15].
- Printing Parameter Calibration:
- For Semi-Crystalline Regions: Set the printing temperature (e.g., 80°C) to be within the monomer's LC phase temperature window (e.g., between 77°C and 111°C). Polymerization at this temperature "locks in" the highly ordered LC structure, resulting in an opaque, stiff, and semi-crystalline polymer network [15].
- For Amorphous Regions: Set the printing temperature (e.g., >95°C) above the monomer's isotropization temperature (e.g., >111°C). Polymerization from this isotropic state results in a transparent, more compliant, and largely amorphous polymer network [15].
- Multi-Material Printing: Utilize a digital light processing (DLP) printer capable of precise temperature control of the resin vat. Design the print job to vary the vat temperature and potentially light intensity layer-by-layer or even pixel-by-pixel to create composite parts with defined regions of amorphous and semi-crystalline material [15].
- Post-Processing and Analysis: Post-cure the printed parts under conditions that do not induce significant additional crystallization or relaxation.
- Mechanical Testing: Perform nanoindentation or tensile tests on the different regions to quantify stiffness and strength differences.
- Thermal Analysis: Use Differential Scanning Calorimetry (DSC) to confirm the presence or absence of a melting point in the respective regions.
- Shape Memory Demonstration: Program a temporary shape by deforming the part above the Tg of the amorphous phase and cooling under strain. Observe the recovery of the original shape upon reheating, demonstrating the differential thermo-mechanical response [15].
The Scientist's Toolkit: Key Research Reagents and Materials
Table 3: Essential materials and their functions for experiments on amorphous and crystalline polymers.
| Reagent/Material | Function/Relevance | Example Use Case |
|---|---|---|
| TIPS Pentacene | Benchmark p-type organic semiconductor for studying crystallization and charge transport [103]. | Model material in Protocol 1 for investigating polymer additive effects on organic crystal growth and OTFT performance [103]. |
| Poly(ethylene oxide) (PEO) | Semi-crystalline polymer additive. Can nucleate individually, creating competitive crystallization scenarios [103]. | Additive in Protocol 1 to modify the crystallization kinetics and morphology of TIPS pentacene [103]. |
| Poly(α-methylstyrene) (PαMS) | Amorphous polymer additive. Promotes vertical phase separation in blends [103]. | Additive in Protocol 1 to enhance morphological homogeneity and device uniformity of OTFTs [103]. |
| Liquid Crystalline (LC) Monomer (e.g., BPLC) | "Switchable monomer" whose final polymer properties depend on printing temperature [15]. | Primary resin component in Protocol 2 for creating semi-crystalline (from LC phase) or amorphous (from isotropic phase) networks based on printing temperature [15]. |
| Trifunctional Thiol Crosslinker | Forms the polymer network via thiol-ene photopolymerization with the LC monomer [15]. | Co-monomer in Protocol 2 resin formulation to create a crosslinked network essential for vat photopolymerization [15]. |
The mechanical properties of polymers are intrinsically linked to their amorphous or semi-crystalline structure. The choice between them is not a matter of superiority but of application-specific optimization. Semi-crystalline polymers, with their strong intermolecular forces and ordered regions, are the clear choice for applications demanding high strength, stiffness, wear resistance, and performance in chemically harsh or elevated temperature environments. Conversely, amorphous polymers offer superior impact resistance, dimensional stability during processing, and are often transparent, making them ideal for structural components, glazing, and containers.
Emerging research, such as the multi-temperature 3D printing of liquid crystalline monomers, highlights a future where material properties can be digitally tuned and spatially controlled at a microscopic level. This paradigm shift from selecting materials to programming them within a single fabrication process opens new frontiers in the design of functional devices for advanced research, medical technology, and drug development. A deep understanding of the structure-property relationships detailed in this whitepaper remains the foundation for these innovations.
Thermal and Chemical Property Analysis for Sterilization and In-Vivo Stability
Within the broader research on amorphous versus crystalline polymer structures, understanding their distinct responses to sterilization and in-vivo environments is paramount for developing advanced medical devices and drug delivery systems. The fundamental morphological differences between these polymer classes—namely, the highly ordered, repeating chains in crystalline regions versus the random, loose chain arrangements in amorphous regions—dictate their thermal, chemical, and biological performance [1]. This whitepaper provides an in-depth technical analysis of how crystallinity influences critical properties such as thermal transition temperatures, chemical resistance, degradation kinetics, and stability under sterilization and physiological conditions. The insights are framed for researchers, scientists, and drug development professionals seeking to rationally select or design polymeric materials for specific biomedical applications.
Theoretical Foundation: Amorphous vs. Crystalline Polymer Morphology
The properties of polymers are intrinsically linked to their morphology. Crystalline polymers exhibit regions where molecular chains are arranged in a highly ordered, repeating pattern, forming structures known as lamellae. These crystalline zones coexist with amorphous regions, and the proportion of crystalline material is quantified as the degree of crystallinity [1]. This ordered packing results in higher density, greater shrinkage during processing, and typically superior mechanical strength and chemical resistance [3].
In contrast, amorphous polymers lack long-range order. Their molecular chains are arranged randomly and held together in a loose structure, leading to chain entanglement. This structure grants amorphous polymers characteristics like transparency, flexibility, and the absence of a sharp melting point [1].
A key thermal property differentiating these morphologies is the glass transition temperature (Tg). Below Tg, an amorphous polymer is in a hard, rigid, and brittle glassy state because the polymer chains are frozen and cannot move. Above Tg, the chains gain mobility, and the material becomes soft and flexible, entering a rubbery state [1]. Crystalline polymers, however, are defined by their melting point (Tm), a specific temperature at which the orderly arrangement of chains transitions to a random, disorganized melt [1]. Most crystalline polymers used in practice are semi-crystalline, containing both crystalline and amorphous regions, which allows them to exhibit both a Tm and a Tg [1].
Table 1: Fundamental Characteristics of Amorphous and Crystalline Polymers
| Property | Amorphous Polymers | Crystalline Polymers |
|---|---|---|
| Chain Arrangement | Random, loose, entangled [1] | Ordered, repeating stacks (lamellae) [1] |
| Long-Range Order | No [1] | Yes [1] |
| Density | Lower [3] | Higher [3] |
| Primary Thermal Transition | Glass Transition Temperature (Tg) [1] | Melting Point (Tm) [1] |
| Optical Clarity | Often transparent | Often opaque or translucent [3] |
Impact of Morphology on Sterilization Stability
Sterilization is a mandatory prerequisite for implantable devices and surgical tools, but the process can adversely affect polymer integrity. The choice of sterilization method must account for the polymer's morphological structure to avoid degradation, deformation, or loss of function.
Heat-Based Sterilization
Heat sterilization, including moist heat (autoclaving) and dry heat, presents significant challenges for polymers, particularly those with low thermal transition temperatures.
Moist Heat (Autoclaving): This process typically involves exposure to saturated steam at 121°C for 15 minutes at 115 kPa [105]. The combination of high temperature and pressure in a humid environment can cause hydrolysis, softening, and bulk degradation of the polymer matrix [105]. The stability of a polymer under these conditions is directly related to its Tg and Tm. For instance, a study on 3D-printed polymers showed that PLA (Tg ~58°C), PETG, and CPE (a modified PETG) all underwent changes after moist heat sterilization. Moist heat caused greater degradation in PETG and CPE than dry heat, particularly affecting tensile and flexural properties due to hydrolytic and thermal degradation [106]. The dimensional stability was also impacted, with the linear coefficient of thermal expansion (LCTE) increasing by 47% in PETG and 20% in PLA after moist heat treatment [106].
Dry Heat: Dry heat sterilization operates at high temperatures without moisture. While it avoids hydrolysis, it can still cause thermal deformation. The same study found that dry heat resulted in a 33% increase in LCTE for PLA and was more suitable than moist heat for surgical guides made from these materials, where high mechanical demands are not present but geometry must be maintained [106]. The structural integrity of a polymer during heat sterilization is not solely dependent on its amorphous or crystalline nature but on the specific thermal properties. For example, a biodegradable poly(caprolactone-urea) urethane (POSS-PCL) could not withstand the harsh environment of autoclaving and lost all structural integrity, whereas a non-degradable poly(carbonate-urea) urethane (POSS-PCU) was successfully sterilized by autoclaving without degradation or cytotoxic effects [105].
Radiation Sterilization
Gamma irradiation is a common low-temperature sterilization method. However, it is known to cause chain scission and cross-linking in polymers, which can alter mechanical properties and cause yellowing [105]. For semi-crystalline polymers, radiation can induce crystallinity. Research on PLA membranes showed that a 25 kGy dose of electron beam radiation (a form of ionizing radiation similar to gamma) did not cause significant structural changes, as confirmed by FTIR spectroscopy. Furthermore, irradiated PLA samples exhibited minimal mass loss during in-vitro degradation studies, with enhanced stability potentially due to radiation-induced crystallinity [107]. This suggests that for some semi-crystalline polymers, radiation sterilization can be a viable method that may even enhance stability by increasing crystallinity.
Table 2: Effects of Sterilization Methods on Selected Polymers
| Polymer | Morphology | Sterilization Method | Key Effects and Stability |
|---|---|---|---|
| PLA | Semi-crystalline [1] | Moist Heat (Autoclave) | Maintained geometry but increased LCTE (20%); mechanical resistance can be compromised [106]. |
| Dry Heat | Increased LCTE (33%); more suitable than moist heat for applications like surgical guides [106]. | ||
| Gamma/Irradiation (25 kGy) | No significant structural changes; minimal degradation; potential radiation-induced crystallinity enhances stability [107]. | ||
| PETG | Amorphous [106] | Moist Heat (Autoclave) | Significant hydrolytic and thermal degradation; 47% increase in LCTE [106]. |
| Dry Heat | 31% increase in LCTE; less degradation than moist heat [106]. | ||
| POSS-PCU | Not Specified | Moist Heat (Autoclave) | Successful sterilization; no cytotoxic effects; no material degradation [105]. |
| POSS-PCL | Not Specified | Moist Heat (Autoclave) | Loss of all structural integrity [105]. |
| Nylon | Semi-crystalline [1] | Moist Heat (Autoclave) | Poor performance due to hygroscopic properties; significant deformation [108]. |
Diagram 1: Polymer Sterilization Selection
Impact of Morphology on In-Vivo Stability and Degradation
The behavior of a polymer within the human body is critical for its application in implants and drug delivery systems. The amorphous and crystalline phases degrade via different mechanisms and at different rates.
Degradation Mechanisms
Aliphatic polyesters like PLA and PGA degrade primarily through hydrolysis, where water molecules cleave the polymer backbone's ester bonds [107]. The rate of this process is heavily influenced by crystallinity. Water penetrates the loose, disordered amorphous regions more easily, causing them to degrade first. The crystalline regions, with their tight molecular packing, are more resistant to water penetration and degrade at a significantly slower rate [109]. This leads to a two-stage degradation profile: rapid initial degradation of amorphous zones followed by a much slower decline as crystalline regions are eroded.
An alternative mechanism is enzymatic surface erosion, exhibited by some aliphatic polycarbonates (APCs) like poly(trimethylene carbonate) (PTMC). This degradation mode, where erosion is confined to the material's surface, helps maintain structural stability throughout the implantation period [109]. The introduction of crystalline segments, such as from 2,2′-dimethyltrimethylene carbonate (DTC), into an amorphous PTMC matrix can further reduce the degradation rate and significantly enhance the material's form-stability in vivo [109].
Crystallinity as a Tool for Stability Control
Manipulating crystallinity is a powerful strategy for tailoring a material's in-vivo lifespan. Copolymerization is a common technique to achieve this. For instance, the degradation rate of poly(lactic-co-glycolic acid) (PLGA) can be precisely controlled by varying the LA:GA ratio. PLGA (60:40) exhibited approximately 40% mass loss in one month, while PLGA (85:15) showed only about 5% mass loss under the same in-vitro conditions [107]. The higher glycolide content disrupts the crystal structure, increasing the amorphous fraction and, consequently, the hydrolysis rate.
Similarly, in aliphatic polycarbonates, the fully amorphous PTMC has a specific in-vivo degradation profile. By copolymerizing TMC with the crystalline monomer DTC, the degradation rate can be slowed, and the form-stability is enhanced because the crystalline PDTC segments act as stable physical cross-links, restricting chain mobility and water access [109]. This principle is also exploited in non-biological settings, where controlling the amorphous-crystalline transition in polymers like polyvinyl alcohol (PVA) allows for the creation of miniaturized, stable hydrogel structures for bioelectronics [61].
Table 3: In-Vivo Degradation Behavior of Selected Biopolymers
| Polymer | Morphology | Degradation Mechanism | Key Findings from In-Vivo/In-Vitro Studies |
|---|---|---|---|
| PTMC | Amorphous [109] | Surface Erosion [109] | Predictable degradation; avoids acidic by-products; but lacks form stability [109]. |
| P(TMC-co-DTC) | Semi-crystalline (tunable) [109] | Surface Erosion [109] | Introduction of crystalline DTC segments reduces degradation rate and enhances form-stability [109]. |
| PLGA (85:15) | Semi-crystalline | Bulk Hydrolysis [107] | ~5% mass loss after 1 month in vitro; retains shape for ~2.5 months [107]. |
| PLGA (60:40) | More Amorphous | Bulk Hydrolysis [107] | ~40% mass loss after 1 month in vitro; loses structural integrity [107]. |
| Pure PLA | Semi-crystalline [1] | Bulk Hydrolysis [107] | <1% mass loss after several months in vitro; highest stability [107]. |
Diagram 2: Polymer In-Vivo Degradation
Experimental Protocols for Analysis
Protocol: In-Vitro Hydrolytic Degradation
This protocol is used to simulate and assess the long-term stability and degradation behavior of polymers in a physiological environment [107].
- Sample Preparation: Fabricate polymer samples (e.g., plates of 10 × 10 × 1 mm) and record their initial dry mass (with a precision of 0.0001 g).
- Immersion: Place samples in sterile vials and fully immerse in phosphate-buffered saline (PBS, pH 6.8) supplemented with 0.1% sodium azide to prevent microbial growth. Maintain a buffer volume-to-sample mass ratio of no more than 30:1.
- Incubation: Incubate the vials in a thermostatic chamber at 37 ± 1°C to simulate body temperature.
- Monitoring: At predetermined intervals (e.g., 1, 2, 4 weeks), remove samples from the PBS.
- Drying and Weighing: Rinse samples with deionized water and dry in a vacuum oven until a constant weight is achieved. Record the final dry mass.
- Analysis: Calculate the percentage mass loss over time. Use techniques like Scanning Electron Microscopy (SEM) to examine surface morphological changes and Fourier-Transform Infrared (FTIR) Spectroscopy to analyze chemical structure changes.
Protocol: Assessing Stability to Heat Sterilization
This protocol evaluates the impact of standard autoclave cycles on polymeric materials [105] [106].
- Pre-Sterilization Characterization: Characterize samples for key properties, including:
- Mechanical Properties: Tensile strength, flexural strength.
- Thermal Properties: Glass transition temperature (Tg) and melting point (Tm) via Differential Scanning Calorimetry (DSC).
- Morphology: Molecular weight and distribution via Gel Permeation Chromatography (GPC), and chemical structure via FTIR.
- Sterilization: Subject samples to a standard moist heat sterilization cycle in an autoclave: 121°C, 15 minutes, 115 kPa (saturated steam). For dry heat, use the appropriate time-temperature profile.
- Conditioning: Allow samples to cool and equilibrate to ambient conditions overnight.
- Post-Sterilization Characterization: Repeat the same analyses performed in Step 1 on the sterilized samples.
- Comparison: Compare pre- and post-sterilization data to identify significant changes, such as molecular weight degradation (indicating chain scission), changes in thermal transitions, or loss of mechanical integrity.
The Scientist's Toolkit: Essential Research Reagents and Materials
Table 4: Key Reagents and Materials for Polymer Stability Research
| Reagent/Material | Function in Research |
|---|---|
| Poly(lactic acid) (PLA) | A semi-crystalline model polymer for studying long-term biodegradation and sterilization stability [106] [107]. |
| Poly(lactic-co-glycolic acid) (PLGA) | A copolymer used to study the effect of crystallinity (via LA:GA ratio) on degradation kinetics [107]. |
| Phosphate-Buffered Saline (PBS) | A standard aqueous medium for in-vitro degradation studies, simulating the ionic strength and pH of physiological fluids [107]. |
| Poly(trimethylene carbonate) (PTMC) | An amorphous aliphatic polycarbonate model for studying surface erosion degradation mechanisms [109]. |
| Sn(Oct)₂ | A catalyst used in the ring-opening polymerization (ROP) of monomers like TMC and DTC to synthesize copolymers with tailored properties [109]. |
| Glutaraldehyde (GA) | A crosslinking agent used to control polymer chain mobility and crystallinity in hydrogel matrices like PVA [61]. |
| Tetraethyl orthosilicate (TEOS) | An inorganic crosslinker used in tandem with GA to fine-tune polymer network interactions and material properties [61]. |
The optical properties of polymeric materials, particularly their transparency and opacity, are of paramount importance across a diverse range of industries, from pharmaceutical packaging and medical devices to optoelectronics and display technologies [110]. These properties are not merely superficial characteristics but are fundamentally governed by the internal microstructure of the polymer—specifically, the arrangement of its long-chain molecules and the resulting density variations [1] [110]. The primary structural dichotomy in polymers lies between amorphous and semi-crystalline states, each imparting distinct optical behaviors [1] [4]. This whitepaper provides an in-depth technical examination of the relationship between polymer structure, density, and optical properties, framed within the context of advanced materials research for scientific and drug development professionals. It consolidates fundamental principles, quantitative data, standardized experimental protocols, and essential research tools to facilitate the selection, development, and characterization of polymer systems with tailored optical performance.
Fundamental Principles: Polymer Morphology and Light Interaction
Amorphous vs. Crystalline Polymer Structures
The high molecular weight of polymers leads to complex chain arrangements, classified primarily as amorphous or semi-crystalline [1].
Amorphous Polymers: In amorphous morphology, polymer atoms are held together in a loose, disordered structure that lacks long-range order [1]. This structure is often analogized to a pile of randomly intertwined, cooked spaghetti [1]. This irregular packing results in relatively uniform density throughout the material. Above their glass transition temperature (Tg), these entangled chains gain mobility, transitioning from a hard, glassy state to a soft, rubbery one [1]. This molecular-level disorder is the key to their optical clarity.
Semi-Crystalline Polymers: In contrast, semi-crystalline polymers exhibit a mixed morphology consisting of organized, folded chain stacks known as lamellae (crystalline regions) embedded within a disordered amorphous matrix [1]. The lamellae bring long-range order to the polymer, akin to the orderly arrangement of atoms in typical crystals [1]. The extent of this organization is quantified by the degree of crystallinity, which ranges from 0% (entirely amorphous) to 100% (entirely crystalline), though most practical polymers are semi-crystalline [1].
The Physics of Light Transmission and Scattering
The interaction of light with a polymer's microstructure determines its optical clarity [111].
Transparency in Amorphous Polymers: Amorphous polymers are typically transparent because their molecular structure is homogeneous on a scale smaller than the wavelength of visible light. This uniformity means there are no significant density fluctuations to scatter light, allowing it to pass through with minimal deviation [110] [111]. The light travels easily through them, resulting in high transmittance [110].
Opacity and Translucency in Semi-Crystalline Polymers: Semi-crystalline polymers are often translucent or opaque due to light scattering [110]. The crystalline lamellae and the surrounding amorphous matrix have different densities and, consequently, different refractive indices [110]. When light encounters an interface between these two phases (e.g., the boundary of a spherulite), its path is altered through scattering, diffusing the light and reducing clarity. As the percentage of crystallinity increases, scattering intensifies, and the polymer becomes progressively less clear [110].
The following diagram illustrates the logical relationship between polymer structure, density, and the resulting optical properties.
Quantitative Data: Light Transmittance of Polymers
The transparency of plastics is quantitatively characterized by light transmittance, reported as the percentage of incident light transmitted through a standardized specimen [110]. The following table summarizes the transmittance ranges for common amorphous and semi-crystalline polymers, providing a critical dataset for material selection.
Table 1: Light Transmittance Values of Selected Polymers
| Polymer Name | Polymer Type | Min Transmittance (%) | Max Transmittance (%) | Key Characteristics |
|---|---|---|---|---|
| PMMA (Acrylic) | Amorphous | 80 | 93 | Excellent clarity, high impact resistance, glass alternative [110]. |
| Polycarbonate (PC) | Amorphous | 88 | 89 | High impact strength, high heat resistance, used in safety glass [110]. |
| PS (Polystyrene) | Amorphous | 88 | 92 [110] | General-purpose clarity, used in appliances and packaging [110]. |
| COC (Cyclic Olefin Copolymer) | Amorphous | 91 | 91 | High purity, excellent light transmission, used in medical devices [110]. |
| PET (Polyethylene Terephthalate) | Semi-Crystalline | 70 | 90 | Clarity achievable in bi-axially oriented films (e.g., bottles) [110]. |
| PETG | Semi-Crystalline | 88 | 91 | Glycol-modified PET for improved clarity and processability [110]. |
| HDPE | Semi-Crystalline | 80 | 80 | Translucent to opaque due to high crystallinity [110]. |
| Polypropylene (PP) | Semi-Crystalline | 85 | 90 | Can be clarified with additives; otherwise translucent [110]. |
Factors Influencing Polymer Transparency
Beyond the fundamental distinction of crystallinity, several other factors critically influence the optical properties of polymers [110]:
- Additives and Pigments: Colorants, fillers, and other additives can drastically reduce clarity by scattering or absorbing light. Transparent polymers typically require high purity with minimal additives, though specific clarifiers can be used in semi-crystalline polymers like PP to refine crystal size and improve clarity [110].
- Processing Methods and Conditions: Techniques like quenching (rapid cooling) can freeze a polymer in a more amorphous state, reducing crystallinity and enhancing clarity. Conversely, slow cooling can promote crystal growth, increasing opacity [110]. Methods such as extrusion, injection molding, and casting must be carefully controlled to minimize imperfections that cause haze [110].
- Surface Quality and Contaminants: Any surface roughness, defects from machining or molding, or particulate contamination (e.g., dust, residual catalysts) will scatter light, reducing optical clarity. Smooth, highly polished surfaces are essential for optimal transparency [110].
- Structural Regularity and Orientation: As evidenced by bi-axially oriented PET and PP films, molecular chain orientation in the plane of the film can reduce light refraction, resulting in high transparency even in crystalline polymers [110].
Experimental Protocols for Characterization
Measuring Haze and Luminous Transmittance (ASTM D1003)
This is the primary standard test method for determining the light-transmitting and light-scattering properties of transparent plastics [110].
- Principle: The method evaluates the deviation of a light beam from its original path as it passes through a plastic specimen. It measures two key parameters:
- Luminous Transmittance: The percentage of incident light that is transmitted through the material.
- Haze: The percentage of transmitted light that is scattered by more than a specified angle (2.5°). Materials with haze greater than 30% are considered diffusing [110].
- Procedure:
- Apparatus: A hazemeter or a spectrophotometer with an integrating sphere.
- Specimen Preparation: Planar sections of material of specified thickness (often 1-3 mm) are cut and cleaned to avoid surface contamination.
- Measurement (Procedure A - Hazemeter):
- Calibrate the instrument with the light trap and the standard reflectance plate.
- Place the specimen in the test beam and measure the total transmitted light (T2).
- With the specimen still in place, measure the light scattered by the instrument (T3).
- Remove the specimen and measure the light scattered by the instrument (T1).
- Use the formula to calculate Haze: Haze = [ (T4 / T2) - (T3 / T1) ] * 100%.
- Data Application: The data is crucial for quality control, specification purposes, and comparing the optical performance of different polymer grades or processing conditions [110].
UV-Visible Spectroscopy for Absorption and Band Gap
This technique measures the absorption of light in the ultraviolet and visible regions, providing information on electronic transitions and enabling the estimation of the optical band gap [112] [111].
- Principle: The Beer-Lambert Law (A = εbc) describes the relationship between the absorption of light (A), the molar attenuation coefficient (ε), the path length (b), and the concentration of the absorbing species (c) [111].
- Procedure:
- Sample Preparation: A thin, uniform film of the polymer is prepared via compression molding, solution casting, or other methods. The film thickness must be known and consistent.
- Baseline Correction: A background scan is run with an empty holder or a reference sample.
- Spectral Acquisition: The polymer film is placed in the spectrometer, and its absorbance (or transmittance) is measured across a wavelength range (e.g., 200-800 nm).
- Data Analysis:
- The absorption coefficient (α) is calculated from the absorbance data.
- Tauc's Model is applied to estimate the optical band gap (Eg) by plotting (αhν)1/n vs. photon energy (hν), where n depends on the nature of the electron transition (n=1/2 for direct and n=2 for indirect band gaps) [113] [112]. The linear portion of the plot is extrapolated to the energy axis to determine Eg.
- The optical dielectric loss parameter (ε") is also used in conjunction with Tauc's plot to accurately specify the type of electron transition and estimate the optical band gap [113] [112].
The workflow for a comprehensive optical characterization study is outlined below.
The Scientist's Toolkit: Essential Research Reagents and Materials
Table 2: Key Research Reagents and Materials for Polymer Optical Studies
| Item | Function / Role in Research |
|---|---|
| Polymer Hosts (PEO, PMMA, PVA) | Serve as the base matrix for solid polymer electrolytes and optical studies. Their polarity and chain flexibility are crucial for ion coordination and optical clarity [112]. |
| Lithium Salts (LiX, X=I, ClO₄, CF₃SO₃) | Dissolved in polymer hosts to form polymer-salt complexes (solid electrolytes). The salt type and concentration can influence crystallinity and optical properties [112]. |
| Inorganic Nanofillers (ZnO, TiO₂, CdS) | Incorporated into the polymer matrix to form nanocomposites. Used to manipulate optical absorption, decrease the optical band gap, and enhance specific optical characteristics for optoelectronic applications [112]. |
| Metal Complexes / Dopants | Act as modifiers to tune the optical and electrical properties of the polymer system. Their type and concentration are key factors in altering the system's identity, such as shifting absorption edges [112]. |
| Photoinitiators | Critical for UV-curing processes in stereolithography-based 3D printing and polymer synthesis. They generate reactive species upon light exposure to initiate polymerization [15]. |
| Clarifiers / Nucleating Agents | Additives used specifically in semi-crystalline polymers (e.g., PP) to control crystal size and growth. They improve clarity by reducing spherulite size, thereby minimizing light scattering [110]. |
The selection of polymers for biomedical applications—ranging from implantable devices and drug delivery systems to surgical instruments and tissue engineering scaffolds—is critically dependent on a fundamental understanding of polymer morphology. The dichotomy between amorphous and semi-crystalline structures represents a core determinant of material performance, directly influencing mechanical integrity, degradation profiles, biocompatibility, and processing requirements [3] [1]. Within the context of a broader thesis on polymer structures, this guide provides a technical framework for researchers and drug development professionals to navigate this complex selection landscape. The global biomedical polymers market, projected to grow from USD 25,713.70 million in 2025 to USD 49,474.4 million by 2032 at a CAGR of 9.8%, underscores the strategic importance of these material decisions [114].
At the molecular level, the distinction is defined by chain arrangement. Semi-crystalline polymers exhibit regions where molecular chains are folded and packed into an orderly, repeating lattice structure, forming lamellae and larger spheroidal structures known as spherulites [32]. These ordered, crystalline zones coexist with disordered amorphous regions, and the proportion of crystalline material is defined as the degree of crystallinity, typically ranging from 10% to 80% for most thermoplastics [32] [115]. In contrast, amorphous polymers possess molecular chains that are arranged in a random, disordered manner, lacking any long-range order and often described as resembling a tangled mass of cooked spaghetti [1] [4]. This fundamental difference in microstructure is the origin of the divergent properties observed in these two classes of materials.
Key Performance Indicators: A Comparative Analysis
The following tables summarize the key performance indicators (KPIs) for common biomedical polymers, segmented by their morphological classification. These KPIs are critical for matching material properties to application-specific requirements.
Table 1: Performance Indicators of Common Semi-Crystalline Biomedical Polymers
| Polymer (Abbreviation) | Key Biomedical Applications | Tensile Strength & Stiffness | Impact & Wear Resistance | Thermal Properties (Tm °C) | Chemical Resistance | Optical Properties | Biodegradability |
|---|---|---|---|---|---|---|---|
| Polyether Ether Ketone (PEEK) | Trauma plates, orthopedic implants, surgical instruments [60] | High strength and stiffness [3] [60] | Excellent wear and fatigue resistance [60] | Tm ~343°C [3] | Excellent [3] [60] | Opaque [60] | Non-biodegradable |
| Ultra-High Molecular Weight Polyethylene (UHMWPE) | Artificial joints, wear-resistant components [3] | High impact resistance [3] | Exceptional wear resistance [3] | - | - | Opaque | Non-biodegradable |
| Polypropylene (PP) | Medical packaging, disposable syringes, sutures [4] | Good toughness and stiffness [4] | Good chemical resistance [4] | Tm ~174°C (Isotactic) [1] | Excellent chemical resistance [4] | Opaque (Isotactic) [1] | Non-biodegradable |
| Polyamide (Nylon, PA) | - | High mechanical strength [3] | Good wear resistance [4] | Tm ~255°C (PA66) [3] | Good [3] | Opaque | Varies (e.g., some polyamides are biodegradable) |
| Polylactic Acid (PLA) | Sutures, drug delivery systems, tissue engineering scaffolds [116] | High strength, but brittle [116] | - | - | - | Opaque | Biodegradable [116] |
Table 2: Performance Indicators of Common Amorphous Biomedical Polymers
| Polymer (Abbreviation) | Key Biomedical Applications | Tensile Strength & Stiffness | Impact & Wear Resistance | Thermal Properties (Tg °C) | Chemical Resistance | Optical Properties | Biodegradability |
|---|---|---|---|---|---|---|---|
| Polyetherimide (PEI) | Aerospace, medical applications for heat resistance and transparency [3] | - | - | Tg ~215°C [3] | - | Transparent [3] | Non-biodegradable |
| Polyvinyl Chloride (PVC) | Medical tubing, blood bags, IV containers [3] | Flexible [3] | - | Tg ~85°C [3] | More prone to chemical attack [3] | Transparent [115] | Non-biodegradable |
| Polystyrene (PS, Atactic) | Petri dishes, test tubes, diagnostic components [1] | - | - | Tg ~100°C [1] | Poor chemical resistance [3] | Transparent [1] | Non-biodegradable |
| Polycarbonate (PC) | Safety glasses, medical device housings, transparent shields [4] | - | High impact resistance [4] | - | Limited chemical resistance [4] | High transparency [4] | Non-biodegradable |
| Poly(methyl methacrylate) (PMMA) | Intraocular lenses, bone cement, dental applications [1] | Rigid [1] | - | Tg ~120°C [1] | - | High transparency [1] | Non-biodegradable |
Interpretation of Comparative Data
The data in the tables reveals clear property patterns stemming from morphological differences:
- Mechanical Performance: Semi-crystalline polymers generally exhibit superior mechanical strength, stiffness, and resistance to creep due to the reinforcing effect of densely packed crystalline domains [3] [60]. These crystalline regions also act as physical cross-links, providing excellent wear and fatigue resistance, making polymers like PEEK and UHMWPE ideal for bearing surfaces and articulating implants [60]. Amorphous polymers, conversely, are typically more flexible and exhibit higher impact resistance at room temperature, as their disordered chains can absorb energy without fracturing [4].
- Thermal Behavior: A defining characteristic of semi-crystalline polymers is a sharp melting point (Tm), as thermal energy must overcome the organized intermolecular forces in the crystalline lattices [3] [1]. Above their glass transition temperature (Tg), they retain significant mechanical properties because the crystalline regions remain intact [60]. Amorphous polymers lack a melting point; instead, they gradually soften over a temperature range, transitioning from a hard, glassy state to a soft, rubbery state at their glass transition temperature (Tg) [1].
- Chemical and Solvent Resistance: The tight molecular packing in crystalline regions creates a formidable barrier, granting semi-crystalline polymers excellent resistance to solvents and chemicals [3] [60]. Amorphous polymers, with their more open and disordered structure, are generally more susceptible to chemical attack and solvent penetration, which can lead to swelling and stress cracking [3] [4].
- Optical Properties: The interfaces between crystalline and amorphous regions within a semi-crystalline polymer scatter light, rendering these materials typically opaque or translucent [60] [115]. The homogeneous structure of amorphous polymers does not scatter light to the same degree, allowing many to be highly transparent [1] [4].
Experimental Protocols for Characterizing Polymer Morphology
Accurate characterization of polymer morphology is essential for quality control and predicting in-service performance. The following section details standard experimental methodologies.
Determining Degree of Crystallinity
1. Differential Scanning Calorimetry (DSC)
- Principle: DSC measures the heat flow into or out of a sample as a function of temperature or time, compared to a reference. The enthalpy of fusion (ΔHf) measured during melting is directly proportional to the degree of crystallinity.
- Protocol:
a. Sample Preparation: Precisely weigh (5-10 mg) a sample of the polymer and seal it in an aluminum crucible.
b. Experimental Run: Subject the sample to a controlled temperature program, typically: (1) Heat from room temperature to above its melting point (e.g., 50°C to 400°C for PEEK) to erase thermal history. (2) Cool to below its Tg at a controlled rate. (3) Re-heat to above Tm.
c. Data Analysis: From the second heating curve, integrate the area under the melting endotherm peak to determine ΔHf (J/g). The degree of crystallinity (Xc) is calculated as:
Xc (%) = (ΔHf, sample / ΔHf, 100% crystalline polymer) × 100
where ΔHf, 100% crystalline polymer is a theoretical value from literature [32].
2. Density Gradient Column
- Principle: Crystalline regions have a higher density (ρc) than amorphous regions (ρa). The overall density of a semi-crystalline polymer is a weighted average of the two.
- Protocol:
a. Column Preparation: Create a density gradient in a tall glass column using two miscible liquids of different densities (e.g., isopropanol and water).
b. Calibration: Use glass floats of known density to calibrate the column.
c. Measurement: Place a small, non-porous polymer sample into the column and allow it to equilibrate. Record its height and determine its density (ρ) from the calibration curve.
d. Data Analysis: Calculate the degree of crystallinity (Xc) using:
Xc (%) = [(ρ - ρa) / (ρc - ρa)] × (ρc / ρ) × 100
where ρc and ρa are the densities of the purely crystalline and purely amorphous phases, respectively [32].
3. X-Ray Diffraction (XRD) - Principle: XRD detects the sharp diffraction peaks produced by crystalline planes and the broad halos from amorphous regions. - Protocol: a. Sample Preparation: Prepare a flat, uniform film or powder sample. b. Experimental Run: Expose the sample to a monochromatic X-ray beam (e.g., Cu Kα radiation) and scan through a range of diffraction angles (2θ). c. Data Analysis: Deconvolute the resulting diffractogram into crystalline peaks and an amorphous background. The degree of crystallinity is estimated from the ratio of the area under the crystalline peaks to the total scattered intensity [32].
Assessing Mechanical Performance
1. Tensile Testing - Principle: This test measures a material's response to tensile loading. It is crucial for applications like sutures and load-bearing implants. - Protocol: a. Sample Preparation: Machine or mold polymer samples into standard "dog-bone" shapes (per ASTM D638 or ISO 527). b. Experimental Run: Clamp the sample in a universal testing machine and apply a uniaxial tensile force at a constant crosshead speed until failure. c. Data Analysis: Generate a stress-strain curve. Key outputs include: Young's Modulus (stiffness), Tensile Strength at Yield (onset of plastic deformation), Tensile Strength at Break, and Elongation at Break (ductility) [72].
2. Dynamic Mechanical Thermal Analysis (DMTA) - Principle: DMTA applies a oscillating stress to a sample and measures the resulting strain, determining the complex modulus and mechanical damping (tan δ) as functions of temperature. - Protocol: a. Sample Preparation: Prepare a sample of defined geometry (e.g., a rectangular bar). b. Experimental Run: Clamp the sample and subject it to a small, sinusoidal deformation while heating it at a constant rate over a wide temperature range (e.g., -150°C to 300°C). c. Data Analysis: Identify the glass transition temperature (Tg) from the peak in the tan δ curve or the onset of the drop in the storage modulus (E'). This technique is particularly sensitive for detecting secondary relaxations in amorphous regions and evaluating the polymer's viscoelastic behavior [72].
Structural Relationships and Experimental Workflow
The logical relationship between polymer structure, characterization, and resulting properties is fundamental to material selection. The following diagrams visualize these core concepts.
Structure-Property Relationship in Biomedical Polymers
Workflow for Polymer Characterization & Selection
The Scientist's Toolkit: Essential Research Reagents and Materials
Successful research and development in biomedical polymers require a suite of specialized materials and analytical tools. The following table details key components of the research toolkit.
Table 3: Essential Research Toolkit for Biomedical Polymer Analysis
| Item | Function & Application in Research |
|---|---|
| Differential Scanning Calorimeter (DSC) | Determines thermal transitions (Tg, Tm, crystallization temperature) and quantifies the degree of crystallinity from the enthalpy of fusion [32]. |
| X-Ray Diffractometer (XRD) | Identifies crystalline phases, analyzes crystal structure, and provides an estimate of the degree of crystallinity and crystal size [32]. |
| Universal Testing Machine | Measures fundamental mechanical properties (tensile, compressive, and flexural strength, modulus, elongation) per ASTM/ISO standards [72]. |
| Dynamic Mechanical Analyzer (DMA/DMTA) | Characterizes the viscoelastic properties (storage/loss modulus, tan δ) as a function of temperature, revealing Tg and sub-Tg relaxations critical for amorphous polymers [72]. |
| Density Gradient Column | A cost-effective tool for determining sample density, which can be used to calculate the degree of crystallinity [32]. |
| FTIR Spectrometer | Identifies chemical functional groups and can monitor changes in molecular conformation or crystallinity. |
| Biocompatibility Test Kits | Includes reagents for in vitro cytotoxicity (e.g., MTT assay), hemocompatibility, and genotoxicity testing per ISO 10993 standards. |
| Buffer Solutions (various pH) | Used for in vitro degradation studies and chemical resistance testing to simulate physiological or aggressive environments. |
| Sterilization Equipment | Autoclaves (steam), ethylene oxide (EtO) chambers, or gamma irradiators for studying the effect of sterilization on polymer properties. |
The strategic selection of biomedical polymers is a multidisciplinary exercise that hinges on a deep understanding of the amorphous versus semi-crystalline paradigm. As demonstrated, semi-crystalline polymers offer a robust profile of mechanical strength, thermal resistance, and chemical inertness, making them indispensable for permanent, load-bearing implants. Amorphous polymers, with their transparency, formability, and impact resistance, provide critical solutions for disposable medical components, packaging, and transparent devices. The ongoing growth of the biomedical polymers market, fueled by trends in minimally invasive surgery, personalized medicine, and sustainable materials, will continue to demand rigorous characterization and intelligent application of these fundamental structure-property relationships. By leveraging the comparative KPIs, standardized experimental protocols, and research tools outlined in this guide, scientists and engineers can make informed, data-driven decisions to advance the next generation of biomedical technologies.
The fundamental division of polymers into amorphous and crystalline states is a cornerstone of materials science, directly dictating their mechanical, thermal, and chemical properties [117]. In crystalline regions, polymer chains are arranged in a highly ordered, repeating lattice structure, providing strength and stability. Amorphous regions, characterized by randomly entangled chains, contribute to flexibility and impact resistance [118]. Most high-performance polymers are semi-crystalline, containing a mixture of both phases, and the precise ratio and arrangement of these phases are critical for material performance [119] [118].
For researchers and drug development professionals, mastering the analytical techniques that characterize these structures is paramount. This guide provides an in-depth examination of four pivotal techniques—Differential Scanning Calorimetry (DSC), Dynamic Mechanical Analysis (DMA), X-ray Diffraction (XRD), and Fourier Transform Infrared (FTIR) Spectroscopy. These methods form an integrated toolkit for validating polymer structure, informing processing parameters, troubleshooting product failures, and ensuring material consistency in applications from biomedical devices to pharmaceutical formulations [120] [121] [122].
Fundamental Principles: Amorphous vs. Crystalline Polymers
Structural and Property Differences
The atomic-level structure of a polymer dictates its macroscopic behavior and suitability for specific applications. Table 1 summarizes the core distinctions between amorphous and crystalline phases and their implications for analysis.
Table 1: Core Characteristics of Amorphous and Crystalline Polymer Phases
| Characteristic | Crystalline Phase | Amorphous Phase |
|---|---|---|
| Atomic Structure | Long-range, repeating order [117] | Short-range order, random chains [117] |
| XRD Signature | Sharp Bragg peaks [118] | Broad "halo" or diffuse hump [118] |
| DSC Response | Sharp melting endotherm (T_m) [122] |
Glass transition step-change (T_g) [122] |
| DMA Profile | High storage modulus below T_m |
Significant drop in storage modulus at T_g |
| Typical Properties | Opaque, rigid, chemically resistant [117] | Transparent, ductile, higher impact strength [117] |
The Critical Role of Semi-Crystalline Structure
Most polymers used in advanced applications are semi-crystalline. Their properties are determined not just by the simple amorphous-crystalline ratio, but by more complex morphological factors such as spherulite size, crystalline perfection, and the nature of the interfacial regions [119]. Manufacturing processes like Laser-Assisted Tape Placement (LATP) or Fused Filament Fabrication (FFF) can create complex crystallinity gradients, where the cooling rate differs dramatically through a part's thickness, leading to heterogeneous properties [119]. Such gradients can be characterized using high-spatial-resolution techniques like micro-FTIR and nanoindentation to correlate local thermal history with crystallinity [119].
Technique 1: Differential Scanning Calorimetry (DSC)
Principles and Measurable Parameters
DSC operates by measuring the heat flow difference between a sample and an inert reference as they are subjected to a controlled temperature program [122]. This allows for the direct quantification of heat flows associated with thermal transitions.
Key parameters measured by DSC include:
- Glass Transition Temperature (
T_g): A reversible step-change in heat capacity, observed as an endothermic shift in the baseline, indicating the onset of molecular motion in amorphous regions [122]. - Melting Temperature (
T_m) and Enthalpy (ΔH_f): A sharp endothermic peak where theT_mis the peak temperature and the integrated area under the peak gives theΔH_f, indicative of the energy required to melt the crystalline phase [122]. - Crystallization Temperature (
T_c) and Enthalpy (ΔH_c): An exothermic peak observed upon cooling from the melt, representing the heat released as polymer chains order into a crystalline lattice [122]. - Percent Crystallinity: Calculated by comparing a sample's measured
ΔH_fto theΔH_fof a 100% crystalline reference material:% Crystallinity = (ΔH_f,sample / ΔH_f,reference) × 100[122]. - Heat Capacity (
C_p): The intrinsic amount of heat required to raise a material's temperature, directly measurable by advanced DSC [122].
Experimental Protocol for Polymer Characterization
Table 2: Standard DSC Experiment Protocol for Semi-Crystalline Polymers
| Step | Parameter | Typical Setting | Purpose & Rationale |
|---|---|---|---|
| 1. Sample Prep | Mass | 3-10 mg | Ensures uniform heat transfer and avoids thermal lag. |
| Form | Thin film or powder | Maximizes surface area for consistent thermal response. | |
| Pan | Hermetically sealed aluminum | Prevents volatile loss and suppresses oxidative degradation. | |
| 2. Calibration | Temperature & Enthalpy | Indium standard | Verifies accuracy of T_m and ΔH_f measurements. |
| 3. Method | Step 1: Equilibrate | 0°C | |
| Step 2: Heat (1st) | 0°C to 300°C at 10°C/min | Purpose: Erase thermal history, observe T_g, T_m, ΔH_f. |
|
| Step 3: Cool | 300°C to 0°C at 10°C/min | Purpose: Observe crystallization exotherm (T_c, ΔH_c). |
|
| Step 4: Heat (2nd) | 0°C to 300°C at 10°C/min | Purpose: Analyze "history-free" material; measure T_g and T_m without prior crystallization effects. |
|
| 4. Data Analysis | T_g |
Onset/Midpoint of step-change | |
T_m, T_c |
Peak of endotherm/exotherm | ||
ΔH_f, ΔH_c |
Area under the peak |
Advanced DSC Techniques
Modulated DSC (MDSC) applies a sinusoidal temperature oscillation over the underlying heating rate, deconvoluting the total heat flow into reversing (heat capacity-related, e.g., T_g) and non-reversing (kinetic, e.g., curing, evaporation) components [122]. This is particularly powerful for resolving overlapping transitions, such as separating an enthalpy relaxation peak (physical aging) from the T_g event in amorphous polymers [122].
Figure 1: Identifying Transitions in a Semi-Crystalline Polymer (PET) via DSC
Technique 2: Dynamic Mechanical Analysis (DMA)
Principles and Measurable Parameters
DMA characterizes a material's viscoelastic properties by applying a small, oscillatory stress or strain while varying temperature. It is exceptionally sensitive to molecular motions, particularly glass transitions and secondary relaxations [123].
Key parameters from DMA include:
- Storage Modulus (
E'orG'): The elastic component, representing energy stored and recovered per cycle, indicating material stiffness. - Loss Modulus (
E''orG''): The viscous component, representing energy dissipated as heat, indicating damping. - Tan Delta (
tan δ): The ratioE''/E', a highly sensitive indicator of molecular relaxations, with peaks corresponding to transition temperatures like theT_g[123].
Experimental Protocol for Polymer Characterization
Table 3: Standard DMA Experiment Protocol for Polymer Films
| Step | Parameter | Typical Setting | Purpose & Rationale |
|---|---|---|---|
| 1. Sample Prep | Dimensions | Exact measurement critical (e.g., 20mm x 10mm x 0.1mm) | Modulus calculation is directly dependent on sample geometry. |
| Form | Film, bar, or fiber | Must be self-supporting for tension or bending clamps. | |
| 2. Calibration | Force, Displacement, Temperature | Per instrument specification | |
| 3. Method | Deformation Mode | Tension or film tension | Suitable for thin, flexible films. Clamps must be tight. |
| Frequency | 1 Hz | Standard frequency for screening T_g. |
|
| Strain Amplitude | 0.1% (within LVR) | Ensures the measurement is in the Linear Viscoelastic Region. | |
| Temperature Scan | -100°C to 150°C at 2°C/min | Wide range to capture sub-T_g relaxations and T_g. |
|
| 4. Data Analysis | T_g from E'' |
Peak of loss modulus | Often considered the most accurate T_g. |
T_g from tan δ |
Peak of tan delta | Most sensitive, but peak is frequency-dependent. |
DMA has been successfully applied to complex systems, including woody lignocellulosic biomasses, to probe the effect of water and oil content on molecular relaxation [123]. It can also monitor reversible transitions between amorphous states in coordination polymers induced by mechanical shear forces [124].
Technique 3: X-Ray Diffraction (XRD)
Principles and Measurable Parameters
XRD is based on Bragg's Law (nλ = 2d sinθ), where constructive interference of X-rays scattered by crystalline planes produces a diffraction pattern [118]. This pattern is a fingerprint of the atomic arrangement.
Key analytical uses of XRD include:
- Phase Identification: Matching diffraction peak positions and intensities to reference patterns in crystallographic databases [117] [118].
- Crystallinity Determination: Differentiating and quantifying the amorphous and crystalline fractions in a semi-crystalline polymer by deconvoluting the broad amorphous halo and sharp crystalline peaks [118].
- Crystal Structure Analysis: Determining unit cell parameters and, in some cases, solving the full crystal structure [118].
- Preferred Orientation (Texture) Analysis: Detecting non-random alignment of crystallites, often induced by processing like extrusion or drawing, using 2D detectors [118].
Experimental Protocol for Polymer Characterization
Table 4: Standard XRD Experiment Protocol for Polymer Powders and Films
| Step | Parameter | Typical Setting / Consideration | Purpose & Rationale |
|---|---|---|---|
| 1. Sample Prep | Powder | Fine grind, ensure random orientation | Avoids preferred orientation for accurate phase ID/crystallinity. |
| Film | Flat, smooth surface; mount consistently | Critical for texture analysis. | |
| 2. Instrument Setup | X-ray Source | Cu Kα (λ = 1.54 Å) | Most common for organic materials. |
| Scan Range (2θ) | 5° to 40° | Captures key diffraction features of polymers. | |
| Step Size | 0.02° | Good balance of resolution and time. | |
| 3. Data Collection | Time per Step | 1-2 seconds | Longer times for weak signals (low crystallinity). |
| Sample Rotation | If available | Averages out preferred orientation effects. | |
| 4. Data Analysis | Phase ID | Peak matching to ICDD database | |
| Crystallinity | Peak fitting to separate amorphous halo & crystalline peaks | Crystallinity = Area_crystalline / (Area_crystalline + Area_amorphous) |
|
| Crystallite Size | Scherrer equation (Size = Kλ / (FWHM cosθ)) |
Estimates average crystallite size from peak broadening. |
Figure 2: XRD Patterns for Different Polymer Morphologies
Technique 4: Fourier Transform Infrared (FTIR) Spectroscopy
Principles and Measurable Parameters
FTIR spectroscopy identifies chemical functional groups and bonds by measuring the absorption of infrared light at frequencies specific to molecular vibrations [120] [121]. The resulting spectrum is a chemical fingerprint of the material.
Key applications in polymer characterization include:
- Chemical Structure Identification: Confirming the presence of expected functional groups (e.g., carbonyl, amine, ether) and identifying unknown polymers or contaminants [121].
- Monitoring Reactions: Tracking the disappearance of reactant groups (e.g., isocyanates) and the appearance of product groups (e.g., urethanes) during polymerization [121].
- Crystallinity Assessment: Detecting subtle peak shifts, intensity changes, or band splitting that correspond to stable molecular conformations in crystalline regions [119]. For instance, the crystalline-sensitive bands in PEEK can be monitored [119].
- Interpenetrating Polymer Network (IPN) Analysis: Identifying physical entanglements (e.g., hydrogen bonding) between networks through peak shifts or broadening, confirming IPN formation [120].
Experimental Protocol for Polymer Characterization
Table 5: Standard FTIR Experiment Protocol for Polymer Films
| Step | Parameter | Typical Setting / Consideration | Purpose & Rationale |
|---|---|---|---|
| 1. Sample Prep | ATR-FTIR | Solid film pressed onto crystal | Most common, minimal preparation. |
| Transmission | Thin, uniform film (~50-100 µm) | Film must be thin enough to avoid total IR absorption. | |
| 2. Instrument Setup | Spectral Range | 4000 - 400 cm⁻¹ (Mid-IR) | Captures fundamental vibrations. |
| Resolution | 4 cm⁻¹ | Standard for polymer analysis. | |
| Scans | 32-64 | Averages scans to improve signal-to-noise ratio. | |
| 3. Data Collection | Background | Collect before sample scan | Removes contributions from air and instrument. |
| 4. Data Analysis | Peak Assignment | Identify functional groups | Compare to known spectra/libraries. |
| Crystallinity | Monitor specific peak ratios | Requires calibration with standards of known crystallinity. | |
| Deformation | Compare spectra before/after | Identify chain orientation or degradation. |
Integrated Approach: A Multi-Technique Workflow for Validation
No single technique provides a complete picture. Validating the amorphous versus crystalline nature of a polymer requires a synergistic, multi-technique approach where data from each method corroborates and enriches the findings from the others.
Figure 3: Multi-Technique Workflow for Polymer Structure Validation
A powerful application of this integrated approach is found in characterizing crystallinity gradients in carbon black-filled PEEK laminates manufactured by laser-assisted processes [119]. A suggested workflow could be:
- Use Polarized Optical Microscopy (POM) or SEM on polished cross-sections to qualitatively identify potential low-crystallinity zones [119].
- Employ nanoindentation across the thickness to map mechanical properties (hardness, reduced modulus) with high spatial resolution, validating the presence of a gradient suggested by microscopy [119].
- Quantify the crystallinity gradient using micro-FTIR spectroscopy, which offers better signal quality than Raman for this material and a spatial resolution of several tens of microns, sufficient to probe the gradient [119].
- Correlate these findings with DSC measurements on successive thin layers sectioned via microtomy, providing a bulk-averaged crystallinity value for each layer to confirm the quantitative difference through the thickness [119].
The Scientist's Toolkit: Essential Research Reagents and Materials
Table 6: Essential Materials for Polymer Characterization Experiments
| Item / Reagent | Function / Application | Technical Notes |
|---|---|---|
| Indium Standard | Calibration of DSC temperature and enthalpy [122] | High-purity (99.99+%); known sharp melting point (156.6°C) and enthalpy of fusion. |
| Hermetic Aluminum pans & Lids | Encapsulating samples for DSC [122] | Prevents volatilization during heating; can be sealed cold or crimped. |
| ATR Crystal (Diamond) | Sample substrate for FTIR [120] | Robust, chemically inert; suitable for a wide range of solid polymers. |
| Silicon Standard | Angle calibration for XRD [118] | Provides a sharp, well-defined diffraction pattern for accurate 2θ alignment. |
| Cryogenic Grinder | Sample preparation for XRD and DSC [118] | Pulverizes tough/elastic polymers into fine powder for random orientation analysis. |
| Inert Gas (N₂) | Purging atmosphere for TGA/DSC/DMA [123] | Prevents oxidative degradation during high-temperature experiments. |
DSC, DMA, XRD, and FTIR are indispensable, complementary tools for the rigorous validation of amorphous and crystalline structures in polymers. DSC and DMA provide unparalleled insight into thermal transitions and mechanical relaxations, XRD directly probes long-range atomic order, and FTIR reveals chemical structure and short-range order. By applying these techniques within an integrated workflow, researchers and drug development professionals can decisively link synthetic routes and processing conditions to final material properties, enabling the rational design of advanced polymeric materials for the most demanding applications.
Conclusion
The distinction between amorphous and crystalline polymers is not merely academic but foundational to their application in advanced drug delivery and biomedical engineering. Amorphous polymers, with their lack of long-range order and defined glass transition, offer advantages in solubility, transparency, and ease of processing for certain drug formulations. In contrast, semi-crystalline polymers provide superior mechanical strength, chemical resistance, and predictable melting behavior, making them suitable for durable implants and specific release mechanisms. The future of polymeric drug delivery lies in the rational design of smart, multi-functional systems that harness the unique properties of both morphologies. This includes the development of novel stimuliresponsive materials, sophisticated recognitive polymers for feedback-controlled release, and the integration of conductive nanomaterials for bioelectronic interfaces. By deepening our understanding of polymer morphology, researchers can continue to engineer next-generation therapeutic systems that improve targeting, efficacy, and patient outcomes in clinical practice.
References
- 1. Amorphous vs. Crystalline Polymers [https://www.mcpolymers.com/library/amorphous-vs-crystalline-polymers]
- 2. An Introduction to Amorphous Polymers [https://www.mcpolymers.com/library/introduction-to-amorphous-polymers]
- 3. Crystalline vs. Amorphous Polymers: Structural Overview [https://polyfluoroltd.com/blog/crystalline-vs-amorphous-polymers-structural-overview/]
- 4. Semi-Crystalline vs Amorphous Polymers: Which One Is ... [https://www.xometry.com/resources/materials/semi-crystalline-vs-amorphous-polymers/]
- 5. The secret to polymer crystallinity analysis [https://www.malvernpanalytical.com/en/learn/knowledge-center/insights/fast-and-flexible-polymer-analysis]
- 6. Polymer characterization techniques – an introduction [https://www.malvernpanalytical.com/en/learn/knowledge-center/insights/polymer-characterization-techniques]
- 7. Structural investigation of semicrystalline polymers [https://www.sciencedirect.com/science/article/pii/S0142941821000489]
- 8. Polymeric Nanostructures for Imaging and Therapy - PMC [https://pmc.ncbi.nlm.nih.gov/articles/PMC4610256/]
- 9. Polymers for bioimaging [https://www.sciencedirect.com/science/article/abs/pii/S0079670007000767]
- 10. Machine learning in polymer science: A new lens for ... [https://www.sciencedirect.com/science/article/abs/pii/S0079642525001227]
- 11. Simulation of semi-crystalline polyethylene: Effect of short- ... [https://www.sciencedirect.com/science/article/abs/pii/S0032386115300896]
- 12. Designing Polymers for Use in Next-Generation Bioelectronics [https://news.ncsu.edu/2025/10/engineering-polymer-electronics/]
- 13. Revolutionizing Polymer Science with Periodicity-Aware ... [https://bioengineer.org/revolutionizing-polymer-science-with-periodicity-aware-deep-learning/]
- 14. Effect of Crystallinity on Polymer Chain Compression in ... [https://link.springer.com/article/10.1007/s40870-025-00471-z]
- 15. Semi-crystalline and amorphous materials via multi ... [https://www.nature.com/articles/s41467-025-64092-9]
- 16. Cellulose I crystallinity estimation using a combination of ... [https://www.sciencedirect.com/science/article/abs/pii/S0144861725009956]
- 17. Quantitative characterization of crystallinity in semi ... [https://www.sciencedirect.com/science/article/pii/S0142941824003313]
- 18. A molecularly impermeable polymer from two-dimensional ... [https://www.nature.com/articles/s41586-025-09674-9]
- 19. The emergence of amorphous materials approaching the ... [https://pubs.rsc.org/en/content/articlehtml/2025/sc/d5sc02419f]
- 20. Synthesis of crystalline two-dimensional conjugated ... [https://www.nature.com/articles/s41467-025-57612-0]
- 21. Why do you need to know about polymer thermal transitions ? [https://optinova.com/news/why-do-you-need-to-know-about-polymer-thermal-transitions/]
- 22. Glass transition [https://en.wikipedia.org/wiki/Glass_transition]
- 23. Glass Transition Temperature (Tg) of Plastics [https://www.specialchem.com/plastics/guide/glass-transition-temperature]
- 24. Glass Transition Temperature (Tg) of Polymers [https://www.protolabs.com/resources/design-tips/glass-transition-temperature-of-polymers/]
- 25. Melting point | Definition & Facts [https://www.britannica.com/science/melting-point]
- 26. in Tg : What’s the Difference? vs Tm Polymers [https://eureka.patsnap.com/article/tg-vs-tm-in-polymers-whats-the-difference]
- 27. All About Glass | Xometry Transition Temperature [https://www.xometry.com/resources/materials/glass-transition-temperature/]
- 28. ( Glass ) of Transition for Plastic... | Fictiv Temperature Tg Polymers [https://www.fictiv.com/articles/glass-transition-temperature-tg-of-polymers-for-plastic-injection-molding]
- 29. Isotactic vs. Syndiotactic vs. Atactic in Polymers [https://www.cosmeticsandtoiletries.com/research/literature-data/article/21834431/comparatively-speaking-isotactic-vs-syndiotactic-vs-atactic-in-polymers]
- 30. 29.5: Correlation of Polymer Properties with Structure [https://chem.libretexts.org/Bookshelves/Organic_Chemistry/Basic_Principles_of_Organic_Chemistry_(Roberts_and_Caserio)/29%3A_Polymers/29.05%3A_Correlation_of_Polymer_Properties_with_Structure]
- 31. Impact of polymer tacticity on the physico-chemical ... [https://www.sciencedirect.com/science/article/abs/pii/S0378517311001190]
- 32. Crystallization of polymers [https://en.wikipedia.org/wiki/Crystallization_of_polymers]
- 33. Crystalline Polymers: Definition, Properties, Uses, and ... [https://www.xometry.com/resources/materials/crystalline-polymers/]
- 34. Polymeric Nanoparticles in Targeted Drug Delivery: Unveiling ... [https://pmc.ncbi.nlm.nih.gov/articles/PMC11991310/]
- 35. Smart Polymers in Controlled Drug Release: Mechanisms ... [https://jddhs.com/index.php/jddhs/article/view/73]
- 36. Characterisation of polymeric nanoparticles for drug delivery [https://pubs.rsc.org/en/content/articlelanding/2025/nr/d5nr00071h]
- 37. Polymeric Nanoparticles in Targeted Drug Delivery [https://pubmed.ncbi.nlm.nih.gov/40219222/]
- 38. Crystalline versus Amorphous State and Crystallization ... [https://pmc.ncbi.nlm.nih.gov/articles/PMC8594866/]
- 39. Advancing amorphous solid dispersions through empirical ... [https://pmc.ncbi.nlm.nih.gov/articles/PMC12362086/]
- 40. Phase-separated polymer blends for controlled drug ... [https://www.nature.com/articles/s43246-024-00678-y]
- 41. Direct Quantification of Drug Loading Content in Polymeric ... [https://pmc.ncbi.nlm.nih.gov/articles/PMC7598274/]
- 42. A dataset on formulation parameters and characteristics of ... [https://www.nature.com/articles/s41597-025-04621-9]
- 43. Utilizing machine learning for predicting drug release from ... [https://www.sciencedirect.com/science/article/pii/S0010482525001064]
- 44. Higuchi equation: Derivation, applications, use and misuse [https://www.sciencedirect.com/science/article/abs/pii/S0378517311002687]
- 45. Impact of amorphous and semicrystalline polymers on the ... [https://www.sciencedirect.com/science/article/abs/pii/S0032591013004488]
- 46. DIffusion, Dissolution and Pharmacokinetic Parameters.pptx [https://www.slideshare.net/slideshow/diffusion-dissolution-and-pharmacokinetic-parameterspptx/257162072]
- 47. Design, Characterization, and Release Kinetics of a Hybrid ... [https://pmc.ncbi.nlm.nih.gov/articles/PMC12030434/]
- 48. Evaluation of the Release Kinetics of a Pharmacologically ... [https://pmc.ncbi.nlm.nih.gov/articles/PMC6515312/]
- 49. Future Trends in Polymer Science: Materials, Design, and ... [https://www.mdpi.com/topics/T88WWY6M03]
- 50. Design, Development, and Characterization of High Drug ... [https://pubmed.ncbi.nlm.nih.gov/40328992/]
- 51. Advanced technologies for assessment of polymer swelling ... [https://www.sciencedirect.com/science/article/abs/pii/S0939641112003281]
- 52. Impact of drug-polymer complexation and media properties ... [https://www.sciencedirect.com/science/article/pii/S0022354925003466]
- 53. and dissolution Swelling of natural and man-made cellulose... kinetics [https://link.springer.com/article/10.1007/s10570-020-03312-5]
- 54. Biodegradable Polymer Use in Drug Delivery Systems [https://jddtonline.info/index.php/jddt/article/view/7421]
- 55. Revolutionary Biodegradable Drug Delivery Systems (2025) [https://pharmacores.com/revolutionary-biodegradable-drug-delivery-systems/]
- 56. Precision Polymers: Advances in Synthesis, Structural ... [https://www.sciencedirect.com/science/article/abs/pii/S0079670025001091]
- 57. Advanced rational design of polymeric nanoparticles for ... [https://www.sciencedirect.com/science/article/abs/pii/S0168365925005607]
- 58. PolyCL: contrastive learning for polymer representation ... [https://pubs.rsc.org/en/content/articlehtml/2025/dd/d4dd00236a]
- 59. Advances in stimuli-responsive polymers for biomedical ... [https://www.sciencedirect.com/science/article/abs/pii/S0927796X25002189]
- 60. Polymer Crystallinity Explained: How it Impacts Material ... [https://www.victrex.com/en/blog/2017/polymer-crystallinity-hpp-explained-part-3]
- 61. Control of polymers' amorphous-crystalline transition ... [https://www.nature.com/articles/s41467-024-47988-w]
- 62. Advances in Stimuli-Responsive Polymers: Design ... [https://www.jchemrev.com/article_218833.html]
- 63. Next Generation Stimuli Responsive Polymers for ... [https://pubs.rsc.org/en/content/articlelanding/2025/cc/d5cc02729b]
- 64. Chromic Schiff bases: transformative stimuli-responsive ... [https://pubs.rsc.org/en/content/articlehtml/2025/ma/d5ma00109a]
- 65. Hydrogel-Based Bioelectronics and Their Applications in ... [https://pmc.ncbi.nlm.nih.gov/articles/PMC10377104/]
- 66. A comparison: Amorphous vs crystalline polymers [https://www.essentracomponents.com/en-gb/news/manufacturing/injection-moulding/the-difference-between-amorphous-and-semi-crystalline-plastics]
- 67. In bioelectronics breakthrough, scientists create soft, ... [https://news.uchicago.edu/story/bioelectronics-breakthrough-scientists-create-soft-flexible-semiconductors]
- 68. Synergistic mastery: Advancing mechanical and electrical ... [https://www.sciencedirect.com/science/article/pii/S2452199X25002439]
- 69. Hydrogel-based piezoelectric materials and devices for ... [https://pubmed.ncbi.nlm.nih.gov/41075430/]
- 70. Biocompatible Natural Polymer-Based Amorphous Solid ... [https://pmc.ncbi.nlm.nih.gov/articles/PMC12349641/]
- 71. Optimizing drug nanoparticles release from amorphous ... [https://www.sciencedirect.com/science/article/abs/pii/S0378517325007951]
- 72. Mechanical properties of amorphous and semi-crystalline ... [https://www.sciencedirect.com/science/article/pii/S2405844020307027]
- 73. Advances in PCL, PLA, and PLGA-Based Technologies for ... [https://pmc.ncbi.nlm.nih.gov/articles/PMC12566892/]
- 74. Influence of Drug Properties, Formulation Composition ... [https://www.mdpi.com/2073-4360/17/18/2484]
- 75. Release performance and crystallization of racemic and ... [https://pubs.rsc.org/en/content/articlehtml/2025/pm/d5pm00117j]
- 76. Continuous Processing Strategies for Amorphous Solid ... [https://pmc.ncbi.nlm.nih.gov/articles/PMC12473836/]
- 77. Beyond Polymers: The Cyclodextrin Edge in Amorphous ... [https://www.linkedin.com/pulse/beyond-polymers-cyclodextrin-edge-amorphous-drug-delivery-sohajda-o2ibf]
- 78. Crystallization and Shrinkage in Plastic Products [https://kanademy.com/crystallization-and-shrinkage-in-plastic-products/]
- 79. Recent Progress on the Characterization of Polymer ... [https://pmc.ncbi.nlm.nih.gov/articles/PMC12526613/]
- 80. Moisture Absorption in Polymers: Key Factors for ... [https://aipprecision.com/moisture-absorption-in-polymers-critical-factors-for-aerospace-grade-stability/]
- 81. Moisture sorption by polymeric excipients commonly used ... [https://www.sciencedirect.com/science/article/abs/pii/S0378517322000862]
- 82. Chemical Resistance Testing - E Squared [https://www.e2techtextiles.com/chemical-resistance/]
- 83. Experimental Measurements for Moisture Permeations and ... [https://link.springer.com/chapter/10.1007/978-1-84800-239-5_41]
- 84. Experimental study on enhancing the waterproof and ... [https://www.sciencedirect.com/science/article/abs/pii/S2352710225003055]
- 85. Chapter 7 - Polymer degradation and stability [https://www.sciencedirect.com/science/article/pii/B9780128168066000078]
- 86. Advances in formulation strategies and stability ... [https://www.sciencedirect.com/science/article/abs/pii/S1773224725003259]
- 87. Role of crystallization in the phase inversion dynamics and ... [https://www.sciencedirect.com/science/article/abs/pii/S0168365900003540]
- 88. Comparative analysis of drug-salt-polymer interactions by ... [https://www.nature.com/articles/s42004-023-01006-0]
- 89. Elucidation of Molecular Interactions Between Drug ... [https://pmc.ncbi.nlm.nih.gov/articles/PMC10821732/]
- 90. Role of Drug-Polymer Phase Separation and Morphology [https://www.sciencedirect.com/science/article/abs/pii/S0022354922004774]
- 91. Release Mechanisms of Amorphous Solid Dispersions [https://hammer.purdue.edu/articles/thesis/Release_Mechanisms_of_Amorphous_Solid_Dispersions/21685124]
- 92. What affects the biocompatibility of polymers? [https://www.sciencedirect.com/science/article/abs/pii/S0001868621000920]
- 93. Biocompatible Natural Polymer-Based Amorphous Solid ... [https://pubmed.ncbi.nlm.nih.gov/40808107/]
- 94. Advanced Biocompatible and Biodegradable Polymers [https://pmc.ncbi.nlm.nih.gov/articles/PMC12611034/]
- 95. Overview of polymers and biopolymers degradation ... [https://www.sciencedirect.com/science/article/abs/pii/S0032386124004725]
- 96. Occurrence, toxicity and remediation of polyethylene ... [https://pmc.ncbi.nlm.nih.gov/articles/PMC8755403/]
- 97. Toxicity of plastics - Blastic [https://www.blastic.eu/knowledge-bank/impacts/toxicity-plastics/]
- 98. Environmental toxicity and decomposition of polyethylene [https://www.sciencedirect.com/science/article/pii/S0147651322007734]
- 99. A review of biomaterial degradation assessment ... [https://www.nature.com/articles/s41529-024-00487-1]
- 100. Materials designed to degrade: structure, properties ... [https://pubs.rsc.org/en/content/articlehtml/2025/py/d4py00623b]
- 101. The Difference Between Amorphous & Semi-crystalline ... [https://blog.impactplastics.co/blog/the-difference-between-amorphous-semi-crystalline-polymers]
- 102. Amorphous vs Crystalline Solids - Know the Differences [https://waferpro.com/amorphous-vs-crystalline-solids-know-the-differences/?srsltid=AfmBOor7DJ7DQcV0NGdLv_Q373fAMcpno_ASRh2ODHDclnw-g6REk6qc]
- 103. Study of Comparative Effects of Semicrystalline and ... [https://www.sciencedirect.com/science/article/abs/pii/S1566119925001211]
- 104. Two for one: Semi-crystalline and amorphous materials via ... [https://chemrxiv.org/engage/chemrxiv/article-details/67d9971bfa469535b9aefb09]
- 105. Effects of sterilization treatments on bulk and surface ... [https://pmc.ncbi.nlm.nih.gov/articles/PMC4228764/]
- 106. Effects of Steam Heat and Dry Heat Sterilization Processes ... [https://www.mdpi.com/2073-4360/14/5/855]
- 107. In Vitro Analysis of Biodegradation Properties and ... [https://link.springer.com/article/10.1007/s12663-025-02751-6]
- 108. Heat Sterilization Effects on Polymeric, FDM-Optimized ... [https://pmc.ncbi.nlm.nih.gov/articles/PMC8628910/]
- 109. Long-term in vivo degradation behavior of poly ... [https://www.sciencedirect.com/science/article/abs/pii/S0014305722004463]
- 110. Transparency of Polymers - Plastics [https://www.specialchem.com/plastics/guide/transparency]
- 111. 4.4 Optical properties - Polymer Chemistry [https://fiveable.me/polymer-chemistry/unit-4/optical-properties/study-guide/zrKBsfr553ULOANK]
- 112. A Comprehensive Review on Optical Properties of Polymer ... [https://pmc.ncbi.nlm.nih.gov/articles/PMC7503865/]
- 113. A brief review on optical properties of polymer Composites [https://www.sciencedirect.com/science/article/pii/S221137972301032X]
- 114. Medical Polymers Market Analysis & Forecast: 2025-2032 [https://www.coherentmarketinsights.com/market-insight/medical-polymer-market-4163]
- 115. Crystalline vs Amorphous Plastics - The Difference [https://www.lorric.com/en/Articles/Roechling/all/amorphous-vs-semi-crystalline]
- 116. Biomedical Polymers Analysis Report 2025 [https://www.archivemarketresearch.com/reports/biomedical-polymers-547978]
- 117. Amorphous vs. Crystalline Materials [https://www.eag.com/blog/amorphous-vs-crystalline-materials/]
- 118. XRD for Amorphous and Crystalline Polymers [https://www.drawellanalytical.com/xrd-for-amorphous-and-crystalline-polymers-what-to-look-for/]
- 119. Physical-chemical characterization of a crystallinity ... [https://www.sciencedirect.com/science/article/abs/pii/S0032386125005506]
- 120. Characterization Methods to Determine Interpenetrating ... [https://www.mdpi.com/2073-4360/16/14/2050]
- 121. Polymer Analysis/Characterization [https://resolvemass.ca/an-overview-of-analytical-techniques-for-polymer-characterization/]
- 122. DSC Analysis of Polymers | Thermal [https://www.eag.com/app-note/characterization-of-polymers-using-differential-scanning-calorimetry-dsc/]
- 123. Thermal and Viscoelastic Responses of Selected ... [https://pmc.ncbi.nlm.nih.gov/articles/PMC10181240/]
- 124. Mechanically induced polyamorphism in a one-dimensional ... [https://pubs.rsc.org/en/content/articlehtml/2025/sc/d4sc07058e]